Reika Abe, Masato Yamazaki, Kimi Ueda, Hirotake Ishii, Hiroshi Shimoda, Fumiaki Obayashi (2026). Designing Experiments to Explore Optimal Timing for Refreshing Breaks During Cognitive Tasks Using Time-Series Changes. In: Intelligent Human Systems Integration (IHSI 2026): Disruptive and Innovative Technologies. AHFE Open Access, vol. 200, pp. 119–130. https://doi.org/10.54941/ahfe1007071
In recent years, with the advancement of the information society, intellectual work has become increasingly prevalent, heightening the need for strategies to enhance its performance. To prevent a decline in intellectual work performance among office workers, taking short, proactive breaks such as around 20 seconds can be an effective strategy [1]. However, workers tend to avoid taking breaks voluntarily [2]. Thus, this study proposes a new concept of a refreshing break that uses airflow stimuli to notify break time without discomfort and to regain their focus on subsequent tasks through the refreshing effects of airflow stimuli. As the optimal timing for the refreshing break could vary between individuals, the first step of this study was to identify the timing at which individuals desire a refreshing break through a laboratory experiment.In this preliminary experiment, 8 university students participated, and each performed the 2 sessions of the 45-minute comparison task [3]. In the first session, airflow stimuli were automatically exposed at the timings of 5, 35, and 40 minutes to experience the efficacy of a refreshing break. At each timing, the airflow stimuli were exposed for 30 seconds to each participant’s hands. In the second session, participants pressed a button to request airflow whenever they felt the need to take a break with refreshing airflow stimuli, and the 30-second airflow stimuli were applied at those timings. The purpose of this session was to explore the optimal timing for each participant to take a refreshing break that would allow them to maintain concentration.Time-series analysis of concentration levels [4], based on response time data, was conducted to see the relationship between the shift in concentration and break timing. The results suggested that breaks taken at timings when concentration started to decline help restore concentration to higher levels and suppress further decline, whereas breaks taken based solely on subjective judgment were not always well timed. Subjective questionnaires indicated that none of the participants reported discomfort with the airflow stimuli, and thus, there is the possibility that airflow stimuli could serve as a comfortable cue to indicate break timing. Based on these findings, future research should aim to identify individual patterns of concentration decline by increasing the number of experimental sessions, as well as compare adaptive break-timing methods with regular periodic airflow stimulation. This comparison may help determine optimal break timing independent of self-judgment.[1] Dianita, O., et al. (2024) Systematic micro-breaks affect concentration during cognitive comparison tasks: quantitative and qualitative measurements. Advances in Computational Intelligence, 4(7).[2] Finstad, K., et al. (2006) Breaks and task switches in prospective memory. Applied Cognitive Psychology, 20(5), pp. 705-712.[3] Ueda, K., et al. (2016). Development of "Comparison Task" to measure intellectual concentration affected by room environment. Proceedings of the 2016 International Conference on Communication and Information Systems, pp. 58-64.[4] Ueda, K., et al. (2022). An analysis of the effect of integrated thermal control on cognitive task performance using time-series changes in intellectual concentration. AHFE 2022, 56, pp. 205-211.
In today’s information society, the demand for intellectual work is relatively high, and various studies have explored strategies to enhance intellectual work performance. Among these, balancing break time and work time is a crucial factor influencing intellectual productivity, as extended periods of continuous work can lead to decreased concentration. Henning et al. (1997) reported that during an hour of computer work, 30-second breaks taken
every 15 minutes increased overall performance. More frequently, Dianita et al. (2024) indicated that during 25 minutes of cognitive tasks, taking 30-second breaks every 7.5 minutes did not result in a decline in intellectual productivity compared to not taking breaks (Dianita et al., 2024). On the other hand, it has also been indicated that compulsory breaks can sometimes interrupt task progress, leading to decreased performance (Brazaitis & Satas, 2023). Therefore, a strategy that encourages comfortable and natural breaks is required.
One possible reason why regular breaks may sometimes fail to enhance concentration is that they can be imposed even when workers are highly focused and do not feel the need for a pause. While many studies have inves tigated different break intervals, no common optimal timing has been estab lished, and it has been concluded to depend on individual concentration characteristics (Lim & Kwok, 2016). Therefore, through laboratory-based experiments, this study aimed to explore when individuals themselves per ceive the need for a break as a preliminary step toward identifying the opti mal timing of breaks for sustaining concentration. In the experiment, partic ipants performed a 45-minute cognitive task and pressed a button to take a 30-second rest whenever they felt the need for a break. In addition, breaks without interventions that facilitate relaxation and recovery often fail to serve as effective opportunities for restoring concentra tion (Lee et al., 2015). To provide a clear signal of break time and to ensure that the break can contribute to concentration recovery, this study incor porated airflow stimuli. Airflow has been shown to have relaxing effects (Suseno & Hastjarjo, 2023). Moreover, airflow is one of the elements of nature, and it has been suggested that such natural stimuli can help refresh the mind and promote concentration recovery (Kaplan, 1995). Thus, in this experiment, a 30-second airflow was delivered to participants’ hands when they pressed the button, and they were instructed to rest while the airflow was present.
METHOD
Overview of the Experiment This study received approval from the Ethics Review Committee of the Graduate School of Energy Science at Kyoto University. Recruitment was conducted through the Kyoto University Cooperative, and 10 university stu dents, all native Japanese speakers, applied to participate. Prior to the lab experiment, participants completed two sets of the 45-minute comparison task at home to get used to the task and to find their own pace to complete the 45-minute task. Following the results of the tasks at home, participant screening was conducted, and 2 participants were excluded, leaving 8 par ticipants for the laboratory experiment. The lab experiment was conducted from 14:00 to 19:00 on August 19 and 20, 2024, with four participants per day. From response time data of the comparison task, time-series analysis of concentration levels was conducted to see the relationship between the shift in concentration and break timing.
Designing Experiments to Explore Optimal Timing for Refreshing Breaks 121 Lab Experimental Schedule
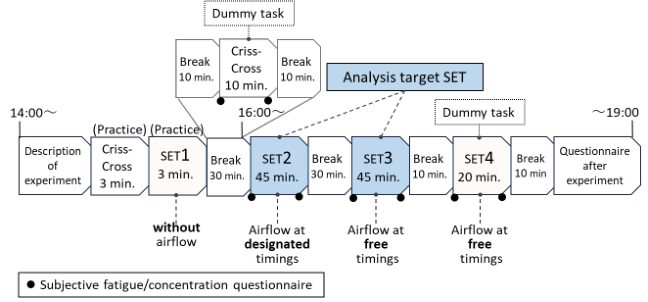
Figure 1 shows the schedule of the lab experiment. As a cognitive task, the comparison task developed by Ueda et al. (2016) was performed at each SET. After SET1 (practice for 3 minutes), participants experienced the air flow stimuli directed around their hands, both weak and strong, and were asked to decide the preferred intensity for the subsequent experiment. In SET2 of 45 minutes, airflow stimuli were automatically exposed at the fixed timings of 5, 35, and 40 minutes. At each time, the airflow stimuli were exposed for 30 seconds. Before SET2, participants were informed that there would be a 30-second airflow during the task, but they were not told the timing. They were instructed to take a break from the task while the airflow stimuli were exposed. The purpose of SET2 was to familiarize participants with the airflow stimuli and to let them experience a 30-minute task period without breaks with the airflow stimuli. Subsequently, in SET3 of 45 min utes, they pressed a button to request airflow whenever they felt the need to take 30-second breaks with airflow stimuli, and the 30-second airflow stimuli were applied at those timings. They were instructed to take a break during airflow exposure and to press the button at timings they believed would maximize their performance. The purpose of this SET was to explore the optimal timing for each participant to take a refreshing break that would allow them to maintain concentration.
Figure 1: Lab experimental schedule.
SET 2 was scheduled to start after 16:00 to avoid the post-lunch dip effect, which causes sleepiness after lunch (Monk, 2005). SET4 was conducted to eliminate the terminal effects from SET3, where motivation increases at the end of a task (Ishii et al., 2018). The criss-Cross task was performed between the comparison tasks to alleviate the monotony of the tasks.
Experimental Environment
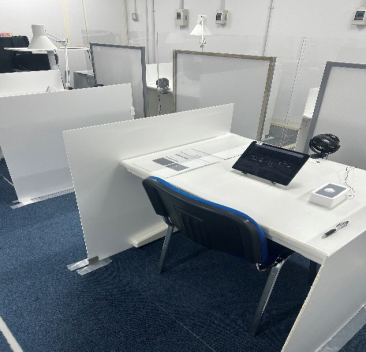
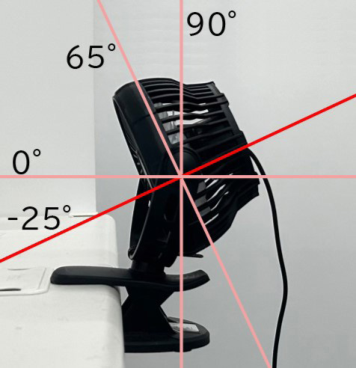
Figure 2 shows the participants’ desk setup. Participants performed the com parison task on a tablet computer positioned on a stand. A desktop fan was
placed on the top center of the desk, and its rotating part was angled down ward toward the desk at −25° as shown in Figure 3. On the top left of the desk, a file of papers for the Criss-Cross tasks was placed, and on the bottom left, a file of explanatory documents was placed. These files were turned over during the comparison task to prevent these characters from becoming dis tracting visual information. The button to request airflow was positioned on the right side of the desk.
Figure 2: Work desk.Figure 3: Angle of the desktop fan.
Designing Experiments to Explore Optimal Timing for Refreshing Breaks 123 Subjective Questionnaires
Subjective Fatigue/Concentration Questionnaire Before and after the comparison task, participants’ subjective levels of fatigue and concentration were measured on a graphical scale. The level of accumulated fatigue was asked from 0: no fatigue at all, to 100:cannot con tinue work. The level of concentration on the task was asked from 0: cannot (could not) concentrate at all, to 100: can (could) concentrate more than ever before. Participants’ previous answers were displayed at the top, and they were able to answer while referring to these answers.
Questionnaire After the Experiment A multiple-choice questionnaire asking about preferences for airflow stim uli and an open-ended questionnaire asking about the timings when they pushed the button in SET3 were conducted after the experiment.
Screening Criteria Before the lab experiment, participants completed two sets of 45-minute comparison tasks at home to get used to the task and to adjust to the pace required for the task. Checking the results of the tasks at home, some par ticipants were excluded from participating in the lab experiment, following the data cleansing criteria: I. Participants who did not do the task, and II. Participants whose answering time continued to get faster. Regarding crite rion II, these participants were excluded because they might not have fully become accustomed to the task.
Analysis of Time-Series Changes in Intellectual Concentration Participants’ changes in intellectual concentration level during the 45-minute comparison task were analysed using a method that calculates the time-se ries changes in intellectual concentration from answering time data (Ueda et al., 2022). This method is based on the analysis of the Concentration Time Ratio (CTR), developed by Miyagi et al. (2013). From the overall answering time histogram analysis, the concentration state can be fitted as a log-normal distribution, and the expected answering time in the concen tration state (E) is determined. Then, for each response time, if the response time is less than E, that response time is regarded as the concentration time. If the response time is greater than E, E is regarded as the concentration time, and the rest of the response is regarded as the non-concentration time. Then, the concentration level within a given time window is calculated as the total concentration time within that window. Using this method, the change in concentration level over time can be observed by calculating this ratio for each shift time.
RESULT
Participants in the Laboratory Experiment Based on the results of tasks at home, 2 participants were excluded from par ticipating in the lab experiment: Participant ID5 (Criterion II) and Participant ID7 (Criterion I). Thus, 8 participants joined the lab experiment. Among them, one was female and the others were male. Their average age was 22.3 ± 1.85 years old.
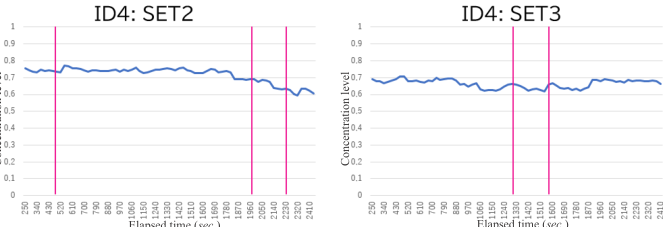
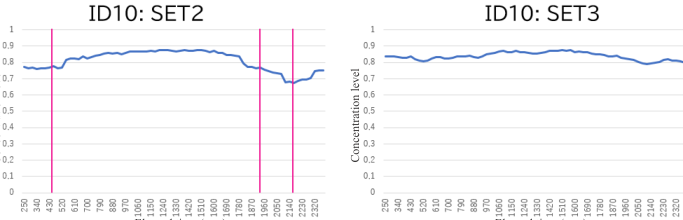
Time-Series Changes The time-series changes in the concentration level were analysed with a 500-second time window and a 30-second shift time, consistent with a pre vious study employing same cognitive tasks (Ueda et al., 2022). Figures 4 and 5 show the results of each participant in SET2 and SET3, respectively. The x-axis indicates the elapsed time, and the y-axis indicates the concentration level. In SET2, red lines show when the airflow was automatically exposed by the timings of 5, 35, and 40 minutes. In SET3, red lines show when the airflow was exposed by the timings when the button was pressed.
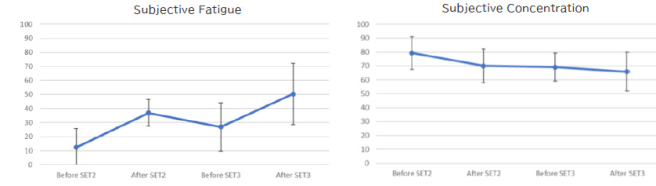
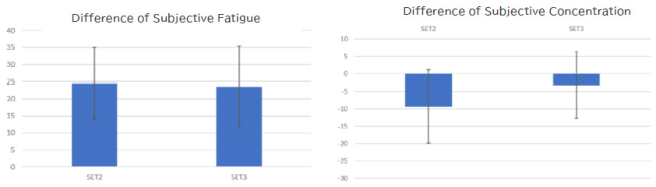
Figure 6 shows the transition of subjective Fatigue and Concentration in subjective questionnaires. Fatigue tends to accumulate, and concentration tends to decline over time. Figure 7 shows the changes in subjective Fatigue and Concentration for each SET, calculated by subtracting the value before SET from the value after SET. There is no outstanding difference in the level of accumulated fatigue between SETs, but a tendency was observed where concentration did not drop in SET 3 as much as in SET 2.
Questionnaire After the Experiment Regarding the comfort or discomfort of the airflow stimuli, with 0 repre senting discomfort and 5 representing comfort on a 6-point Likert scale, the participants’ average score was 3.75±0.46. All participants gave ratings of 3 or higher. In particular, among the participants who did not press the but ton in SET 3, ID3 gave a rating of 4, and ID10 gave a rating of 3, indicating that even those who did not press the button did not find the airflow stimuli uncomfortable. In addition, regarding the timing of pressing the button in SET 3, the participants, except for ID3 and ID10, who did not press the but ton, reported that they pressed it when their concentration dropped or when their response speed slowed.
Concentration level
Concentration level
Elapsed time (sec.) Elapsed time (sec.)
Concentration level
Elapsed time (sec.)
Elapsed time (sec.)
Concentration level
Concentration level Concentration level
Elapsed time (sec.)
Elapsed time (sec.)
Concentration level
Concentration level
Elapsed time (sec.) Elapsed time (sec.)
Figure 4: Time-series changes of participant ID1 to ID4.
Concentration level
Elapsed time (sec.) Elapsed time (sec.)
Concentration level
Concentration level Concentration level
Elapsed time (sec.) Elapsed time (sec.)
Concentration level
Concentration level
Elapsed time (sec.) Elapsed time (sec.)
Concentration level
Concentration level
Elapsed time (sec.) Elapsed time (sec.)
Figure 5: Time-series changes of participant ID6 to ID10.Figure 6: Transition graph of subjective fatigue and concentration.Figure 7: Differences in before SET and after SET of subjective fatigue and concentration.
DISCUSSION
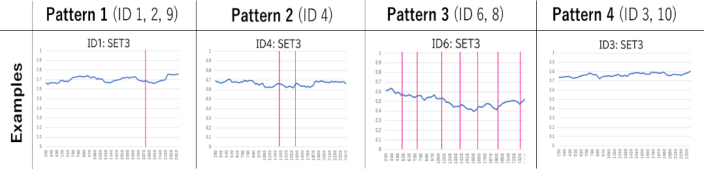
Based on Figures 4 and 5, the transitions in each participant’s concentration level in SET3 could be classified into four patterns, as shown in Figure 8. Pattern 1 is where button presses occur a few times, mainly towards the second half: participants ID1, ID2, and ID9. Pattern 2 is where button presses occur a few times in the middle: participant ID4. Pattern 3 involves frequent but ton presses starting from the beginning: participants ID6 and ID8. Pattern 4 is where there are no button presses at all: participants ID3 and ID10.
Figure 8: Overview of the four patterns.
In Pattern 1, ID1 and ID2 in SET2 showed a tendency for the concentra tion level to decrease in the latter half. In SET3, the decline was not as pro nounced as in SET2, but still, in SET3, taking breaks in the latter half—when concentration is more likely to decrease for ID 1 and ID2—may have helped to suppress the decline in concentration level. On the other hand, although ID9 maintained a relatively high concentration level in SET2, it declined in
the latter half of SET3, leading to the button presses. However, the three breaks taken by ID9 in SET3 did not restore concentration to the higher level observed in the first half of SET3. Compared with other participants, ID9 tended to press the button only after concentration had already declined substantially. This might suggest that, in order to maintain a higher level of concentration, it could be necessary to take breaks from an earlier stage, when concentration starts to drop.
In Pattern 2, ID4 experienced a decline in concentration level at the end of SET2, but in SET3, the decline occurred in the middle, which is likely why the button was pressed.
In Pattern 3, ID6 and ID8 showed a tendency for the concentration level to gradually decline from the beginning in SET2. Thus, it is assumed that they attempted to maintain their concentration level in SET3 by taking regular breaks from the start.
Finally, in Pattern 4, ID3 and ID10 were able to maintain their concentra tion levels without taking any breaks in SET3, implying that taking breaks might have been perceived as disrupting their concentration.
From the results of subjective concentration shown in Figure 7, it was suggested that, on average, participants found it easier to concentrate in SET3, where they could choose their own break timings, compared to SET2. Regarding subjective fatigue, although the differences were smaller than those observed for subjective concentration, participants on average reported slightly less fatigue accumulation in SET3. While order effects should also be considered, the results that participants found it easier to concentrate in SET3 than in SET2, and that fatigue levels were comparable despite SET3 being conducted in the latter set—when fatigue is generally more likely to accumulate—might suggest that individually chosen break timings in SET3 could be more effective than the fixed break timings in SET2.
Overall, in Figures 4 and 5, SET3 showed a tendency to maintain con centration from the beginning of the task compared to SET2. This may be because participants were able to take breaks at the times when their concen tration had started to decline, as answered in the open-ended questionnaire after the experiment. However, as seen in ID9, taking a break after con centration had already dropped considerably might not function effectively for recovering concentration. With breaks taken based solely on subjective judgment, there is a possibility that the initial signs of declining concentra tion might be overlooked. Therefore, this preliminary study suggests that promoting breaks through external stimuli at relatively early stages may help sustain concentration.
In addition, SET2 and SET3 were quite insufficient for capturing each participant’s pattern of changes in concentration. Therefore, future studies should include an additional 45-minute set after SET3 or conduct a similar experiment on another day to determine whether individuals show consis tent patterns of concentration change. This could clarify whether the timing of breaks can be fixed depending on the person, or whether concentration fluctuations differ completely across sets, requiring real-time detection of concentration decline.
CONCLUSION
This study explored the timing at which a 30-second break is needed. Several patterns were observed in the timing of participants pressing the button, and the findings suggested that breaks taken at optimal timings may help suppress concentration decline. However, the results also indicated that breaks based on subjective judgment may not always sustain high concen tration, highlighting the need for further investigation. Future studies should examine individual patterns of concentration and optimal break timings in detail. In addition, it would be valuable to investigate the preventive effects of breaks by comparing the efficacy of regular, periodic breaks with that of breaks taken at optimal timings of concentration decline. Notably, as no participants reported discomfort with the airflow stimuli, it might be plau sible that breaks with airflow stimuli could serve as a preventive measure to sustain concentration without disrupting ongoing focus during periods of high concentration.
REFERENCES
Brazaitis, M. & Satas, A. (2023). Regular short-duration breaks do not prevent men tal fatigue and decline in cognitive efficiency in healthy young men during an office-like simulated mental working day: An EEG study. International Journal of Psychophysiology: Official Journal of the International Organization of Psycho physiology, 188, pp. 33–46. Dianita, O., Kitayama, K., Ueda, K., Ishii, H, Shimoda, H., & Obayashi, F. (2024).
Systematic micro-breaks affect concentration during cognitive comparison tasks: quantitative and qualitative measurements. Advances in Computational Intelli gence, 4(7). Henning, R. A., Jacque, P., Kissel, G. V., Sullivan, A. B., & Alteras-webbai, S. M.
(1997). Frequent short rest breaks from computer work: effects on productivity and well-being at two field sites. Ergonomics, 40(1), pp. 78–91. Ishii, H., Kanagawa, H., Shimamura, Y., Uchiyama, K., Miyagi, K., Obayashi, F., & Shimoda, H. (2018). Intellectual productivity under task ambient lighting. Lighting Research & Technology, 50(2), pp. 237–252. Kaplan, S. (1995). The restorative benefits of nature: Toward an integrative frame
work. Journal of Environmental Psychology, 15(3), pp. 169–82. Lee, K. E., Williams, K. J. H., Sargent, L. D., Williams, N. S. G., & Johnson, K. A.
(2015). 40-Second Green Roof Views Sustain Attention: The Role of Micro-Breaks in Attention Restoration. Journal of Environmental Psychology, 42, pp. 182–189. Lim, J. & Kwok, K. (2016). The Effects of Varying Break Length on Attention and Time on Task. Human Factors, 58(3), pp. 472–481. Miyagi, K., Oishi, K., Uchiyama, K., Ishii, H., & Shimoda, H. (2013). Proposal of
Intellectual Productivity Model Based on Work State Transition. International Conference on Engineering Psychology and Cognitive Ergonomics, pp. 335–343. Monk T. H. (2005). The post-lunch dip in performance. Clinics in sports medi cine, 24(2), pp. 15–23. Suseno, B. & Hastjarjo,T. D. (2023). The effect of simulated natural environments in
virtual reality and 2D video to reduce stress. Frontiers in Psychology, 14.
Ueda, K., Tsuji, Y., Shimoda, H., Ishii, H., Obayashi, F., & Taniguchi, K. (2016).
Development of “Comparison Task” to Measure Intellectual Concentration Affected by Room Environment. Proceedings of the 2016 International Conference on Communication and Information Systems, pp. 58–64. Ueda, K., Yumura, K., Ishii, H., Shimoda, H., & Obayashi, F. (2022). An Analysis of the Effect of Integrated Thermal Control on Cognitive Task Performance Using Time-Series Changes in Intellectual Concentration. Human Factors, Business Management and Society, 56, pp. 205–210.
LISTED IN THE AHFE DIGITAL BOOKSTORE CATALOGUE
Explore the complete digital volume
Intelligent Human Systems Integration (IHSI 2026): Disruptive and Innovative Technologies
Read this individual research paper free through the original publisher, or explore the full digital proceedings book.
ISBN 978-1-964867-76-2
Explore this ISBN in the AHFE Bookstore ↗Listed in the July 2026 bookstore catalogue; search by ISBN to confirm current availability · Digital book purchase optional