In this paper, we explore the technology that directly connects brainwaves to image systems, incorporating insights from brain science, computer science, and visual design. Firstly, the paper reviews the pivotal literature concerning the evolution and advancements in electroencephalogram (EEG) technology. Secondly, the paper outlines the background and application scenarios of brain-computer interfaces (BCI) and investigates the main image-generating brain-computer interface (BCII). Finally, our team has developed a personalized, human-centered BCD (brain-computer doodle) board utilizing EEG and BCII technologies, demonstrating its practical applications and the potential impact of our work.
In the era of rapid technological development today, interdisciplinary research has become a key force driving scientific progress. The research on the connection between brainwaves and image systems, as a highly promising interdisciplinary field, is receiving increasing attention.
Brain science, a discipline dedicated to studying the structure and function of the human brain, has long been committed to revealing the mysteries of the human brain and exploring how the brain generates complex physiological and psychological processes such as consciousness, perception, thinking, and behaviour. As the renowned brain scientist David Eagleman pointed out, the complexity of the brain far exceeds our imagination. Traditional research methods struggle to penetrate the inner workings of the brain, which is often regarded as a “black box”. Eagleman emphasized in his works that the intricate structure and diverse neural activity patterns of the brain make it extremely difficult to understand how the brain processes various types of information relying solely on traditional observation and experimental methods (Eagleman, 2015). With the rapid development of computer science, especially the continuous advancement of artificial intelligence, machine learning, and big data processing technologies, entirely new technical means and research ideas have been provided for brain science research. As Andrew Ng, a leading figure in the field of computer science, put it, machine learning and big data technologies can bring unprecedented opportunities to the research of various disciplines (Ng, 2024). By combining these advanced technologies with brain science, we can analyse and process massive amounts
of electroencephalogram (EEG) data more efficiently, thereby uncovering the hidden information and patterns behind brain activities.
Currently, the importance of the research on the connection between brainwaves and image systems in the interdisciplinary field is mainly reflected in the following aspects. Firstly, it helps to break through the limitations of traditional research methods and achieve a deeper understanding of brain functions and visual perception mechanisms. By combining the research methods of brain science and computer science, we can analyse and study the neural activities of the brain from multiple perspectives, thereby revealing the internal mechanisms and laws of the brain when processing visual information. Secondly, this research is of great significance for promoting the development of artificial intelligence and robotics technologies. As Professor Li Feifei, an expert in artificial intelligence, said, enabling machines to better understand human visual perception and ways of thinking is the key to achieving truly intelligent human-computer interaction and autonomous decision-making. People should attach importance to the scientific research behind artificial intelligence while paying attention to its engineering applications, and emphasize the crucial role of identifying key issues in promoting the development of the artificial intelligence field (Fei-Fei & Krishna, 2022). Just as Einstein remarked, “The mere formulation of a problem is often far more essential than its solution”.
If an effective connection can be established between brainwaves and image systems, machines will be able to better understand human visual perception and ways of thinking, thereby achieving more intelligent human- computer interaction and autonomous decision-making (Chen et al., 2024). Moreover, the research on the connection between brainwaves and image systems holds great promise for providing new means and methods for medical diagnosis and treatment. For instance, it is possible to detect and diagnose neurological diseases by analysing brainwave signals, or use image systems to assist in rehabilitation therapy.
However, at present, the research on the connection between brainwaves and image systems is still confronted with numerous challenges and problems, which highlights the urgency of this research. On the one hand, due to the characteristics of brain electrical signals, such as being weak, easily interfered with, and non-linear, how to accurately collect and analyse EEG data remains a pressing problem that needs to be solved urgently. On the other hand, the relationship between the brain’s neural activities and image systems is extremely complex, and our current understanding of it is still very limited. How to establish effective mathematical models and algorithms to achieve accurate mapping and transformation between brainwaves and image systems is one of the key issues in the current research. In addition, this research involves the cross-integration of multiple disciplinary fields, and it requires close cooperation among researchers from different disciplines to jointly overcome the difficulties encountered in the research.
EEG-Driven Personalized Visual Communication 73
A REVIEW OF BRAIN COMPUTER INTERFACE In 1929, Hans Berger first introduced the concept of electroencephalography (EEG) (Berger, 1929). In the 1970s, simple communication systems driven by electrical activity recorded from the head were developed. The Advanced Research Projects Agency (ARPA) began to focus on the interaction between humans and machines (computers), including applications in “bionics”. The input of a Brain-Computer Interface (BCI) includes specific electroen- cephalographic (EEG) features that reflect the user’s encoded intentions within the EEG. The output of a BCI can be device control forms such as cursor movement, letter or icon selection. Signal processing and translation algorithms convert the input EEG features into output control signals. One of the performance metrics for BCIs is bit rate, which measures the amount of information transmitted per unit of time.
Introduction
Currently, BCI is being integrated with other interaction modalities such as eye tracking, speech, facial expressions, gestures, body postures, and various physiological signals. This integration facilitates context-aware and context- dependent interpretation of brain signals. BCI technology is being combined with wearable sensors, speech processing, speech recognition, and computer vision technologies. Research in human-computer interaction is exploring numerous application areas beyond assisting disabled users in controlling devices or sensors. These applications include artistic visualization, digital painting, artistic musification, game control, and interaction with social robots (Nijholt, 2015).
Typically, a brain-computer interface (BCI) is an artificial intelligence- based system that identifies specific patterns in electroencephalographic (EEG) signals through several sequential phases. These phases include signal acquisition for capturing brain signals, preprocessing or signal enhancement to prepare the signals for further analysis, feature extraction to identify distinguishing information within the recorded brain signals, classification to categorize the signals based on the extracted feature vectors, and finally, the control interface phase, which translates the classified signals into commands for any connected device (Hassanien et al., 2015).
A BCI is a communication system that does not rely on peripheral nerves and muscles. These systems monitor and translate brain-generated EEG activity or the activity of individual cortical neurons recorded from implanted electrodes into specific commands (Birbaumer et al., 2000).
A successful project led by Dr. Jacques Vidal, Director of the Brain-Computer Interface Laboratory at the University of California, Los Angeles (UCLA), utilized computer-generated visual stimulation and sophisticated signal processing techniques. The research demonstrated that single-trial (i.e., non-averaged) visual evoked potentials (VEPs) could provide a communication channel, enabling humans to control the movement of a cursor through a two-dimensional maze. This indicates that advanced technological methods can achieve direct communication between brain activity and computer systems, thereby controlling external
74 Chen
devices. This represents a significant breakthrough in brain-computer interface research, highlighting its potential in communication and control applications (Vidal, 1977).
Overview of EEG, EOG, EMG, and Image-Generating Brain-Computer Interfaces (BCII) Electroencephalography (EEG): Electroencephalography (EEG) is a critical tool for observing brain activity due to its low cost, ease of use, and excellent temporal resolution (Repovas, 2010), despite its poor spatial resolution (Tan and Nijholt, 2010). It is practical non-invasive brain imaging method for repeated real-time behavioural analysis (Smith, 2004), making it a primary focus for brain-computer interface (BCI) designing signals vary with brain activity states, allowing the identification of several rhythms: Delta (0.5–4 Hz), Theta (4–7 Hz), Alpha (8–13 Hz), Beta (13–30 Hz), and Gamma (35 Hz and above). A typical block diagram of EEG signal processing for BCI includes several stages: signal acquisition, preprocessing or signal enhancement, feature extraction, classification, and control interface. These stages enable the translation of brain activity into meaningful commands for connected devices (Semmlow, 2011).
Electrooculography (EOG), electromyography (EMG): Electrooculography (EOG) and electromyography (EMG) artifacts are significant sources of physiological artifacts in brain-computer interface (BCI) systems. Typically, the first step in handling these artifacts is to prevent their occurrence by instructing users to avoid blinking or moving during experiments. If artifacts still occur, the next step is artifact rejection, which involves manually or automatically rejecting trials affected by artifacts. Although automatic rejection is less labour-intensive, it can lead to sampling bias and data loss. The final and most challenging method is artifact removal, which involves identifying and removing artifacts from brain signals while preserving the related neurological phenomena. Common methods for removing artifacts in EEG signals include filtering and higher-order statistical separation (Smith, 2004).
Image-Generating Brain-Computer Interface (BCII): The image-generating brain-computer interface (BCII) represents an emerging and groundbreaking technology that lies at the crossroads of brain science, computer science, and visual perception. The fundamental principle of Brain-Computer Interface for Image Generation (BCII) lies in capturing, analysing, and transforming brain signals into meaningful visual outputs. Electroencephalography (EEG) technology is one of methods, which operates by arranging electrodes on the patient’s scalp in a symmetrically distributed pattern. Such a setup enables the effective monitoring of the electric fields collected by these electrodes, which is of vital importance for obtaining the fundamental data necessary for subsequent analysis and research (Allard, 2022).
A few recent studies (Tirupattur et al., 2018) have demonstrated that when a subject is exposed to a visual stimulus, EEG signals indeed contain informative cues. The specific objective is to extract the latent representation from these EEG signals and then further decode them to generate images
EEG-Driven Personalized Visual Communication 75
that belong to the same class as the provided visual stimulus. Brain electrical signals exhibit notable differences across various individuals. Moreover, the brain electrical signals of a single individual also display instability at different times and under different states. A technology assessment explores BCI implanted in the brain or worn on the head. BCI systems enable people to control electronic devices via brain signals and has positively impacted several industries, including entertainment and gaming, automation and control, education, neuromarketing, and so on (Maiseli et al., 2023). It notes that in clinical trials, they have aided those with severe disabilities, and businesses are investing in their development for entertainment and other purposes. Meanwhile, the assessment identifies challenges such as uncertainties regarding the ownership of sensitive brain data, long - term support for those with implanted devices, and the coverage provided by Medicare and private insurers (U.S. Government Accountability Office, 2025). This situation presents a substantial challenge to the signal processing and pattern recognition of BCII. Besides, brain electrical signals are extremely feeble and are highly susceptible to external environmental interference as well as the body’s own physiological factors such as muscle movement, blinking, and heartbeat. This indicates that brain connectivity cannot be studied in isolation; instead, it must be recognized that it is intricately interdependent with various environmental factors, among other elements (Triana et al., 2024). Thus, enhancing the accuracy and reliability of signal collection has emerged as a crucial problem confronting BCII.
INTEGRATION OF EEG AND BCII TECHNOLOGIES This experiment aims to monitor brain EEG signals using the Muse 2 headband and to transmit and analyze the data using the Mind Monitor application and TD software, ultimately developing a personalized, human-centered Brain-Computer Doodle (BCD) board. First, we review the advancements in EEG technology, emphasizing the relevance and modernity of our experimental methods. Next, we utilize the Mind Monitor application and TD software to record and display EEG data, facilitating the exploration of brain-computer interface (BCI) applications in various scenarios. Subsequently, we integrate brainwave data to generate images, demonstrating the potential applications of EEG data. Finally, we develop the Brain-Computer Doodle (BCD) board using EEG and BCII technologies, showcasing the creative applications of brainwave analysis.
Experiment Preparation The following equipment was used in this experiment:
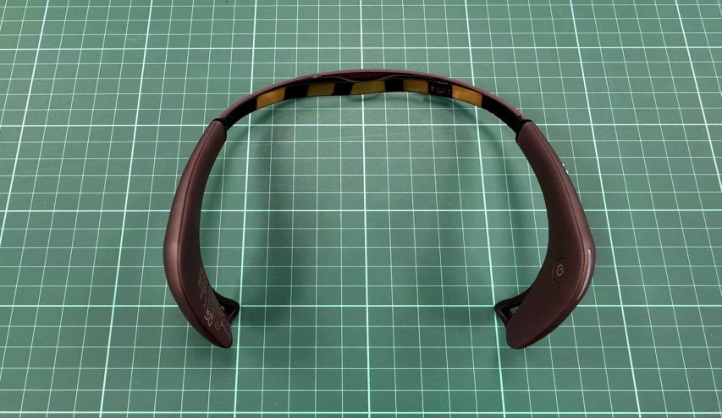
Hardware: Muse 2 Headband: Used for monitoring brain EEG signals. Smartphone: Installed with the Mind Monitor application to receive and display EEG signals.
Computer: Installed with Touch Designer software for receiving and analysing EEG data.
76 Chen
Figure 1: Muse 2 headband (photo by author, 2025).
Software: Muse 2: First, ensure the Muse 2 headband is fully charged. Wear the headband, adjusting its position so that the sensors make good contact with the skin on the forehead and behind the ears. Turn on the Muse 2 headband and check that the indicator light is flashing normally, indicating the device is powered on.
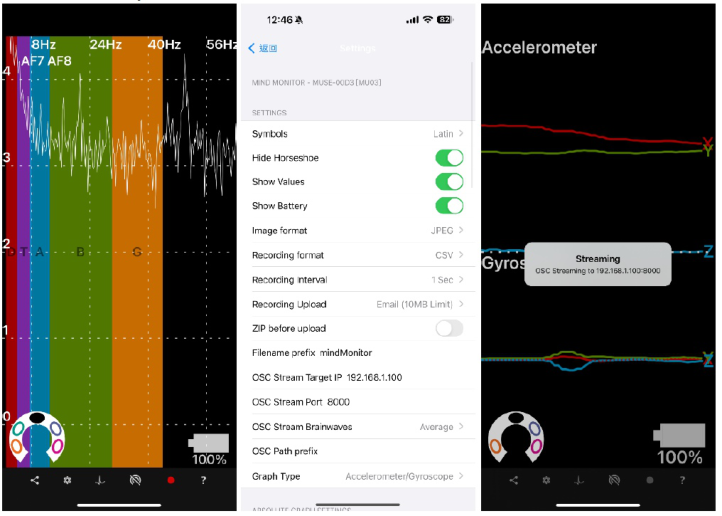
Mind Monitor: Enable Bluetooth on the smartphone and launch the Mind Monitor application. Wait for the application to detect the Muse 2 device. Select the Muse 2 device in the application to pair it. Once the connection is successful, the application interface will display real-time EEG signals.
Navigate to the settings page of the Mind Monitor application. Locate the “OSC Stream Target IP”option and enter the local IP address of the computer (e.g., 192.168.1.100). Ensure the port number is set to e.g., 8000. Changes are ok, but ensure the TD software port number matches.
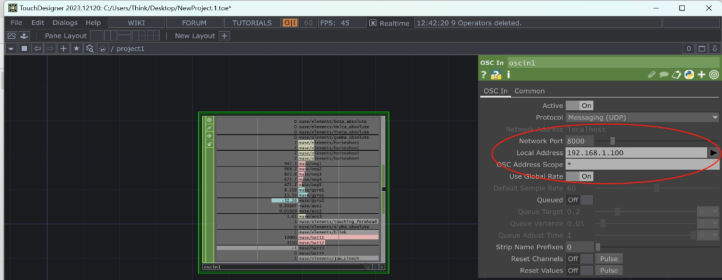
TD Software Setup: Launch the TD software on the computer and wait for it to load completely. In the TD software, find the option to receive OSC data and enter the listening port number 8000. Save the settings and confirm that the TD software is ready to receive data.
Data Transmission In the Mind Monitor application, return to the main interface and click the “Streaming”button to start transmitting EEG data to the computer via Wi-Fi. In the TD software, observe whether it starts receiving and displaying EEG data. If data is not displayed, check the network connection and settings for correctness.
Besides, we had ensured all devices had stable Bluetooth and WiFi connections to avoid signal interruptions. If connection issues had arisen, we had tried restarting the devices or re-pairing the Bluetooth connection.
EEG-Driven Personalized Visual Communication 77
We had ensured the Mind Monitor application and TD software were up to date to avoid compatibility issues. We had regularly saved experimental data to prevent data loss.
Figure 2: Capturing the operational interface of mind monitor (credit by author, 2025).Figure 3: Capturing the connection interface of touch designer (credit by author, 2025).
METHODOLOGIES We had followed these detailed steps to configure the connection between the Mind Monitor application and Touch Designer:
78 Chen
Selecting OSC IN in Touch Designer We had opened the Touch Designer software and, in the network editor, right- clicked on a blank area, selected the “CHOP” menu, and chosen the “OSC In” node.
Modifying OSC IN Node Configuration We had selected the “OSC In” node and opened the parameter window. In the “Network” tab, we had found the “Local Address” and “Network Port” settings.
Configuring Local Address and Network Port We had set the Local Address to the local IP address of our laptop. We had set the Network Port to the same port number as the OSC Stream Port in the Mind Monitor application (e.g., 8000).
Configuring OSC Stream in Mind Monitor Application We had opened the Mind Monitor application and navigated to the settings page. We had found the “OSC Stream Target IP”option and entered the local IP address of our laptop. We had also found the “OSC Stream Port” option and entered the same port number as set in Touch Designer (e.g., 8000).
Obtaining the Local IP Address of Our Laptop On our windows laptop, we had pressed Win + R, typed cmd, and pressed Enter to open the Command Prompt. In the Command Prompt, we had typed ipconfig and pressed Enter. We had looked for the “Wireless LAN adapter” or “Ethernet adapter” section and found the “IPv4 Address,” which was our local IP address (e.g., 192.168.1.100).
Confirming the Connection We had ensured all devices (Muse 2 headband, smartphone, laptop) were connected to the same WiFi network. In the Mind Monitor application, we had clicked the “Streaming” button to start transmitting EEG data to the laptop via WiFi. In Touch Designer, we had confirmed that the “OSC In” node started receiving and displaying EEG data.
EEG DATA VISUALIZATION Adding CHOP Select Node
In the network editor, the DAT to CHOP node was double-clicked, the “CHOP” menu was selected, and the “Select CHOP” node was chosen. The Select CHOP node was connected to the DAT to CHOP node to select the required CHOP channel data. In the parameter window of the Select CHOP node, the “Channels” parameter was set to select the necessary brainwave data channels (e.g., alpha, beta, delta, theta).
Adding TOP Noise Node In the network editor, the “TOP” menu was selected, and the “Noise TOP” node was chosen. The Noise TOP node was placed in the network and
EEG-Driven Personalized Visual Communication 79
double-clicked to open its parameter window. In the parameter window, the “Monochrome” option was set to “Off” to generate coloured noise.
Connecting CHOP Data to TOP Noise Node In the network editor, the Noise TOP node was right-clicked, the “CHOP” menu was selected, and the “CHOP to TOP” node was chosen. The CHOP to TOP node was connected to the Noise TOP node to apply the CHOP data to the noise parameters. In the parameter window of the CHOP to TOP node, the data mapping was configured so that the alpha, beta, etc., channels controlled the “Period,” “Harmonic Spread,” and “Exponent” parameters of the Noise TOP node.
Adding COMP Node In the network editor, an empty area was double-clicked, the “COMP” menu was selected, and the “Geometry COMP” node was chosen. The Geometry COMP node was placed in the network and double-clicked to enter its internal network.
Adding SOP Node Inside the Geometry COMP network, an empty area was double-clicked, the “SOP” menu was selected, and the “Sphere SOP” node was chosen. The Sphere SOP node was placed in the network and double-clicked to open its parameter window. In the parameter window, the Sphere SOP node’s parameters were configured to generate a sphere.
Connecting Data to Drawing Node Inside the Geometry COMP network, the Sphere SOP node was right- clicked, the “CHOP” menu was selected, and the “CHOP to SOP” node was chosen. The CHOP to SOP node was connected to the Sphere SOP node to apply the CHOP data to the sphere’s parameters. In the parameter window of the CHOP to SOP node, the data mapping was configured to dynamically adjust the sphere’s shape and position based on the brainwave data.
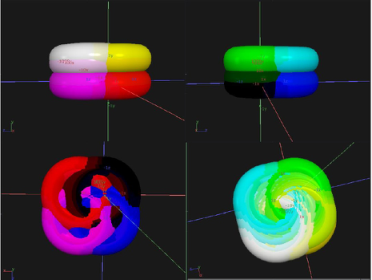
Figure 4: Brain-computer doodle (BCD) board (credit by author, 2025).
80 Chen
Through these optimized steps, the processed brainwave data was successfully applied to multiple nodes in Touch Designer, generating a real- time graffiti-style drawing effect. These settings demonstrated how to utilize brainwave signals for dynamic visual creation. Computer, Control and Communication
CONCLUSION
This paper explores the direct connections between brainwaves and image systems, integrating insights from brain science, computer science, and visual perception. It begins with a review of key literature on the evolution and advancements in electroencephalogram (EEG) technology, outlines the background and application scenarios of brain-computer interfaces (BCI), and examines the primary image-generating brain-computer interface (BCII). In the experiment, the Muse 2 device and Mind Monitor application were used to record and transmit brainwave data, which was then visualized in Touch Designer (TD). Finally, a personalized, Brain-Computer Doodle (BCD) board was developed using EEG and BCII technologies, showcasing its practical applications and potential impact. This work lays the foundation for innovative applications of brainwave data in interactive and immersive art installations. The study demonstrates the potential of utilizing brainwave signals for dynamic visual creation, highlighting the intersection of neuroscience and digital art. Future research could further optimize data processing algorithms and integrate additional brainwave metrics to enhance the precision and aesthetic quality of visual outputs.
REFERENCES
Allard A C. Machine Learning Based Characterization of preictal EEG[M]. Rochester Institute of Technology, 2022. Andrew Ng’s Machine Learning Collection, https://www.coursera.org/collections/
machine-learning, last accessed 2025/01/24. Chen Z, Qing J, Xiang T, et al. Seeing beyond the brain: Conditional diffusion model with sparse masked modeling for vision decoding[C]//Proceedings of the IEEE/CVF Conference on Computer Vision and Pattern Recognition. 2023: 22710–22720. David C. Krakauer: Unifying complexity science and machine learning, https://www.frontiersin.org/journals/complex-systems/articles/10.3389/ fcpxs.2023.1235202/full, last accessed 2025/01/15. Eagleman, David. The Brain. Pantheon, 2015. Fei-Fei L, Krishna R. Searching for computer vision north stars[J]. Daedalus, 2022,
151(2): 85–99. Fields R D. Electric Brain: How the New Science of Brainwaves Reads Minds, Tells Us How We Learn, and Helps Us Change for the Better[M]. BenBella Books, 2020. H. Berger, “Uber das Electrenkephalogramm des Menchen,” Arch Psychiat Nervenkr,
vol. 87, pp. 527–570, 1929. Hassanien A E, Azar A A. Brain-computer interfaces[J]. Switzerland: Springer, 2015,
74.
EEG-Driven Personalized Visual Communication 81
Hubel D H, Wiesel T N. Receptive fields, binocular interaction and functional architecture in the cat’s visual cortex[J]. The Journal of physiology, 1962, 160(1): 106. J. J. Vidal, “Real-time detection of brain events in EEG,” Proc. IEEE, vol. 65,
pp. 633–664, May 1977. Khalid, M. B., Rao, N. I., Rizwan-i-Haque, I., Munir, S., Tahir, F.: Towards a brain computer interface using wavelet transform with averaged and time segmented adapted wavelets. In: Proceedings of the 2nd International Conference on Computer, Control and Communication (IC4’09), Karachi, Sindh, Pakistan, 17–18 Feb 2009, pp. 1–4. Maiseli, B., Abdalla, A. T., Massawe, L. V. et al. Brain–computer interface: trend,
challenges, and threats. Brain Inf. 10, 20 (2023). N. Birbaumer et al., “The thought translation device (TTD) for completely paralyzed patients,” IEEE Trans. Rehab. Eng., vol. 8, pp. 190–193, June 2000. Repovas, G.: Dealing with noise in EEG recording and data analysis. Informatica
Medica Slovenica J. 15(1), 18–25 (2010). Semmlow, J.: Biosignal and Medical Image Processing, vol. 1. CRC press, Boca Raton (2011). Smith, R. C.: Electroencephalograph based brain computer interfaces. M. Sc. thesis,
University College Dublin, Duplin, Ireland (2004). Tan, D., Nijholt A.: Brain-Computer Interaction: Applying Our Minds to Human- Computer Interaction. Springer, London (2010). The Nobel Prize in Physiology or Medicine 1981, https://www.nobelprize.org/prizes/
medicine/1981/summary/, last accessed 2025/01/24. Tirupattur, P., Rawat, Y. S., Spampinato, C., & Shah, M. (2018). ThoughtViz: Visualizing Human Thoughts Using Generative Adversarial Network. Proceedings of the 26th ACM international conference on Multimedia. Triana A M, Salmi J, Hayward N M E A, et al. Longitudinal single-subject
neuroimaging study reveals effects of daily environmental, physiological, and lifestyle factors on functional brain connectivity[J]. PLoS Biology, 2024, 22(10): e3002797. U.S. Government Accountability Office, Brain-Computer Interfaces: Applications, Challenges, and Policy Options, https://www.gao.gov/products/gao-25-106952, last accessed 2025/01/26.
Read this individual research paper free through the original publisher, or explore the full digital proceedings book.
ISBN 978-1-964867-71-7
Explore this ISBN in the AHFE Bookstore ↗Listed in the July 2026 bookstore catalogue; search by ISBN to confirm current availability · Digital book purchase optional