Lie Wang, Yiwen Chen, Lingyue Li (2025). Urban Spatial Monitoring on Innovative Activities: The Case of G60 Innovative Corridor. In: Human Factors in Architecture, Sustainable Urban Planning and Infrastructure. AHFE Open Access, vol. 191, pp. 75–83. https://doi.org/10.54941/ahfe1006611
This study explores the application of urban spatial monitoring data in the implementation and evaluation of urban planning, with a particular focus on the spatial distribution and dynamic evolution of innovative activities within urban territories. Using the G60 Innovation Corridor in the Yangtze River Delta as a case study, this study analyzes invention patent data from nine cities from 2010 to 2021, combined with the International Patent Classification (IPC) system and geographic information technology. The findings reveal that: (1) The number of invention patents in the G60 Innovation Corridor exhibited a three-stage trend of "slow growth - rapid growth - fluctuating decline" from 2010 to 2020, with Suzhou, Hangzhou, and Hefei emerging as core innovation hubs; (2) Innovative technologies are predominantly concentrated in Class B (performing operations; transporting) and Class G (physics), with significant growth in sub-fields such as G06 (computing technology), reflecting the rapid development of the digital economy; (3) Spatially, a multi-polar distribution pattern has formed around Hangzhou, Suzhou, and Hefei, with cross-regional patent cooperation primarily in physics and electronic technology, accounting for over 50% of collaborations. The results provide a scientific basis for optimizing territorial space planning, guiding the agglomeration of innovative resources, and promoting regional coordinated development.
Urban spatial monitoring (USM) plays a critical role in China’s natural resources investigation and monitoring system, providing robust support for the construction of the China Spatial Planning Observation Network (CSPON). However, current research primarily focuses on the monitoring process itself, with limited attention given to its application in assessing and evaluating the implementation of planning, particularly in the monitoring of innovative activities. Monitoring innovative activities in urban territorial space, especially in technology - intensive areas like the G60 Innovation Corridor, is essential for understanding the spatial dynamics of innovation. By utilizing spatial distribution data generated through spatial data monitoring technologies, we can identify areas of concentrated innovative
activity, track emerging trends, and predict future growth hubs. This monitoring approach aligns closely with regional development goals and fosters the collaboration of scientific resources, as well as the rapid integration of transportation corridors.
In recent years, “Science and Technology Innovation Corridors” have gradually become a hot spot for planning and construction in countries around the world. It represents a type of spatial organization of regional collaborative innovation and relies on regional transportation corridors for rapid spatial aggregation of innovative resources and elements, thus promotes technological innovation. Since the 1980s, as the science and technology innovation industry clusters such as Highway 101 and Highway 128 in the United States have gradually become the most important and active innovation areas in the world, governments of various countries have also attempted to replicate the successful experience of Silicon Valley and Boston and have begun to promote the construction of “Science and Technology Innovation Corridors”. In 1996, the Malaysian government proposed to plan and build a “Multimedia Super Corridor” to promote the development of information technology and multimedia industries. In 2007, the Queensland government of Australia proposed to build the Gold Coast Pacific Innovation Corridor, aiming to transform the Gold Coast city into a “knowledge corridor” that connects the global “hotspots” of innovation, human capital and technology. In 2016, the governments of Vancouver, Canada, Seattle and Portland, the United States, proposed to jointly build the “Cascadia Innovation Corridor” to achieve cross-border innovative economic cooperation.
Compared with the innovation models of Silicon Valley and Route 128, the construction, formation and development of “Science and Technology Innovation Corridors” in China rely more on policy support. The G60 Science and Technology Innovation Corridor in the Yangtze River Delta has been promoted and developed under the guidance of a series of policies since 2016. As one of the earliest regional innovative corridors in China, it is necessary to closely examine how innovative technologies evolve and perform under this policy initiative, especially considering the role of urban spatial monitoring in understanding the innovation dynamics within such corridors.
RESEARCH METHOD Study Area
At the national and regional levels, in May 2019, the Outline of the Regional Integrated Development Plan for the Yangtze River Delta clearly stated that “relying on major transportation corridors, we will continue to promote the construction of the G60 Science and Technology Innovation Corridor, and create a pilot corridor driven by the dual wheels of scientific and technological and institutional innovation, and the integrated development of industry and cities”. In November 2020, six central ministries and commissions jointly issued the “Construction Plan for the G60 Science and Technology Innovation Corridor in the Yangtze River Delta”, proposing to build G60 into a science and technology innovation corridor with
Urban Spatial Monitoring on Innovative Activities: The Case of G60 Innovative Corridor 77
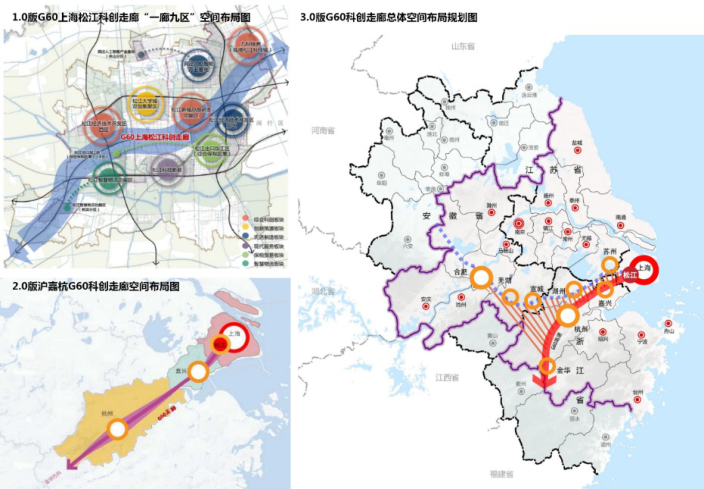
international influence and an important source of innovation in my country by 2025. In March 2021, accelerating the construction of the G60 Science and Technology Innovation Corridor in the Yangtze River Delta was officially included in the country’s “14th Five-Year Plan”. At local, the G60 Science and Technology Innovation Corridor has undergone a continuous development and evolution process, and governments at all levels have continued to deepen their efforts in promoting collaborative innovation (Figure 1). As an important carrier for the innovative development of the Yangtze River Delta region in China, monitoring the innovative activities of the G60 Science and Technology Innovation Corridor is of great significance for understanding the regional innovation situation, optimizing the territorial spatial planning, and promoting the rational allocation of innovative resources.
Figure 1: Spatial plan of the 1.0, 2.0 and 3.0 versions of G60 innovative corridors in Yangtze River Delta, China.
Data Sources and Construction of Monitoring Indicators There is no consensus on the measurement of innovation output, but given the advantages of easy access, high reliability, and the potential to visualize, patent data as proxy for innovation are widely used (Acs & Audretsch, 1989). Existing studies indicate that patent data significantly correlate with innovation output. Feldman and Florida (1994) found that the correlation coefficient between patents and innovation activities was 0.9344 based on the innovation citation census data of trade journals and business publications conducted by the U.S. Small Business Administration (SBA) in 1982 (Feldman & Florida, 1994). Acs et al. (2002) also pointed
out that patent data is a reliable measure of innovation activities (Acs, Anselin, & Varga, 2002). One thing needs to be highlighted before applying patent data in this research is that, compared with utility patents and design patents, invention patents are more independent and innovative thus are the actual indicators for measuring the level of regional innovation output more appropriately. Specifically, the data come from the patent search and analysis system of the Shanghai Intellectual Property Information Service Platform (https://www.shanghaiip.cn/search/#/form- search). Information obtained include patent name, application date, application type, applicants, application address and IPC classification number, etc. The International Patent Classification (IPC) is the most commonly used classification standard worldwide, which include 8 sections and 128 classes (Table 1). Based on the characteristics of USM, this study constructs an index system encompassing the general trend of the number of patent applications, the characteristics of innovative technology class, and the status of cooperative innovative technologies. This system comprehensively reflects the innovative activities in the G60 Science and Technology Innovation Corridor. Meanwhile, by leveraging GIS technology, the patent data is correlated with the elements of urban territorial space, enabling a spatial visual analysis of innovative activities.
Urban Spatial Monitoring on Innovative Activities: The Case of G60 Innovative Corridor 79
RESULT
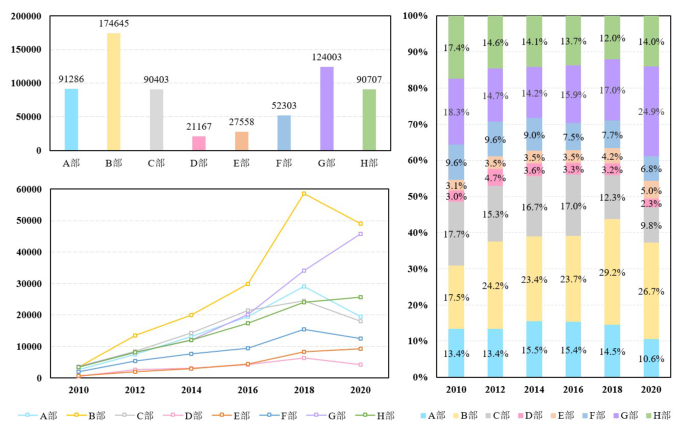
General Trend A total of 1,360,857 valid patent data were obtained by searching invention patents in the nine cities with patent application dates from 2010 to 2021. From 2010 to 2018, the number of invention patent applications increased rapidly from 20,053 to 200,529, with an average annual growth rate of 33.35%. From 2018 to 2021, there was a fluctuating downward trend, and the number of invention patent applications dropped to 160,559. Specifically, the overall development of the innovative technologies since 2010 can be roughly divided into three stages: (1) slow growth stage (2010–2015) - the number of invention patent applications showed a slow growth trend except Suzhou; (2) rapid growth stage (2015–2018) – all the cities grew rapidly except Suzhou, Jinhua’s invention patent applications increased by 4.1 times, Jiaxing, Huzhou, Hefei, Wuhu, and Hangzhou increased by 3.5, 2.8, 2.4, 2.4, and 2.3 times respectively; (3) fluctuating decline stage (2018–2021) – patents decreased significantly due to COVID-19 pandemic, Wuhu had the most obvious decline, from 28,075 in 2018 to 7,755 in 2019.
Suzhou has the largest share of invention patent applications among the prefecture-level cities, accounting for 32.6% of the total. With an average annual growth rate of 74.79%, Suzhou also outpaced other cities especially from 2010 to 2013. Hangzhou is the only one that has maintained growth for 12 years. The number of invention patent applications grew slowly from 2010 to 2015, with an average annual growth rate of 19.07%. The growth rate accelerated from 2015 to 2020, with an average annual growth rate of 27.93%. In 2019, Hangzhou’s invention patent applications accounted for 29.52%, surpassing Suzhou (29.47%) for the first time to rank first among the nine cities, and gradually rose to 35.23% in 2021. The number of invention patent applications in Hefei accounted for 15.64% of the total, with an average annual growth rate of 44.79%. The remaining six cities showed an upward trend from 2010 to 2018, among which Xuancheng City had increased the most from 2011 to 2012, reaching 4.44 times. Except Songjiang District, the remaining five cities (districts) showed a fluctuating downward trend from 2018 to 2021, among which Wuhu City declined most.
Innovative Technology Class Section B (Operation; Transportation) and G (Physics) account for the largest proportion of invention patent applications, accounting for 25.99% and 18.45% of the total respectively. Section D (textile; paper) and E (fixed constructions) account for the least proportion, accounting for 3.15% and 4.10% of the total respectively. In 2010, section G, C, B and H accounted 18.3%, 17.7%, 17.5% and 17.4% respectively. Since 2012, however, section B and G have shown a fluctuating upward trend, and the former ranked very top thereafter. From 2018 to 2020, the growth rate of section G exceeded that of section B, and the proportions of section H (Electricity), F (Mechanical Engineering; Lighting; Heating; Weapons; Explosives) and C (Chemistry; Metallurgy) were gradually declining.
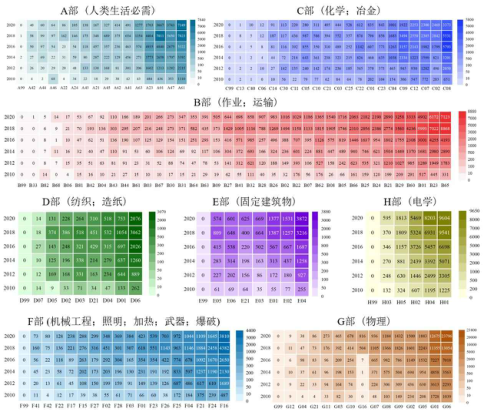
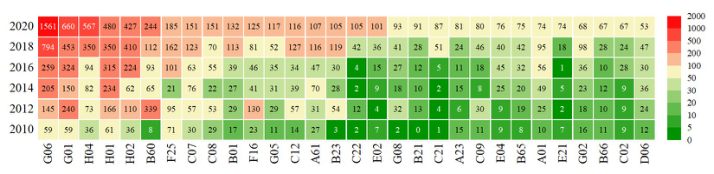
According to Table 2, G01 (measurement), H01 (basic electrical components), H04 (electrical communication technology), A61 (medicine or veterinary medicine; hygiene) and G06 (computation; estimation or counting) ranked top 10 during 2010 and 2020. Of all the classes, G01 always ranked top 1–2, accounting for more than 5.6%, H01 always ranked top 3, accounting for more than 4.7%, and G06 developed most rapidly, rising from the 5th place to the 1st place, with its proportion fluctuated from 5.18% to 12.93%. This indirectly suggests the rapid development of the data computing and processing industry in the G60 Science and Technology Innovation Corridor in the Yangtze River Delta in recent years.
The evolution of the eight patent sections indicates that A61 (medicine or veterinary medicine; hygiene), B23 (machine tools, etc.) and B65 (transportation, etc.), C08 (organic polymer compounds, etc.), D06 (fabric processing, etc.), E04 (buildings), F16 (engineering components or parts), G06 (calculation; calculation or counting) and G01 (measurement; testing), H01 (basic electrical components) and H04 (basic electrical components) are all developing rapidly. However, the development of B33 (additive manufacturing technology) and C13 (sugar industry) fell behind.
Figure 2: Changes in the number of invention patent applications by IPC sections in G60 innovative corridors in Yangtze River Delta, China.Table 2: Changes of top 10 patent classes.
Table available in the original PDF paper.
Year 2010 2012 2014 No. Class Numbers Ratios Class Numbers Ratios Class Numbers Ratios
Figure 3: Changes in the number of invention patent applications by IPC classes (2010–2020).
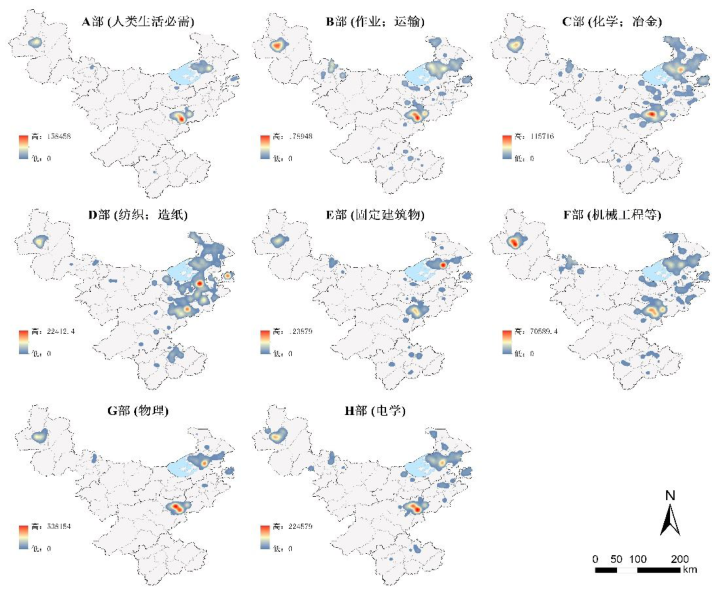
Kernel density analysis indicates that section A (necessities for human life), C (chemistry; metallurgy), G (physics) and H (electricity) distributed around Hangzhou - the “polar core” and Suzhou/Hefei – the “sub-cores”. Section B is characterized by a “dual core” structure by Hangzhou and Hefei.
Section D forms a continuous area along Songjiang-Suzhou-Jiaxing-Huzhou- Hangzhou, with the junction of Jiaxing-Suzhou as the core and Songjiang and Hangzhou as the sub-cores. Section E (fixed constructions) distributed around Suzhou - the “core” and Hangzhou - the “sub-core”. The spatial distribution pattern of Section F (Mechanical Engineering, etc.) takes Hefei as the “core” and Hangzhou as the “sub-core”.
Figure 4: Spatial structure for IPC classes (2020).Figure 5: Number of cooperative patents in some classes (2010–2020).
Urban Spatial Monitoring on Innovative Activities: The Case of G60 Innovative Corridor 83
Cooperative Innovative Technologies This research identifies around 19 thousand cooperative patents, in which 10 thousand are cross-district (county) cooperative patents. Computing, measurement, communications, and electrical are the main areas of patent cooperation. Section G (Physics) and H (Electricity) have the most patent cooperations, accounting for 31.83% and 21.72% of the total patent cooperations. The number of cooperative patents in G06 (calculation; calculation or counting), G01 (measurement; test), H04 (telecommunications technology), H04 (basic electrical components), and H02 (power generation, transformation or distribution) are significantly higher than other classes.
CONCLUSION
Over the past 12 years, the G60 Innovation Corridor has experienced rapid growth in invention patent applications, particularly in the fields of electronic information and biomedicine, which are key leading industries in the region. This study employs urban spatial monitoring (USM) to analyze the spatial distribution and trends of these innovations. The findings indicate that patent collaborations in Class G (Physics) and Class H (Electricity) are particularly dominant, reflecting the region’s technological strengths in these domains. The findings underscore the importance of optimizing infrastructure and public services in innovation hubs to attract more innovative resources. Additionally, the spatial distribution of innovative technologies suggests the need for targeted industrial clustering based on technological strengths, fostering regional collaboration to enhance innovation synergy. The insights from this study can inform urban spatial planning and resource allocation, ultimately supporting the sustainable development of the G60 Innovation Corridor and similar regions.
ACKNOWLEDGMENT
The authors would like to acknowledge the National Key R&D Program of China (No. 2023YFC3804001) for funding this research.
REFERENCES
Acs, Z. J., Anselin, L., & Varga, A. (2002). Patents and innovation counts as measures of regional production of new knowledge. Research Policy, 31(7), 1069–1085. doi: https://doi.org/10.1016/S0048-7333(01)00184-6. Acs, Z. J., & Audretsch, D. B. (1989). Patents as a Measure of Innovative Activity. Kyklos, 42(2), 171–180. doi: https://doi.org/10.1111/ j.1467–6435.1989.tb00186.x. Feldman, M. P., & Florida, R. (1994). The geographic sources of innovation:
technological infrastructure and product innovation in the United States. Annals of the Association of American Geographers, 84(2), 210–229. doi: https:// www.jstor.org/stable/2563394.
LISTED IN THE AHFE DIGITAL BOOKSTORE CATALOGUE
Explore the complete digital volume
Human Factors in Architecture, Sustainable Urban Planning and Infrastructure
Read this individual research paper free through the original publisher, or explore the full digital proceedings book.
ISBN 978-1-964867-67-0
Explore this ISBN in the AHFE Bookstore ↗Listed in the July 2026 bookstore catalogue; search by ISBN to confirm current availability · Digital book purchase optional