Kosei Koizumi, Chikori Ino, Yusaku Okada (2025). A System for Evaluating the Status of Future Human Error Prevention Activities in Manufacturing Sites Based on Information Noticed During Daily Work. In: Safety Management and Human Factors. AHFE Open Access, vol. 189, pp. 24–32. https://doi.org/10.54941/ahfe1006567
In factories such as aircraft manufacturing, where the number of products manufactured is so small that the defective product rate must be reduced to zero, a great many human error countermeasures are taken. However, the burden on workers due to too many countermeasures has exceeded the limit, and there is an urgent need to optimize the management of error countermeasures as a whole. To that end,(1) Collection of detailed human factor information on problematic events such as nonconformance events(2) Collection of human factor information during normal operations(3) Structural analysis of human factors(4) Propose guidelines for human error countermeasures based on the analysis results and present multiple specific measures(4) Propose guidelines for human error countermeasures based on the results of the analysis and present multiple specific countermeasures.In this study, with regard to (2), we attempted to examine a method for collecting human factor information from on-site conversations, based on the activation of constructive communication at the work site. We called “hints that lead to constructive communication” “positive words,” and designed a system to evaluate this information from multiple perspectives. In the collection phase, the system uses Google Form, which allows workers to input information at any time from their own information terminals, and simple summaries are fed back to the site as a preliminary report the next morning.In the evaluation phase,Phase I: Establishment of a safety management systemPhase 2: Strategic safety management: Leadership, followership, and information gathering/sharing system in the field.Third step: Reputation management: educational curriculum for the next generation, development of generalist staff with diverse knowledge.Fourth step: Strategic management: Future production including social contribution, regional contribution, investment in the future, and fostering future value.We have developed a system that can present the satisfaction level of on-site communication regarding the four levels of communication, as well as advice on communication content that should be activated in the future. We have developed a generative AI that has been specially trained using past literature data on safety management, reputation management, and brand management, and this generative AI can provide “advice on communication content” in response to on-site data. The prototype application was tested at an actual factory. The prototype application is now being tested at an actual factory, and improvements are being made in order to deploy it in activities aimed at preventing nonconformance events.
Minimizing human error is essential in heavy manufacturing due to strict quality control requirements. To address this, the following steps are important:
1. Extract information on human factors to induce defective products. 2. Survey factors causing defective products latent in usual work. 3. Analyze multidimensional structure of the extracted factors. 4. Propose the advice-message on human error reduction to site management departments (via consultation).
This study focuses on the second aspect by developing a method to extract human factor information from workplace conversations. Positive words serve as indicators of productive communication, and a system was designed to evaluate this information effectively.
Current Research on Near-Miss Incident Factor Analysis At present, numerous studies are being conducted on near-miss incident factor analysis using AI, with each research effort focusing on specific industries and fields.
A System for Evaluating the Status of Future Human Error Prevention 25
For example, in the medical field, research such as AI-driven analysis of incident reports to identify patterns in medical errors and improve patient safety (e.g., natural language processing (NLP) models analyzing electronic health records) has been progressing.
In the construction industry, studies like AI-based risk assessment systems that predict potential safety hazards on construction sites by analyzing past accident reports and sensor data have been actively developed.
In the aviation industry, multi-layered approaches are being explored, including AI-based crew resource management (CRM) analysis, automatic detection of pilot errors from cockpit voice recordings, and predictive maintenance systems that analyze aircraft performance data to prevent mechanical failures. These studies aim to enhance flight safety by identifying human and technical factors contributing to near-miss incidents.
If AI can accurately extract the key factors that influence the identification of useful information for preventing nonconformities in manufacturing, it will be possible to respond effectively to the requests that form the basis of this study.
Human Error Factor Extraction Based on the m-SHELL Model Existing classification methods, such as those based on the m-SHELL model, have been developed to systematically categorize human error factors [JAXA]. The m-SHELL model consists of six elements: Management, Software, Hardware, Environment, Liveware (individual), and Liveware (others). Previous studies have introduced classification tools that categorize factors contributing to human errors [Murahashi]. Using these frameworks, error-prone behaviors and conditions can be identified and analyzed.
Event Classification Using the SRK Model For categorizing human errors, the SRK (Skill-Rule-Knowledge) model proposed by Rasmussen is employed. This model classifies cognitive processes into three levels: skill-based, rule-based, and knowledge-based behaviors. Based on these levels, human errors can be further categorized into fourteen distinct types.
Table 1: Category of human error and characteristics of human error.
Table available in the original PDF paper.
Category of Human Error Characteristics of Human Error Overlooking Weak Stimuli Errors occur because weak stimuli in vision, hearing, or touch are either unnoticed or nearly non-existent, preventing detection or observation of objects or events. Signal Bias Misinterpretation of signals (clues or scenes)
that serve as cues for correcting or redoing a task, leading to hasty actions. Frequency Bias Instead of matching characteristics as required in a task, a person assimilates them to familiar actions.
Continued
Table 1: Continued Category of Human Error Characteristics of Human Error
Table available in the original PDF paper.
Incomplete Formation of
Errors arise because the subjective judgment
Judgment Criteria
criteria needed for distinguishing features in a task have not been fully established by the worker. Impulsive Unsafe Behaviour Acting on impulse, prioritizing immediate visible benefits over latent risks, leading to undesirable consequences. Incomplete Formation of
Errors due to an insufficiently developed
Repertoire
repertoire of necessary actions for the task. Incomplete Feature Matching of
Inability to recognize subtle differences in
Finished Work
shape, resistance, or movement at the completion of a task, leading to imperfect work. Similarity Bias Errors caused by confusing similar procedural actions. Task Disorder Errors due to mistakes in planning and
materializing tasks, misrecognition of task initiation conditions, or overconfidence. Procedure Disorder Overconfidence leads to neglecting key considerations in task execution, resulting in formalized or reversed procedures. Procedure Sampling Errors due to misrecognition, confusion, or
forgetting steps while following a procedure, often caused by overconfidence Habitual Unsafe Behaviour Unsafe behaviours that persist despite potential risks. Failure to Address Tasks Forgetting to perform necessary actions. Accidental Movement Disruptions Unintended actions occur when the body or
tools interfere with equipment unintentionally during task execution or movement.
METHODOLOGY
Data Collection Two primary data sources were used:
Incident-Related Information Sheet(I-RIS): A newly designed sheet for analysing the factors of defect occurrences in the manufacturing industry, specifically aimed at extracting the underlying causes of human error, which is submitted using Google Forms.
I-TAG (Incident Tagging): A structured system for recording the causes of non-conformance events.
A System for Evaluating the Status of Future Human Error Prevention 27
Table 2: Input item for I-RIS.
Table available in the original PDF paper.
Input Item Worker Information (Name, Email Adress) Date of Awareness Workgroup Type of Awareness(Individual, Team Company) Category (Education, Safety, Quality) Positive Words Satisfaction Level (Rating from 1 to 5)
Table 3: Input item for I-TAG.
Table available in the original PDF paper.
Input Item Name Supervisor Date Workgroup Job Experience Cause & Details Corrective Action
From July to December 2024, we analyzed 1,000 I-RIS and 134 I-TAG records using m-SHELL and SRK models. These datasets were classified using the m-SHELL model for error factor identification and the SRK model for event classification.
The purpose was to develop a system that measures the quality and quantity of information collected through these methods and provides recommendations for future data collection.
RESULTS AND DISCUSSION
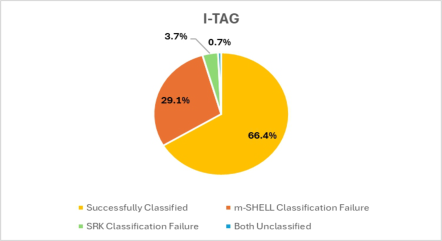
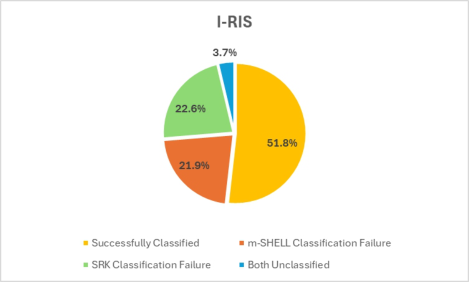
Classification Failure Rate A classification failure rate was calculated to determine the proportion of records that could not be categorized using either the m-SHELL or SRK models.
Figure 1: Classification failure rate for I-TAG.Figure 2: Classification failure rate for I-RIS.
It was observed that I-RIS entries had a higher unclassified rate, indicating a need for improved categorization techniques.
Considerations on Classification Failure Rate
Figure 4 and Figure 5 present the results related to unclassified data. The findings indicate that the event classification failure rate is higher for I-TAG, while the factor classification failure rate and the combined classification failure rate (both factor and event) are higher for I-RIS. The purpose of this analysis is to assess changes in workplace awareness by examining the extracted classification results. Consequently, if a record is unclassified, it means that it has not yet reached the stage where meaningful insights can be derived.
Based solely on the unclassified rate, it can be inferred that the contents of I-RIS should evolve so that a greater proportion of entries can be successfully classified. However, I-RIS is designed to collect a broad range of daily operational observations, making it inherently less likely to be categorized into specific factors or events compared to I-TAG. Ultimately, improving the classification of these broad observations into relevant factors or events is a key aspect of enhancing workplace awareness. Therefore, it is essential that I-RIS entries progressively become more classifiable over time.
Classification Results Next, we will describe the specific results of the classified cases. Previously, we compared the two methods based on the number of classified and non- classified cases. However, since I-TAG and I-RIS target different types of data for collection, it is somewhat natural that there would be differences in the number of classified and non-classified cases. In this section, we will examine the specific results to analyse the m-SHELL classification and SRK classification.
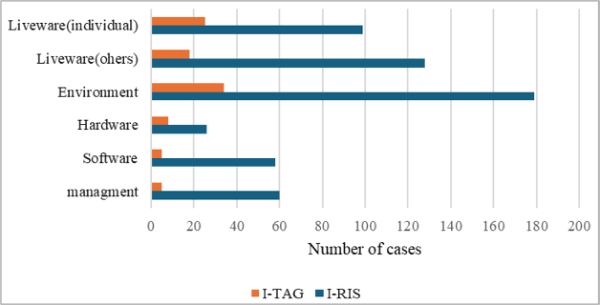
Results and Analysis of m-SHELL Classification The classification results based on the m-SHELL model are presented in the table below, followed by an analysis using these results. Here, the data
A System for Evaluating the Status of Future Human Error Prevention 29
is shown as raw case numbers rather than percentages. Therefore, it is important to consider that there is nearly tenfold difference in the number of cases between I-RIS and I-TAG.
Figure 3: m-SHELL classification results.
Looking at the figure, the top three categories are the same for both I-RIS and I-TAG: “Environment,” “Liveware (individual),” and “Liveware (others).” From the perspective of proactive prevention—preventing accidents before they occur rather than implementing countermeasures after an accident has happened, these three categories contribute to awareness. However, the fact that “Environment” is the most frequent category in both datasets suggests that the level of awareness is not necessarily high. This is because, within the m-SHELL model, “Environment” is relatively easy to notice.
A high level of awareness would be indicated by a balanced distribution of classifications across “Management,” “Software,” “Hardware,” “Environment,” “Liveware (individual),” and “Liveware (others).” Examining the I-RIS results, “Management” appears as the next most frequent category after the top three, which is a positive trend. However, as previously mentioned, the overwhelming focus on “Environment” and the lack of balance among other categories suggest that awareness is still not at a high level.
Compared to I-TAG, where “Management” is scarce and the distribution across other categories is even more unbalanced, I-RIS demonstrates a better trend. The broader range of awareness recorded in I-RIS suggests that it may be easier to analyze changes in awareness over time in the future.
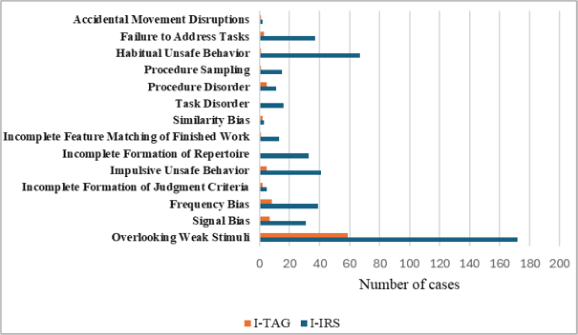
Results and Analysis of SRK Classification Next, we present the classification results based on the SRK model in the table below and analyze them accordingly. As with the m-SHELL classification, the results are shown as raw case numbers rather than percentages.
Figure 4: Frequency of occurrence of extracted factors based on SRK classification.
Looking at Figure 7 above, the types of errors that are more likely to be classified show similar trends in both I-TAG and I-RIS. However, focusing on the differences, I-RIS has more cases classified under “Habitual Unsafe Behavior” and “Failure to Address Tasks” compared to I-TAG. Notably, the number of cases under “Habitual Unsafe Behavior” is significantly high.
“Habitual Unsafe Behavior” is defined as “unsafe behavior that persists despite potential risks.” From a proactive prevention perspective, a high number of such cases suggest a good level of awareness. However, the large number of cases classified under “Failure to Address Tasks” does not indicate a high level of awareness. This is because “Failure to Address Tasks” is more relevant from a reactive rather than proactive perspective.
Failure to Address Tasks: Forgetting to perform necessary actions.
This category represents awareness of errors after they have already occurred, rather than before, which means it is not directly related to proactive prevention. In other words, while errors are recognized after they happen, there is insufficient awareness of potential risks during routine work.
From this perspective, the frequency of cases classified under “Overlooking Weak Stimuli” is significant.
Overlooking Weak Stimuli: Errors occur because weak stimuli in vision, hearing, or touch are either unnoticed or nearly nonexistent, preventing detection or observation of objects or events.
A high frequency of cases in this category suggests a heightened awareness of potential hazards in routine tasks. Awareness of “Overlooking Weak Stimuli” involves recognizing subtle risks that are often overlooked in daily operations, making it an essential factor in proactive accident prevention.
Conclusion on the Current State of Awareness Capability Based on the Analysis This section presents the conclusion regarding the current state of awareness capability in heavy industry A.
A System for Evaluating the Status of Future Human Error Prevention 31
The first conclusion is: ⊚The collection process in I-RIS must be improved to achieve a higher success rate in m-SHELL and SRK classification.
Currently, approximately 20% of the data collected remains unclassified. This means that 20% of the data does not contribute to either proactive prevention or even reactive prevention. While it is commendable that I- RIS, which collects a broader range of observations, achieves a slightly higher classification rate than I-TAG, the fact that 20% remains unclassified indicates that a significant portion of the data fails to clear the first stage in this evaluation method for assessing awareness changes.
The presence of unclassified data itself suggests a low level of awareness capability. Therefore, the first step should be to ensure that 100% of I-RIS submissions can be classified. Only after achieving this can, we proceed to the second stage, which involves analyzing changes in awareness based on classification results.
The second conclusion, drawn from the content of successfully classified cases, is: ⊚The fact that classification results from I-RIS and I-TAG are largely similar indicates a low level of awareness capability.
This is because I-RIS and I-TAG collect fundamentally different types of data. I-RIS is designed to capture a wide range of daily observations, while I-TAG is used to collect cause-related information about nonconformities, meaning it primarily records incidents where errors have already occurred.
In other words, I-TAG is inherently designed for reactive prevention (preventing recurrence), whereas I-RIS is intended to facilitate proactive prevention (preventing incidents before they occur). However, the current results show that I-RIS is also primarily collecting information related to recurrence prevention, which is not ideal given the goal of preventing errors before they occur.
At present, the level of awareness capability is such that people can only recognize hazards after an error has occurred. The goal should be to raise awareness to the point where hazards can be identified in routine operations before an error happens.
Of course, as noted in the analysis, there were some indications that I- RIS was capturing awareness related to proactive prevention more effectively than I-TAG. However, the overall trend shows that the level of awareness derived from I-RIS is still largely like that from I-TAG, which highlights a key issue.
These two conclusions summarize the current state of awareness capability at heavy industry A, as revealed through this study.
As stated at the beginning, in manufacturing industries like aircraft production, where the number of manufactured units is small and the defect rate must be zero, proactive prevention is particularly critical compared to recurrence prevention. Therefore, improving workers’ awareness capability remains a key challenge.
CONCLUSION
This study developed a system to evaluate awareness capability through classification models. Over time, tracking changes in classification rates can support workplace feedback and guide improvements in proactive error prevention. The system offers a promising foundation for long-term workplace safety and quality management.
REFERENCES
Barach P, Small S. Reporting and Preventing Medical Mishaps: Lessons From Non-Medical Near Miss Reporting Systems. BMJ (Clinical Research Ed.). 2000;320(7237): 759–763. Chew TS. The Checklist Manifesto: How to Get Things Right. Clin Med (Lond).
2011;11(3): 296–297. Flin R, Patey R. Non-technical Skills for Anaesthetists: Developing and Applying ANTS. Best Pract Res Clin Anaesthesiol. 2011;25(2): 215–227. Gao X, Wang H, Zhang Y. Predictive Maintenance in Aviation: Using AI to Analyze
Aircraft Performance Data for Mechanical Failure Prevention. J Aerosp Eng. 2019;32(6):04019087. Japan Aerospace Exploration Agency. Human Factors Analysis Handbook. 2017. Komatsubara A. Human Error. Maruzen Publishing. 2003. Li H, Lu M, Hsu SC, Gray M. Predictive Safety Analysis in Construction Using Machine Learning: An Overview. J Constr Eng Manag. 2015;141(5):04015002. Murahashi M. Study on Human Error Triage Methods for Near-Miss Reports in
Industrial Plants: Development of Human Error Response Classification Support Method Based on Human Reliability. 2024. Okada Y. Introduction to Human Factors: Aiming for Harmony Between Humans and Machines. Keio University Press. 2005. Rasmussen J. Information Processing and Human-Machine Interaction: An Approach to Cognitive Engineering. Elsevier Science Publishing. 1986. Ravikumar M, Singh H, Patterson M. AI-driven Automatic Detection of Pilot
Errors Using Cockpit Voice Data. IEEE Trans Aerosp Electron Syst. 2020;56(3): 1456–1468. Reason J. Human Error: Models and Management. BMJ. 2000;320(7237): 768–770. Shimizu H, Sato Y. t-m-SHEL Model and Its Case Study. REAJ J. 2002;24(7): 653–663. Wang Z, Pang Y, Lin Y, Zhu X. Adaptable and Reliable Text Classification Using
Large Language Models. 2024. Xu X, Liu S, Lin L. AI-assisted Crew Resource Management: Analyzing Pilot Communication Patterns for Enhanced Flight Safety. Aerosp Sci Technol. 2022;127:107231. Yukimachi T. Human Factors in Preventing Human Error. Tekunosystem. 2004. Zhou C, Ding L, Yu Y. AI-based Risk Assessment for Construction Site Safety:
Integrating Past Accident Reports and Real-time Sensor Data. Autom Constr. 2021;127:103690.
LISTED IN THE AHFE DIGITAL BOOKSTORE CATALOGUE
Explore the complete digital volume
Safety Management and Human Factors
Read this individual research paper free through the original publisher, or explore the full digital proceedings book.
ISBN 978-1-964867-65-6
Explore this ISBN in the AHFE Bookstore ↗Listed in the July 2026 bookstore catalogue; search by ISBN to confirm current availability · Digital book purchase optional