Weiran Rong, Wenyu Wu, Xuan Sun (2025). The Evaluation of AR-HUD Visual Augmentation Method Based on Situation Awareness. In: Intelligent Human Systems Integration (IHSI 2025): Integrating People and Intelligent Systems. AHFE Open Access, vol. 160, pp. 494–502. https://doi.org/10.54941/ahfe1005854
Augmented Reality Head-Up Display (AR-HUD) enhances driving safety and experience by overlaying virtual information into the driver’s forward view. However, AR-HUD may lead to attention capture, causing the driver to focus excessively on the AR-HUD and neglect other critical environmental information. Therefore, it is crucial to study how to balance the driver’s attention allocation between AR-HUD information and environmental information to ensure effective situational awareness (SA). The study based on Situational Awareness Theory, evaluates the impact of different AR-HUD augmentation methods (boxes, arrows, and shadows) on drivers' SA through analyzing eye movement data and Situation Awareness Rating Technique (SART) data. The results show that the different augmentation methods significantly affect drivers' SA levels. The box-type augmentation method performs the best overall and effectively improves the driver's SA. The study provides a theoretical foundation and practical guidance for the optimization and application of AR-HUD design.
Augmented Reality Head-Up Display (AR-HUD) plays a significant role in enhancing driving safety and further optimizes the driving experience by providing real-time navigation and traffic information (Azuma et al., 2001). Drivers can access necessary information more directly, thereby reducing inconveniences caused by difficulties in obtaining information during driving (Zhou et al., 2024). AR-HUD can project directly critical information, such as navigation and warnings, into the driver’s field of view, reducing the need for glancing down at the dashboard and thereby mitigating the risk of traffic accidents caused by visual distractions (Cheng et al., 2021). Studies indicate that AR-HUD significantly improves drivers’ situational awareness (SA) and reaction time for road conditions. However, AR-HUD may lead drivers to overlook some information to increase the risk of accidents due to the characteristic of “attention capture”(Mackworth, 1965). AR-HUD may introduce new distraction issues, particularly impacting the driver’s visual attention. Research has shown that the overlap between
Research on the Evaluation of AR-HUD Visual Augmentation Method 495
HUD content and unexpected stimuli in the real world may increase the frequency of inattentional blindness (Oh et al., 2016). The study showed that the effects of AR graphic placement and the relative position of AR graphics to unpredictable stimuli on inattentional blindness by measuring its occurrence rate and reaction times. The findings reveal that unpredictable stimuli unexpectedly overlapping with AR graphics significantly increase the likelihood of neglecting unforeseen events and result in longer reaction times (Chen et al., 2023).
The concept of SA was first introduced by Endsley, defined as “the ability to perceive, comprehend, and predict environmental elements within a specific time and space” (Endsley, 1995). The theory has undergone multiple stages of development, with its applications evolving from initial use in the military to broader domains such as aviation, healthcare, and cybersecurity (Stanton et al., 2017). Research has shown that the impact of situation awareness on driving performance, revealing that drivers with higher situation awareness are better able to accurately assess the behavior of autonomous vehicles in unexpected driving scenarios, thereby increasing their trust and acceptance of autonomous systems (Avetisyan et al., 2022). The study demonstrates that prolonged warning delays (6 seconds) result in significantly lower situation awareness in drivers compared to shorter pre- alert warnings (3 seconds). This decline is primarily attributed to drivers’ overreliance on such systems, making them less capable of responding promptly to hazards during system failures (Tan et al., 2022).
In summary, existing research on AR-HUD lacks sufficient focus on whether the design of AR-HUD information influences driver distraction. Therefore, this study integrates SA to explore the design of AR-HUD, aiming to achieve appropriate visual attention allocation for drivers and ultimately improve driving safety.
METHODOLOGY
Participants 15 participants (9 male, 6 female), aged from 18 to 35 (M = 26.67, SD = 3.958) with more 3 years driving experience were participated in the study. All participants had normal visual abilities, with uncorrected or corrected vision above 0.6, and were in good mental health. Before the experiment, all participants were required to maintain a regular routine, ensuring sufficient sleep and rest.
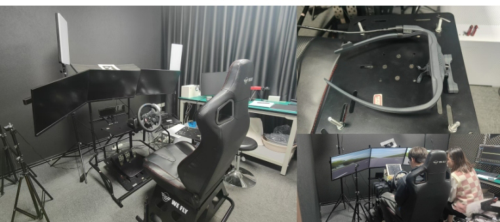
Experimental Equipment (1) Driving Simulator Hardware: The equipment includes a 4K-165Hz high-resolution display consisting of three screens manufactured by Samsung. Additionally, the system is equipped with an adjustable semi- bucket seat (XDracing), a steering wheel, and pedals (Logitech, G923 TRUEFORCE). The eye movement data of the driver was collected using the Dikablis Glasses 3, a glasses-style eye tracker.
(2) SCANeR Studio Driving Simulation Software: SCANeR Studio is a professional driving simulation software used to simulate road conditions, weather, time, and autonomous vehicle takeover scenarios. A desktop computer is placed to the right of the simulated driving seat, responsible for running the SCANeR Studio driving simulation program (see Figure 1).
Figure 1: Experimental equipment.
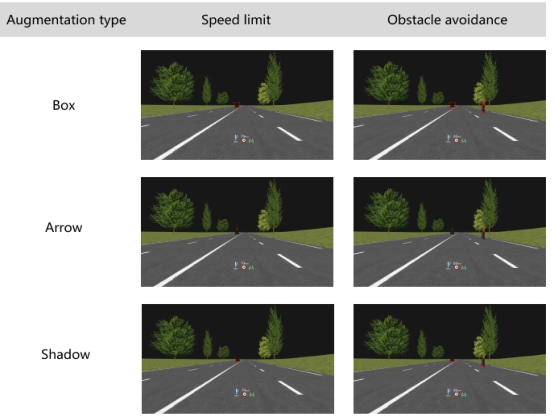
Experimental Materials (1) The simulated driving experimental environment was constructed using SCANeR Studio software, including two types of driving scenarios: speed limit and obstacle avoidance. Simulated driving videos were recorded and divided into 10-second segments for experimental presentation. The enhancement color was set to red (FF0000) with warning semantics, and the AR-HUD interface was designed using Adobe Illustrator, including three enhancement styles: box, arrow, and shadow (see Figure 2).
Figure 2: Enhancement styles.
Research on the Evaluation of AR-HUD Visual Augmentation Method 497
(2) SART Situation Awareness Rating Technique. Participants were required to complete the SART questionnaire after finishing the experiments to assess their SA under different scenarios. Subjective evaluations of the current scenario were conducted from three dimensions: demand, supply, and understanding (see Table 1). The questionnaire data were collected by the Wenjuanxing platform.
Table 1. SART scale.
Table available in the original PDF paper.
Phase Project Definition Rating Low to high 1∼7 Demand(D) Uncertainty Degree of unknown or ambiguous information in the current situation (1 = completely clear, 7 = very unclear)
Low to high 1∼7
Complexity Complexity of the situation or task (1 = very simple, 7 = extremely complex) Time Pressure Low to high 1∼7 Impact of time constraints on task completion (1 = no pressure, 7 = extremely urgent)
Low to high 1∼7
Supply(S) Information Quality
Accuracy, reliability, and relevance of the information obtained (1 = completely useless, 7 = very reliable) Information Quantity Low to high 1∼7 Sufficiency of the amount of information obtained (1 = completely insufficient, 7 = fully sufficient)
Low to high 1∼7
Familiarity with Information
Understanding and familiarity with the information (1 = completely unfamiliar, 7 = very familiar) Low to high 1∼7 Understanding(U) Clarity Clarity of understanding the current situation (1 = completely unclear, 7 = very clear)
Low to high 1∼7
Confidence Confidence in one’s decisions and judgments (1 = no confidence at all, 7 = very confident) Sense of Control Low to high 1∼7 Ability to control the situation and its changes (1 = no control at all, 7 = fully in control)
Low to high 1∼7
Adaptability Ability to adapt to changes in the situation (1 = completely unable to adapt, 7 = highly adaptable)
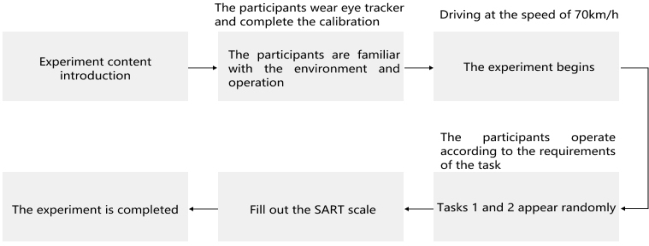
Experimental Process At first, participants were informed with the experimental procedure and content. After wearing the eye tracker and completing the calibration process, the experiment began with the random presentation of Task 1 or Task 2. The eye tracker recorded the participants’ the first fixation time in different areas. After completing the experiment, participants were required to fill out the SART questionnaire (see Figure 3).
Task 1: The vehicle initially drived at the speed of 70 km/h. Participants were required to adjust their speed promptly based on the speed limit
displayed on the AR-HUD. The eye tracker recorded the first fixation time on the speed limit indicator.
Task 2: Participants were required to avoid potential collisions with cyclists based on the enhanced information provided by the AR-HUD. The eye tracker recorded the first fixation time on the target stimulus.
Figure 3: Experimental process.
RESULTS
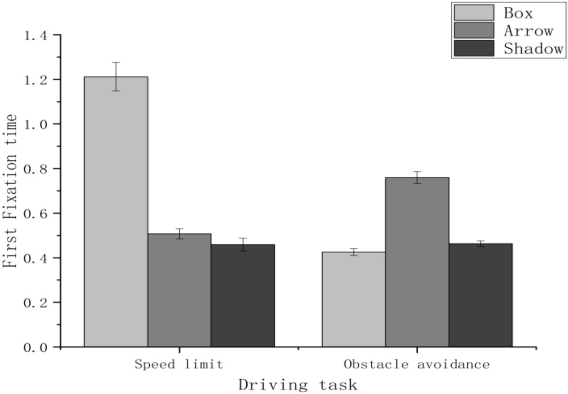
Eye Tracking Data Analysis Based on the descriptive statistics (see Table 2) and one-way ANOVA (see Table 3) of first fixation time for enhanced prompts in the two tasks, the analysis revealed the relationships between different enhancement methods and first fixation time under distinct driving tasks (see Figure 4). The results indicated the following:
In Task 1, the box and arrow, shadow enhancement methods had significant differences in first fixation time. The arrow and shadow methods had no significant difference. The box enhancement method had significantly longer first fixation time compared to the other two methods.
In Task 2, the arrow and box, shadow enhancement methods had significant difference in first fixation time. The box and shadow methods had no significant difference. The arrow enhancement method had significantly longer first fixation time than the other two methods.
Table 2. Descriptive statistical analysis of first fixation time.
Table available in the original PDF paper.
Task Enhancement Method
N Mean Standard Deviation
Standard Error
95% Confidence Interval of the Difference Lower Bound Upper Bound
Figure 4: The first fixation time under different tasks.
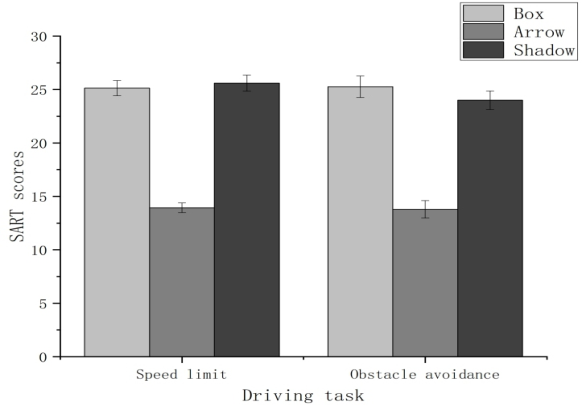
SART Scores Analysis Based on the descriptive statistics (see Table 4) and one-way ANOVA (see Table 5) of SART scores for enhanced prompts in the two tasks, the analysis revealed the relationships between different enhancement methods and driving tasks (see Figure 5). The results indicated the following.
In Task 1 and Task 2, the arrow and box, shadow enhancement methods had significant differences in SART scores. The box and shadow methods had no significant difference. The SART scores for the arrow enhancement method were significantly lower than the other two methods.
Table 4. Descriptive statistical analysis of SART scores.
Table available in the original PDF paper.
Task Enhancement Method
N Mean Standard Deviation
Standard Error
95% Confidence Interval of the Difference Lower Bound Upper Bound
Research on the Evaluation of AR-HUD Visual Augmentation Method 501
CONCLUSION
In summary, this study conducted a simulated driving experiment to compare and evaluate the effects of different AR-HUD enhancement methods on drivers’ SA in two common driving scenarios: speed limit and obstacle avoidance.
The analysis of SART scores demonstrated that the box and shadow AR- HUD enhancement methods had a positive impact on drivers’ SA. However, the analysis of first fixation time revealed that, in the speed limit task, the box enhancement method strongly attracted drivers’visual attention, reducing their ability to adapt to changes in speed limit indicators, which could negatively impact driving safety. In contrast, the shadow enhancement method allowed drivers to quickly notice both road stimuli and speed limit changes in both scenarios, facilitating a more balanced allocation of visual attention across different areas. Therefore, the shadow enhancement method is identified as the optimal design approach. The findings can provide valuable insights for designing AR-HUD enhancement methods in vehicles. It can highlight the importance of ensuring that drivers maintain a high level of SA and achieve balanced visual attention allocation across different areas, thereby improving driving safety and mitigating the negative effects of attention capture caused by AR-HUD.
REFERENCES
Avetisyan L, Ayoub J and Zhou F (2022) ‘Investigating explanations in conditional and highly automated driving: The effects of situation awareness and modality’, Transportation research. Part F, Traffic psychology and behaviour, 89:456–466, doi: 10.1016/j.trf.2022.07.010. Azuma R, Baillot Y, Behringer R, Feiner S, Julier S and MacIntyre B (2001) Recent
advances in augmented reality, IEEE, Los Alamitos, doi: 10.1109/38.963459. Chen W, Song J, Wang Y, Wu C, Ma S, Wang D, Yang Z and Li H (2023) ‘Inattentional blindness to unexpected hazard in augmented reality head- up display assisted driving: The impact of the relative position between stimulus and augmented graph’, Traffic injury prevention, 24(4):344–351, doi: 10.1080/15389588.2023.2186735. Cheng, D., Wang, Q., Liu, Y., Chen, H., Ni, D., Wang, X., Yao, C., Hou,
Q., Hou, W., & Luo, G. (2021). Design and manufacture AR head-mounted displays: A review and outlook. Light: Advanced Manufacturing, 2(3), 350–369. doi: 10.37188/lam.2021.024. Endsley MR (1995) ‘Toward a Theory of Situation Awareness in Dynamic Systems’, Human factors, 37(1):32–64, doi: 10.1518/001872095779049543. Mackworth N H. Visual noise causestunnel vision[J]. Psychonomic science, 1965,
3(1-12): 67–68. Oh HJ, Ko SM and Ji YG (2016) ‘Effects of Superimposition of a Head- Up Display on Driving Performance and Glance Behavior in the Elderly’, International journal of human-computer interaction, 32(2):143–154, doi: 10.1080/10447318.2015.1104155. Stanton, N. A., Salmon, P. M., Walker, G. H., & Jenkins, D. P. (2017). Human
Factors Methods: A Practical Guide for Engineering and Design. CRC Press. doi: 10.1201/9781315587246.
Tan X, Zhang Y and Wang J (2022) ‘Assessing the potential impacts of connected vehicle systems on Driver’s situation awareness and driving performance’, Transportation research. Part F, Traffic psychology and behaviour, 84:177–193, doi: 10.1016/j.trf.2021.11.016. Zhou C, Qiao W, Hua J and Chen L (2024) ‘Automotive Augmented Reality Head-Up
Intelligent Human Systems Integration (IHSI 2025): Integrating People and Intelligent Systems
Read this individual research paper free through the original publisher, or explore the full digital proceedings book.
ISBN 978-1-964867-36-6
Explore this ISBN in the AHFE Bookstore ↗Listed in the July 2026 bookstore catalogue; search by ISBN to confirm current availability · Digital book purchase optional