Xiangyang Zhang, Wenyu Wu, Ziwei He, Yingjing Li (2022). Evaluation of Indicative Symbol Coding for Fighter Cockpit HUD Based on Different Environmental Background. In: Human Interaction & Emerging Technologies (IHIET-AI 2022): Artificial Intelligence & Future Applications. AHFE Open Access, vol. 23. https://doi.org/10.54941/ahfe100904
Head-up display (HUD) is an important medium for fighter pilots to obtain the flight status and flight parameters of aircraft. In this paper, the cognitive human-computer interaction process of pilots when using HUD to search information is analyzed, two groups of reaction time measurement experiments are carried out, and the statistical analysis method is used to study the pilot's cognitive speed of HUD interface. The results show that the application of box arrow is better for the application of HUD interface under different environmental conditions, and the accuracy is high, but the integrity is slightly lower than that of open arrow and closed arrow. This paper provides theoretical support for the improvement of fighter HUD display interface.
Head-up display (HUD) based on augmented reality technology solves the internal and external visual contradiction of pilots frequently observing cockpit instruments
and flight tracks alternately during flight operation (Xu, 1996).
At present, there have been a lot of researches on HUD interface design at home and abroad. Xu Xiao studied the visual coding of the cockpit interface display design (Xu,
2014). Blundell studied the color-coding of HUD flight symbols in the real flight environment (Blundell, 2020). Innes believes that the symbols in the interface interact
with the environment to adjust the flight workload (Innes, 2019). Stanton considered that the display symbol is beneficial to the pilot's operation (Stanton, 2019).
Under different background conditions, through the design of different indicator symbols, taking the flight altitude and speed of fighter HUD as indicators, this study
explores its impact on the driver's information reading efficiency.
The visual coding of the cockpit HUD display interface has less research on symbols.
Therefore, the following hypotheses are proposed:
1) Different indicative symbols will affect the pilot’s reaction time and operational efficiency;
2) Different flight backgrounds will affect the pilot's reaction time and operational efficiency.
Experimental Preparation According to the national standard <GJB 300-1987 aircraft head up display
characters>, combined with relevant research, three indicator symbols are selected: open arrow, closed arrow and box arrow (see Figure 2.1 a. b. c. ). The experiment
selects speed, altitude information and different values as the readable information of the HUD interface, and uses black as the background for material design to get 9 sets
of pictures.
Experiment selects three different backgrounds in the flight state (see Figure 2.2 a. b.
c. ), which are the day sky, the evening sunset, and the day ground. Then using different background conditions and three indicative symbols as variables for material
design, 9 sets of pictures were obtained.
(a) (b) (c)
Figure 2. 1 Three indicative symbol representations
Figure available in the original PDF paper.
(a) (b) (c)
Figure 2. 2 Three background condition pictures The experiment is divided into pre-experiment and formal experiment. The preexperiment takes the black blank control group as the background, changes the data information in the interface information, and uses 3*3 (indicative symbol*data information group) repeated measurement design to collect reaction time and
Figure available in the original PDF paper.
accuracy data. The formal experiment uses the same data information, using 3*3
(indicative symbol* background conditions) repeated measurement was carried out to collect reaction time and accuracy data.
Experimental Equipment 1 set of reaction time measuring device (APTECH BD-Ⅱ-501A).
Experimental Staff Young people without HUD use experience, aged 23-27, a total of 23 males; with
visual acuity or corrected visual acuity of 1.0 or above, without color blindness, and are all right-handed.
Experimental Steps
1) Preparation Before Experiment Before the experiment, the purpose and process of the experiment were explained and
the picture structure instruction was shown to ensure that the subjects understood the meaning of the information presented in the experiment, and the experiment content
and the operation. Subjects were required to sign the experiment informed instruction.
2) Preliminary Experiment The subjects were asked to look at nine pairs of pictures in turn and press the confirm
button while speaking the requested information in the center of the screen, the next picture requires the height or speed information reported by the subject. The
information appears 4s, and then enters the 2s blank time. During the blank time, a green cross fixation point would appear in the center of the screen to control the visual
center of the subjects and ensure their concentration.
3) Formal Experiment The formal experiment is consistent with the pre-experiment operation process.
4) Data Statistics By contrast experiment, the cognitive accuracy and response time under different
indicators were counted, and the response time and accuracy of three indicators under
Human Interaction & Emerging Technologies (IHIET-AI 2022) Artificial Intelligence & Future Applications https://openaccess.cms-conferences.org/#/publications/book/978-1-7923-8989-4 different background conditions were compared, and the significance and indication of different symbols under different background conditions were analyzed.
CONCLUSION
The IBM SPSS Statistics was used for variance analysis of the experimental results, and the response time and accuracy were processed. The reaction time statistics
obtained by the experiment are shown below.
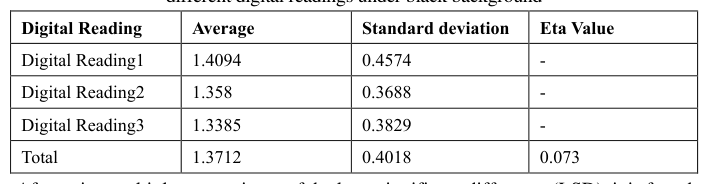
When the digital readings are the same, the response time of each subject to different display interfaces under the same readings is quite different (see Table 3.1). The
response time of the subjects to the contents indicated by different indicator symbols has a large gap, but the gap between different readings is small and the fluctuation is
relatively average.
Table 3. 1 Statistical table of responses of subjects to different digital readings under black background
that there is no significant difference between digital readings 1, 2 and 3 in the response time of subjects, that is, different digital readings have little influence on the
response time of subjects.
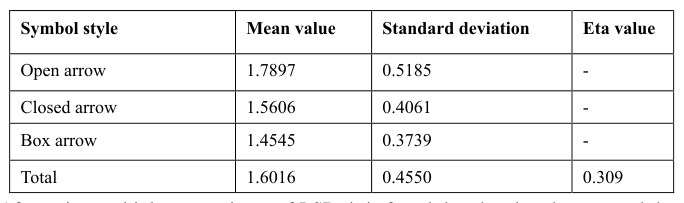
The response time of the subjects to different symbol styles under the condition of black background is in the order of box arrow > open arrow > closed arrow, indicating
a high correlation between symbol styles and response time (see Table 3.2).
Table 3. 2 Data statistics of the responses of subjects to different symbol style under the condition of black background.
and the framed value indicator resulted in a faster response time,and the average response time of the indicator interface selected by the value box is slightly higher
than that of the open arrow.
In conclusion, under the same background conditions, different indicative symbol designs will affect the operational efficiency of pilots.
After excluding the influence of digital readings on the results, three indicators are applied to different background conditions for further study. The result showed that
different symbol styles and background conditions have a significant impact on people's cognitive speed.
The sequence of response time of the subjects from fast to slow is box arrow > closed arrow > open arrow (see Table 3.3). The cognitive speed of the three kinds of arrows
under the actual background all have different declines, while the open arrow decreases greatly.
Table 3. 3 Data statistics of responses of subjects to different symbol styles.
box arrow has a significant difference in symbol style compared with the open arrow which response speed is faster than the open arrow.
In summary, hypothesis 1 is indeed true, and the guiding efficiency of each symbol is different from that under black background in actual operation. This study shows
that the box arrow is a better choice in the HUD interface design of aircraft.
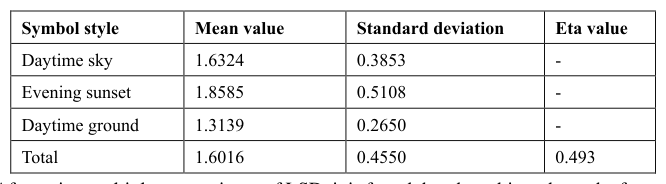
The order of response time from fast to slow is: ground > blue sky > sunset (see Table 3.4).
Table 3. 4 Statistical table of response time data of subjects under different background conditions.
cognition speed of indicative symbols under daytime ground conditions, and cognition speed under evening sunset conditions is the slowest. Hypothesis 2 is true.
The box indicator has the fastest response speed, although the open arrow has a better response speed under the black background, it has the lowest cognitive efficiency
under the actual condition (see Figure 3.1).
Figure 3. 1 Estimated marginal mean of response time After the experiment, in-depth analysis based on the data. The results showed the overall evaluation of the closed arrow and the open arrow was higher, and the prominence and clarity of the box indicator is higher. The prominence and clarity score of the interface in daytime conditions is low.
In addition, box indicators received higher scores for salience and clarity across all backgrounds. It has better indication and recognition. Moreover, the open arrow has
a simpler structure and a smaller proportion of the visual area. Therefore, it has low recognition and readability. This provides theoretical support for the improvement of
the fighter HUD display interface from ergonomics and visual information interaction.
ACKNOWLEDGMENT
This work is supported in part by the Science and Technology on Avionics Integration Laboratory and Aeronautical Science Fund (No. 201955069002)
REFERENCES
Xu, J.F. (1996). Research on the Architecture and Display Design of Civil Aircraft HUD System. Chinese High-tech Enterprise.
Xiao, X., Wanyan, X., & Zhuang, D.(2014). Human-rating design of visual coding based on the airworthiness requirements. Procedia Engineering, 80, 93-100.
Blundell, J., Scott, S., Harris, D., Huddlestone, J., & Richards, D.(2020). Workload benefits of colour coded head-up flight symbology during high workload
flight. Displays, 65.
Innes, R. J., Howard, Z. L., Thorpe, A., Eidels, A., & Brown, S.(2019). The effects of increased visual information on cognitive workload in a helicopter
simulator.
Stanton, N.A., Plant, K.L., Roberts, A.P., & Allison, C.K.(2019). Use of highways in the sky and a virtual pad for landing head up display symbology to enable
improved helicopter pilots situation awareness and workload in degraded visual conditions. Ergonomics, 62(2), 255-267.
Read this individual research paper free through the original publisher, or explore the full digital proceedings book.
ISBN 978-1-7923-8989-4
Explore this ISBN in the AHFE Bookstore ↗Listed in the July 2026 bookstore catalogue; search by ISBN to confirm current availability · Digital book purchase optional