Toshiyuki Sugimachi (2024). Design of Human-Machine Interface for Truck Platooning Using Driving Simulator. In: Human Factors in Design, Engineering, and Computing. AHFE Open Access, vol. 159, pp. 1100–1110. https://doi.org/10.54941/ahfe1005676
Environmental and energy problems as well as countermeasures of the driving burden of truck drivers are critical issues in the logistics industry in Japan. As a solution to these problems, concerns regarding autonomous truck platooning of heavy-duty trucks are heightened globally. The actual operation of truck platoon systems in which trucks are unmanned is considered in limited traffic environments, such as expressways. The lead truck driver should confirm the safety of not only his/her truck but also those of the trailing truck(s). This study designs and evaluates a Human-Machine Interface (HMI) for the driver of the leading truck in an unmanned truck platoon using a driving simulator (DS). The HMI was assessed through a combination of objective evaluation of driving behavior, biometric data, and subjective feedback gathered via a questionnaire. The results demonstrated that the driver of the leading truck could effectively change lanes using the proposed HMI, and the inclusion of a bird’s-eye view significantly improved driver acceptance.This study proposes an HMI that incorporates mirror image displays and a bird’s-eye view as in-vehicle HMI components.1.Mirrorless Image Display:When the driver of the leading truck in a platoon checks the safety of the surroundings, it is crucial to visually confirm the side mirrors and rear monitor. The position to be displayed by the camera in the platooning is considered, and the image display is adapted to the safety confirmation of the drivers in the platoon.2.Bird’s-Eye View Display:In addition to the selected mirror images, this study proposes a bird’s-eye view that facilitates understanding the positional relationship with other trucks when confirming safety. In this study, the DS is used to measure the driving behavior of the participants. Biometric measurements are also taken to assess psychological burden. Furthermore, a questionnaire is conducted as a subjective evaluation, and a comprehensive assessment is made by integrating these results with the objective evaluation of driving behavior. The effectiveness of the proposed HMI was demonstrated through the DS experiment results.
Automated driving systems are expected to replace conventional manned transportation as a means of addressing the shortage of transport workers and the difficulty of securing means of transportation in rural areas with declining populations. The Cabinet Office is currently working on realizing unmanned rear-end platoon driving of large trucks on expressways. Unmanned rear-end platoon driving refers to a convoy of two or more vehicles in which only the lead vehicle is manned and the trailing vehicle(s) is electronically towed unmanned at a fixed distance from each other.
To realize truck platoon driving systems in which the trailing vehicle(s) is unmanned, a control system for autonomous driving is required. Control algorithms (Ario et al., 2016; Tao et al., 2018; Sugimachi et al., 2019) for truck platoon driving systems are used to control the tracks. The lead vehicle driver must be able to ensure the safety of multiple trailing vehicles. The driver must ensure the safety of the entire platoon. Confirming the safety of the entire convoy only from the lead vehicle driver’s seat places a high physical
Design of Human–Machine Interface for Truck Platooning Using Driving Simulator 1101
and psychological burden on the driver. Thus, the support of a human– machine interface (HMI) is required. Although there have been several studies on HMI (Koo et al., 2015; Du et al., 2019; Yang et al., 2021; Yang et al., 2021) in automated driving and automobiles, studies on lead vehicle drivers in truck platoons are limited.
In this study, we propose an HMI for lead vehicle drivers in truck platoon driving systems with unmanned following vehicles, assuming a mirrorless vehicle, which has been banned in Japan since June 2016, and design a bird’s-eye view HMI that displays images to the lead vehicle drivers and their positional relationship with other vehicles. We also evaluate the effectiveness of the proposed HMI via experiments using a driving simulator (DS).
HMI FOR TRUCK PLATOONING This section illustrates the mirrorless image and bird’s-eye view display used as in-vehicle HMI.
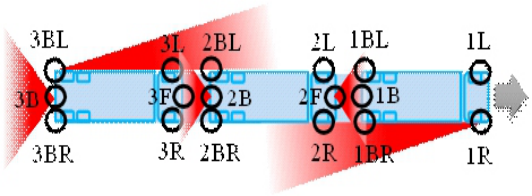
Mirrorless Image Display Side mirrors and rear-view monitors are essential for lead vehicle drivers in a convoy truck to check the surroundings. Figure 1 shows possible mirror locations in a convoy truck: Groups R and L display the right and left rearward views, respectively, and Groups B and F display the rear and front, respectively. The mirrorless image display visualizes the views of all mirrors, including 1R and 1L, at their positions on a monitor as an in-vehicle HMI.
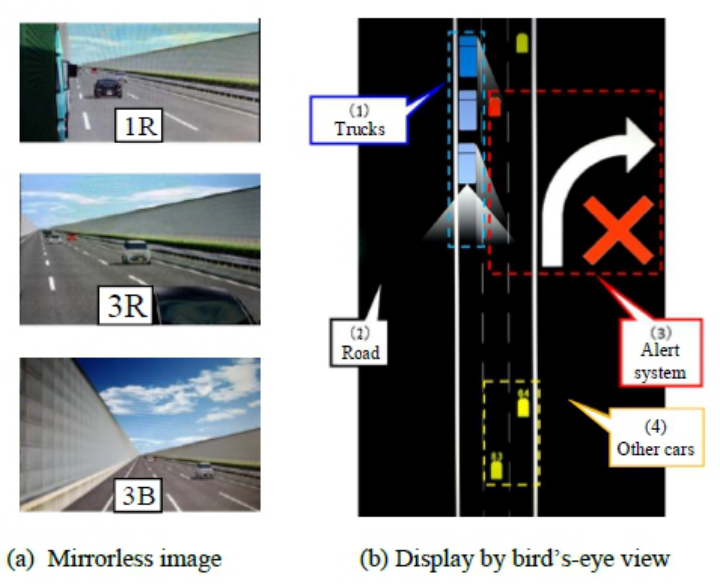
However, displaying all mirrors is inefficient. To minimize monitoring burden, we designed display positions based on interviews with freight companies for practical use. Conventional 1R, 1L, and 3B views for safety checks are adopted. Groups that mix forward and backward views or obstruct key views are excluded. Thus, 2R, 2L, 3R, and 3L, with 3R and 3L chosen for effective lane-change (LC) checks. We propose displaying mirrorless images at 1R, 1L, 3R, 3L, and 3B. Figure 2(a) shows an example using computer graphics.
Figure 1: Mirror positions displayed on in-vehicle HMI.
HMI With Bird’s Eye View We propose a bird’s-eye view method (Figure 2(b)), in addition to a mirrorless image display, to help drivers intuitively understand the positional
1102 Sugimachi and Suda
relationships with other vehicles for safety checks. Specifications for the HMI using the bird’s-eye view were developed based on interviews with freight carriers. In the bird’s-eye view, the longitudinal positions of convoy trucks are fixed and only their lateral movements are displayed to represent their lane positions. The road surface is shown on a high-contrast display covering 120 m, with lanes that are 3.5 m wide, to enhance visibility. Lane boundaries move downward to convey a sense of speed. The system also includes an alert function that notifies drivers when vehicles approach specific positions near the convoy trucks, displaying these vehicles in red with arrows and crosses to highlight potential dangers. Other vehicles that do not trigger alerts are shown in yellow with distance indicators relative to the convoy trucks; this helps drivers maintain situational awareness.
Figure 2: Examples of mirrorless image and display by bird’s-eye view.
EVALUATION METHOD In this study, we measure subjects’ driving behavior using DS and simultaneously conduct biometric measurements and an objective evaluation through quantitative analysis of these measurements. Subjective evaluation is also performed using questionnaires. A comprehensive evaluation is made from the objective and subjective evaluations.
Design of Human–Machine Interface for Truck Platooning Using Driving Simulator 1103
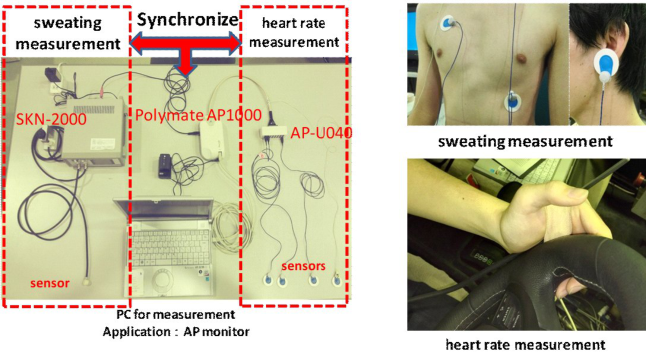
The measurement devices used in this study are shown on the left of Figure 3. As shown on the right of Figure 3, the subject drives with a sensor for measuring perspiration attached to one hand and a sensor for measuring heart rate attached to both ears and two locations on the chest.
Figure 3: Biomedical measurement equipment.
EXPERIMENTAL METHOD The effectiveness of the proposed in-vehicle HMI is evaluated through DS experiments. The most important scene for safety confirmation in convoy trucks is the LC for merging and overtaking. Therefore, the experiments evaluate LC. An experimental scenario in which the lead vehicle driver of a heavy-duty truck performs LC while ensuring the safety of the surrounding area is a situation in which the driver overtakes a low-speed vehicle. The subject starts from a stop in the first travel lane, accelerates to 70 kph, and encounters a low-speed vehicle ahead. The subject confirms the safety of the surrounding area using the in-vehicle HMI and then decides to move right into the second travel lane. This experiment was reviewed by the Ethics Review Committee of the Life Science Committee of the University of Tokyo and was conducted with the informed consent of the subjects.
Subject The subjects were eight healthy adult males with a heavy-duty vehicle license. They were in their 40s and 50s (mean age: 46.4 ± 4.5), and three of them were in the transportation industry.
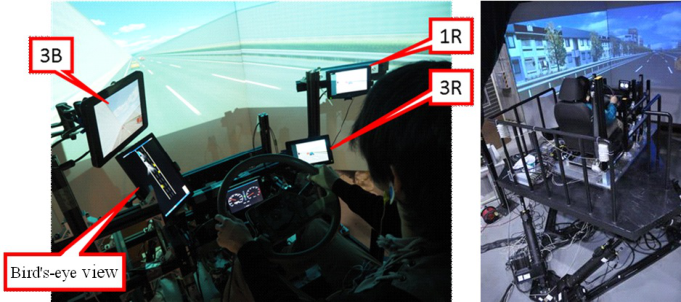
DS In this study, a DS owned by the Institute of Industrial Science, University of Tokyo, was used. As shown in Figure 4, the DS has a swaying device capable of 6-DOF motion. The cabin is constructed with an aluminum frame, and the
1104 Sugimachi and Suda
DS can reproduce a 120
field of view from the driver’s seat, steering reaction force, wind, noise, and engine noise.
The positions of the 1R and 3B monitors are set based on the measured positions and visibility of actual trucks. The 3R monitor is set to display images, and the 1R monitor is set to display the bird’s eye view. The 3R monitor is installed in the cabin to avoid confusion between the 1R and 3B monitors because of the similarity between 1R and 3R images. The bird’s-eye view monitor is installed so that it does not interfere with the steering wheel and forward view. The bird’s-eye view monitor displays the positions of other vehicles through real-time communication with the DS.
Figure 4: DS.
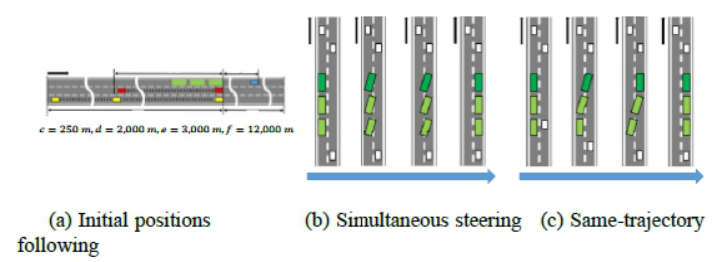
Experimental Conditions The experimental course was a straight, 15-km long, 3.5-m wide highway with three lanes and no speed limits or obstacles. This setup ensures the safety of surrounding areas during LCs (Figure 5). Experiments focused on conditions affecting the ease and acceptability of safety checks for the lead truck driver when overtaking low-speed vehicles, excluding traffic congestion or regulations.
Brightness conditions were set to daytime and nighttime, considering clear skies, to evaluate safety confirmation around the convoy vehicles. The convoy vehicles comprised large trucks, each 12 m long and weighing 25 t, whereas the surrounding vehicles were randomly generated passenger cars. The speed of surrounding vehicles was fixed: 50, 80, and 100 km/h in the first, second, and overtaking lanes, respectively.
The initial positions of surrounding vehicles and traffic density were set as shown in Figure 5(a). Traffic density was divided into low and medium levels, with specific numbers of vehicles in each lane. LC conditions were established to simulate interactions between lanes, with a 5% LC probability set to maintain consistent traffic density. The distance between trucks in a convoy with three trucks was 4 m. The lead vehicle was operated manually while the LC control method for the trailing trucks was evaluated based on the
Design of Human–Machine Interface for Truck Platooning Using Driving Simulator 1105
simultaneous steering and same-trajectory following scenarios (Figures 5(b) and 5(c)).
We evaluated the effectiveness of the proposed mirrorless image display and bird’s-eye view as an in-vehicle HMI for ensuring the safety of lead truck drivers. Eight combinations of conditions, including time of day, traffic density, control method, and presence of HMI, were tested in the trials using a Latin square design to minimize order effects.
Figure 5: Initial positions of vehicles and control methods.
EXPERIMENTAL RESULTS This section presents the results of the driving behavior, biometric measurements, subjective evaluation, and overall evaluation of the experiments.
Driving Behavior The average time taken for LC was calculated for each experimental condition, defined as the time taken for the subject to turn on and off the right blinker for LC. The average time spent for LC is listed in Table 1.
Table 1. Time required for LC.
Table available in the original PDF paper.
ID Item Condition Average Time [s] 1 Brightness Day 6.54 2 Night 6.76 3 Traffic density Low 6.40 4 Middle 6.90 5 Control method Simultaneous steering 6.56 6 Same trajectory 6.75 7 HMI w/o bird’s-eye view 6.79 8 w/ bird’s-eye view 6.52
First, for brightness, the average time was 0.22 s shorter during the day than during the night, attributable to drivers being more cautious about LC
1106 Sugimachi and Suda
at night due to poor visibility. Next, for traffic density, the average time was 0.5 s shorter for the low level than for the medium level. It is considered that the low-level traffic density allowed for quicker LC because there were fewer vehicles in the destination lane. For the control method, simultaneous steering had a shorter average time of 0.19 s than same-trajectory following. This is consistent with the shorter LC time for simultaneous steering because all the trucks in the platoon move simultaneously. Finally, for the HMI system, the average time was 0.27 s shorter when the bird’s-eye view was available than when only mirrorless images were available. This may be because drivers could make quicker decisions for safety confirmation when using the bird’s- eye view.
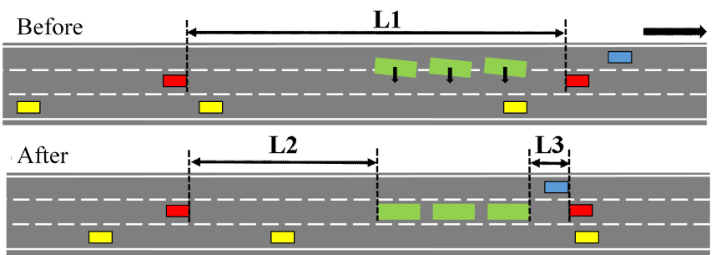
As a guideline for evaluating the impact of LC on surrounding traffic, the distance between general front and rear vehicles before and after LC (L1), the distance between rear vehicles after LC (L2), and the distance between front vehicles after LC (L3) were defined as in Figure 7, and the average values were calculated for each experimental condition.
Table 2 shows the average distances for each LC. First, for brightness, L1 was 11.1 m longer during the day than during the night. Despite the longer L1 during the day, L2 was 16.7 m longer during the day than during the night and L3 was 5.5 m shorter during the day than during the night. As presented in Table 1, this may be due to the longer time spent on LC during the night, which results in a greater distance between the lead vehicle and general traffic behind it. Next, for traffic density, L1, L2, and L3 were 69.2, 58.5, and 10.6 m longer in the low, medium, and low levels, respectively. This is because there are fewer vehicles in the destination lane, which allows subjects to perform LC with more margin for L1. For the control method, simultaneous steering was 5.2 m shorter for L1, 0.6 m shorter for L2, and 4.6 m shorter for L3 than when same-trajectory following was employed, indicating that simultaneous steering can perform LC more quickly and thus can achieve LC for shorter distances. Finally, for the HMI system, L1 was 15.7 m longer when only mirrorless images were used than when bird’s- eye views were used. This is thought to be because the drivers wait for the distance between vehicles to increase. Moreover, it is difficult to grasp the sense of distance from surrounding general vehicles when safety confirmation is performed using only mirrorless images. L2 was 19.5 m longer in the case of only mirrorless images, whereas L3 was 3.8 m shorter in the case of the bird’s-eye view. This is thought to be because when LC is performed using only mirrorless images, vehicles in the second lane appear diagonally in front of the lead vehicle before LC is performed since it is difficult to grasp the distance to the rear.
To evaluate stability during LC, including safety checks, synthetic jerks were calculated for LC intervals, and the average value was obtained for each experimental condition.
Table 3 lists the average values of synthetic jerks related to LC. First, for brightness, the average value of synthetic jerks during the day was 0.51 m/s3 lower than that during the night. Second, for traffic density, the average value for the low level was 1.33 m/s3 lower than that for the medium level. For the control method, the average value for simultaneous steering was 0.58 m/s3
Design of Human–Machine Interface for Truck Platooning Using Driving Simulator 1107
smaller than that for same-trajectory following. Finally, for the HMI, the average value of synthetic jerks when a bird’s-eye view was available was 0.83 m/s3 smaller than when only mirrorless images were available. These results indicate that the daytime, low-level, and simultaneous steering with the bird’s-eye view condition has a smaller average value of synthetic jerks than the compared conditions, indicating smooth operation, including safety confirmation.
Table 3. Results of jerk.
Table available in the original PDF paper.
ID Item Condition Jerk [m/s3] 1 Brightness Daytime 7.45 2 Night 7.97 3 Traffic density Low 7.05 4 Middle 8.37 5 Control method Simultaneous steering 7.42 6 Same trajectory 8.00 7 HMI w/o bird’s-eye view 8.12 8 w/ bird’s-eye view 7.30
1108 Sugimachi and Suda
Biometric Measurements In this study, heart rate and perspiration data were collected to assess the subjects’ biological responses. The evaluation was based on the likelihood and amount of increase in heart rate and perspiration. To quantitatively compare the responses, two intervals were defined: “LC interval”and “stable interval.” The stable interval, where biological responses are calm, was set from 15 s after the start of running until the LC interval. If the stable interval was less than 5 s, it was adjusted to span from 15 s after the right blinker was turned off to 10 s before the end of running.
The average heart rate and perspiration during the intervals were used to determine the increase rate and probability for each condition (Table 4). For brightness, the increase rate was 0.11 bpm higher during the night and the probability of increase was 0.08 higher during the day. For perspiration, daytime showed a 0.76 × 10⁻⁴ mg/min increase and the probability of increase was 0.03 higher at night. The relationship varied, indicating no consistent pattern. For traffic density, heart rate increased 0.92 bpm at lower levels than at higher levels, and the probability of increase was 0.14 higher. For perspiration, the medium level had a 0.28 × 10⁻⁴ mg/min increase and a 0.12 higher probability. The heart rate and perspiration patterns differed across conditions.
Table 4. Results of heart rate and sweating.
Table available in the original PDF paper.
ID Condition Incr. of Heart Rate Incr. of Sweating Amount [bpm] Rate Amount [mg/min] Rate
Under the truck control scheme, heart rate and perspiration increases were higher for simultaneous steering (0.40 bpm and 1.1 × 10⁻⁴ mg/min, respectively) than same-trajectory following, suggesting that simultaneous steering is more natural and reduces tension. Finally, for the HMI, heart rate and perspiration increases were higher with mirrored images only than when using a bird’s-eye view, suggesting that the latter reduces tension levels.
Subjective Evaluation For subjective evaluation, a five-point written questionnaire was administered after each trial regarding the degree of relaxation (Q1), ease of LC (Q2), and ease of safety confirmation (Q3). The average scores for Q1–Q3 are listed in Table 5.
First, day was rated higher than night in Q1, Q2, and Q3. This may be because it is easier to get a sense of distance from ordinary vehicles during
Design of Human–Machine Interface for Truck Platooning Using Driving Simulator 1109
the day than during the night. Next, for traffic density, the low level was rated higher than the medium level in Q1, Q2, and Q3. This is thought to be because there are fewer vehicles in the destination lane, which allows LC to be performed with a margin of safety. For the control method, same- trajectory following was evaluated more highly than simultaneous steering in Q1 and Q3. For Q2, simultaneous steering was evaluated more highly. This may be because simultaneous steering requires less time for LC since all the trucks move simultaneously. Finally, for the HMI, the bird’s-eye view was rated higher for Q1, Q2, and Q3 than the mirrorless images. These results are consistent with the biological response analysis results, and the same inference can be made. In the free comments, we obtained positive comments from all subjects on the bird’s-eye view. Meanwhile, some subjects pointed out the danger of staring at the bird’s-eye view too much or of being able to LC for a short distance.
In this study, we proposed an HMI with a mirrorless image display position and bird’s-eye view. We evaluated the acceptability of drivers in terms of LC time, stability, and relaxation level (Table 6). The most influential factor in acceptability was the HMI, which enables LC with or without a bird’s-eye view. The addition of a bird’s-eye view significantly improves the acceptability of LC. Meanwhile, approximately 83% of conditions where L1 was less than 75 m were when a bird’s-eye view of low-level traffic density was used. These results agree with the free comments of the drivers, indicating that the convenience of the bird’s-eye view map may induce a lack of driver tension. Although the experimental results show the effectiveness of the proposed HMI, it is crucial to construct an HMI that does not lack a sense of tension because its high convenience is likely to influence the driver.
Table 6. Summary of experimental results.
Table available in the original PDF paper.
Index Brightness Traffic Density Control Method HMI Time Day Low Simultaneous steering w/ bird’s-eye view Stability Day Low Simultaneous steering w/ bird’s-eye view Relax - - Same trajectory w/ bird’s-eye view
1110 Sugimachi and Suda
ACKNOWLEDGMENT
This research was conducted as part of the Smart Mobility System R&D Demonstration Project sponsored by the Ministry of Land, Infrastructure, Transport and Tourism (MLIT) and the Ministry of Economy, Trade and Industry (METI), and we would like to express our gratitude for their support.
The author thanks Professor Yoshihiro Suda of Institute of Industrial Science, the University of Tokyo for his generous support.
REFERENCES
B. Yang, R. Ishii, Z. Wang, T. Kaizuka, T. Sugimachi, T. Sakurai, T. Maki and K.
Nakano: Evaluation of Driver Assistance System Presenting Information of Other Vehicles through Peripheral Vision at Unsignalized Intersections, International Journal of Intelligent Transportation Systems Research, 19(1), pp. 230–239 (2021). B. Yang, T. Obana, Z. Wang, T. Kaizuka, T. Sugimachi, T. Sakurai, T. Maki and K. Nakano: Evaluations of Different Human Machine Interfaces for Presenting Right-Turn Timing at Intersections, International Journal of Intelligent Transportation Systems Research, 19(1), pp. 71–82 (2021). J. Koo, J. Kwac, W. Ju, M. Steinert, L. Leifer, and C. Nass: Why Did My Car
Just Do That? Explaining Semi-autonomous Driving Actions to Improve Driver Understanding, Trust, and Performance, International Journal on Interactive Design and Manufacturin (IJIDeM), 9(4), pp. 269–275 (2015). M. Tao, T. Sugimachi, Y. Suda, D. Kato, K. Shibata and J. Li: A Study on Vehicle Dynamics and Driver Model to Improve Driver’s Line Traceability in Cornering, The Dynamics of Vehicles on Roads and Tracks, 1, pp. 239–246, (2018). N. Du, J. Haspiel, Q. Zhang, D. Tilbury, A. K. Pradhan, X. J. Yang, and L. P. Robert:
Look Who’s Talking Now: Implications of AV’s Explanations on Driver’s Trust, AV Preference, Anxiety and Mental Workload, Transportation Research Part C: Emerging Technologies, 104, pp. 428–442 (2019). T. Ario, T. Sugimachi, T. Fukao and H. Kawashima: Evaluation of Fuzzy Inferencebased Self-tuning of Steering Control Gains for Heavy-duty Trucks, International Journal of Intelligent Transportation Systems Research, Volume 14, Issue 2, pp. 92–100, (2016). T. Sugimachi, T. Fukao, T. Ario and Y. Suda: Steering Control and Automatic Tuning
to Compensate for Road Cant, International Journal of Intelligent Transportation Systems Research, 17(2), pp. 142–149 (2019).
LISTED IN THE AHFE DIGITAL BOOKSTORE CATALOGUE
Explore the complete digital volume
Human Factors in Design, Engineering, and Computing
Read this individual research paper free through the original publisher, or explore the full digital proceedings book.
ISBN 978-1-964867-35-9
Explore this ISBN in the AHFE Bookstore ↗Listed in the July 2026 bookstore catalogue; search by ISBN to confirm current availability · Digital book purchase optional