Jin-yu Song, Yung-ching Liu (2026). Impact of AR Head-Up Displays on Driver Performance and Safety Across Age Groups. In: Advances in Human Factors of Transportation. AHFE Open Access, vol. 224, pp. 550–558. https://doi.org/10.54941/ahfe1007883
In-Vehicle Information Systems (IVIS) can enhance driving performance, yet poorly designed interfaces may increase distraction and crash risk. This study investigated how different display modalities influence driving performance and user experience across age groups. A simulator-based experiment was conducted with younger and older drivers using head-down displays (HDD), head-up displays (HUD), and augmented reality head-up displays (AR-HUD), with and without auditory support. Results showed that AR-HUD improved overall driving stability, reduced collision risk, and enhanced navigation performance compared to conventional displays. The integration of auditory cues further improved performance, eliminating navigation errors. Notably, although older drivers exhibited lower baseline performance, they benefited substantially from AR-HUD in terms of vehicle control and lane-keeping stability. These findings highlight the effectiveness of spatially integrated and multimodal interface design in improving driving safety, particularly for older drivers.
Taiwanese traffic statistics (2018–2022) indicate that young (18–24) and older drivers (65 + ) are significantly overrepresented in severe accidents. Older drivers account for 20.83% of fatalities, while young drivers represent 10.11%. These elevated risks are attributed to inexperienced hazard prediction in younger cohorts (Fuller, 2011) and age-related functional decline in older populations (Doroudgar et al., 2017). Given that distraction and traffic violations remain primary accident catalysts, In-Vehicle Information Systems (IVIS) that provide real-time navigation and safety alerts offer a promising intervention to enhance situational awareness.
Since distraction and traffic violations are primary accident catalysts, In-Vehicle Information Systems (IVIS) offer a critical safety intervention. While traditional Head-Down Displays (HDD) increase crash risk by diverting the driver’s gaze from the road (Dingus et al., 2006). The standard Head-Up Displays (HUD) offer an improvement; however, despite reduced display fixation times (Ablassmeier et al., 2007), they still require a cognitive focal shift that may lead to inattentional blindness (Prinzel III & Risser, Received January 27, 2026; Revised April 12, 2026; Accepted May 2, 2026; Available online July 20, 2026
Impact of AR Head-Up Displays on Driver Performance and Safety Across Age Groups 551 2004). Augmented Reality Head-Up Displays (AR-HUD) superimpose information directly onto the external environment. By aligning digital cues with physical road entities, AR-HUDs eliminate gaze shifts and minimize inattentional blindness, potentially reducing collisions caused by forward- roadway inattention (Winkler & Soleimani, 2025).
To address these limitations, this study utilizes a driving simulator to investigate the behavioural and subjective implications of Augmented Reality Head-Up Displays (AR-HUD), which superimpose digital cues directly onto the external environment. The primary objective is to assess the effects and potential interactions of display type (HDD, HUD, and AR-HUD) and auditory information (present vs. absent) across distinct age cohorts.
LITERATIRE REVIEWS Traditional Head-Up Displays (HUD) offer superior efficiency over Head- Down Displays (HDD) by reducing glance durations by up to 25% and minimizing the “attention gaps” caused by focal accommodation (Ablassmeier et al., 2007). While HUDs generally enhance situational control and reduce mental workload, they are not a panacea; issues such as “inattentional blindness” and the “shrink effect”, where drivers overestimate distances due to 2D overlays, remain prevalent (Prinzel III & Risser, 2004; Thomas & Wickens, 2001). Augmented Reality (AR) HUDs resolve these issues by projecting information into a 3D-like field of view that is spatially synchronized with the real world (Moussa et al., 2012). This synchronization eliminates the need for focal adjustments, allowing drivers to maintain gaze continuity while significantly improving hazard detection and situational awareness (Kim & Gabbard, 2022; George et al., 2012).
Empirical data highlights the clear advantages of AR-HUDs, particularly in complex navigation and elderly driver support (Schall Jr et al., 2013). In comparative navigation tasks, AR-HUDs achieved 100% accuracy, outperforming HUD e-maps (92%) and paper maps (10%) (Yount et al., 2022). Furthermore, AR-HUD users identify turn-off points earlier, releasing the accelerator at 70.2m compared to 59.3m for HUD users, while maintaining a lower mental workload (Chauvin et al., 2023). However, these benefits come with cognitive costs. The “compelling” nature of AR graphics can monopolize attention or physically obstruct the driver’s view, leading to higher miss rates in secondary tasks (Maag et al., 2023). Additionally, technical issues like graphical “shimmering” or imprecise placement can prevent gains in user comfort and confidence, despite high objective performance (Chauvin et al., 2023; Pfannmüller et al., 2015).
While auditory cues are vital for traditional systems, significantly reducing braking reaction times and collision rates (Xiang et al., 2016), their synergy with AR-HUDs is less pronounced. In scenarios involving signalized intersections or obscured pedestrians, adding auditory alerts to an AR interface provides no statistically significant improvement in response performance (Calvi et al., 2020a, 2020b). This suggests that the high level of spatial synchronization inherent in AR-HUDs may already optimize visual attention to its ceiling, rendering additional auditory redundancy ineffective.
552 Song and Liu This “redundancy effect” raises critical questions for future research: does AR-HUD negate the need for sound, or does it simply require a fundamentally different auditory format than traditional displays?
METHODS
Participants The study recruited 66 participants, including 34 younger adults (aged 18–30) and 32 older adults (aged 65 and above). All participants were required to hold a valid Taiwanese driver’s license, possess normal or corrected-to-normal vision (0.8 or higher) without colour blindness, and pass an online hearing screening to ensure auditory eligibility. Additionally, older participants were screened using the Mini-Mental State Examination (MMSE) to confirm normal cognitive function. This study was conducted following approval from the Institutional Review Board (IRB) of National Cheng Kung University Hospital (Approval No. B-ER-113-088).
Display Interfaces The display interface was designed based on font size, typeface, color schemes, icons, and duration. The auditory interface (via Logitech Z150 speakers) optimized loudness, alert discriminability, and synthetic speech to meet ergonomic principles. Specifically, navigation and road sign prompts used a female voice (Large & Burnett, 2013) at 180 words per minute, while warnings utilized a standard 2600 Hz “beep.” Additionally, event visual warning messages are displayed as standard regulatory hazard symbols , pulsing (scaling) at a frequency of 350ms. A time to collision (TTC) of 3 seconds provides drivers with sufficient reaction time while maintaining a low false alarm rate (Qu et al., 2014). Consequently, the event warning prompts in this study are triggered 3 seconds prior to the occurrence of the event.
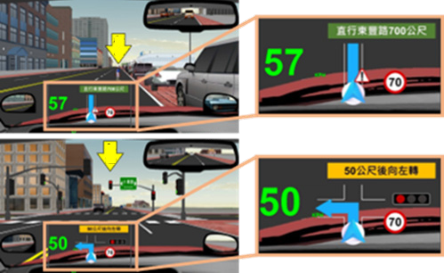
In this study, a tablet on the center console served as the HDD (10.1- inch Apple iPad Air 5 with a resolution of 2360 × 1640 (264 ppi)), while the HUD (a 24-inch monitor (1920 × 1080 resolution) served as the signal light source, projected via a mirror onto an 87 × 87 cm transparent glass combiner for image display) was positioned in the driver’s line of sight above the hood. To simulate transparency and minimize distraction, the HUD background was color-matched to the road surface. The HUD layout mirrors the HDD (Figure 1), featuring road signs in the bottom-right for spatial compatibility, top-down navigation in the bottom-left with blue segments (RGB: 26/176/255), and textual guidance at the top in white on a green background (Figure 1, upper-right inset). To enhance awareness, prominent yellow-and-black alerts specify the “remaining distance and turn direction” at 500m, 300m, 100m, 50m, and the intersection (Figure 1, bottom-right inset), while event warnings are dynamically positioned to align with their real-world locations.
Figure 1: Simulation of a HUD system providing contextual navigation and safety alerts based on road events. The top panel shows the system’s response to a pedestrian (indicated by the yellow arrow), triggering a red exclamation warning sign on the HUD alongside a green straight-ahead navigation banner (Go straight on Dongfeng Road for 700 meters). The bottom panel demonstrates the system identifying an upcoming red light (indicated by the yellow arrow), replicating the signal status on the HUD and updating the navigation banner to a yellow left-turn in 50 meters alert. In both cases, the HUD overlays current speed in green (e.g., 50KPH, 57KPH), the speed limit (70KPH), and blue pathfinding arrows directly onto the driver’s field of vision.
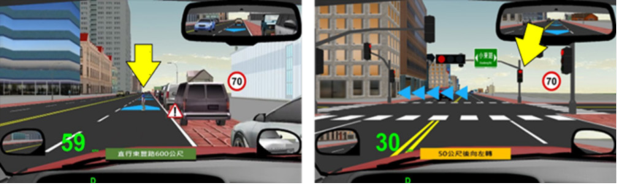
In contrast, the AR-HUD overlays system information directly onto the road environment. Navigation uses blue (RGB: 26/176/255) triangular arrows projected onto the ground at 25m intervals. Text instructions maintain the same colour scheme as the HDD/HUD but are positioned just above the hood line. Road sign data is superimposed exactly over actual physical signs at a 1:1 scale to prevent obstructing the driver’s view of the road (Figure 2).
Figure 2: Simulation of an AR-HUD system providing dynamic navigation and safety alerts based on real-world road events. The left panel illustrates the system’s response to a pedestrian (indicated by the yellow arrow for reference), triggering a red exclamation warning icon on that pedestrian spot, alongside a green straight-ahead navigation banner. The right panel demonstrates the system identifying an upcoming red light (indicated by the yellow arrow), replicating the signal status on the traffic light location, and updating the navigation banner to a yellow left-turn alert. For the turn feature, the AR-HUD projects a series of blue directional arrows directly onto the road surface to guide the vehicle’s path, while simultaneously providing telemetry such as the current speed in green (e.g., 30, 59 KPH) and the 70 KPH speed limit.
The experiment utilized the STISIM M3000 driving simulator developed by Systems Technology, Inc. (STI®), with driving scenarios scripted in Scenario Definition Language (SDL 3.22.11) and data collected at a sampling frequency of 30 Hz. To enhance realism, the setup integrated a physical VOLVO 340 DL vehicle body equipped with a Logitech G29 Driving Force steering wheel and pedal set.
The experiment consisted of six driving scenarios, each paired with a specific display type. Each scenario featured an 18-kilometer route with an approximate driving duration of 20 minutes. The content included six road events, and 11 turn-decision points. To prevent learning effects, the sequence of events and turn directions were randomized across the six scenarios. During the drive, participants were required to complete tasks based on real- world traffic signals and system information provided by the display.
The simulated environment represented a daytime urban setting with a four-lane road (two lanes in each direction), featuring 14 traffic lights, road signs, and street nameplates. The lane width was designed to be 3.65 meters with a speed limit of 70 km/h. Road events were triggered 3 seconds before the driver’s arrival, at which point the system provided warnings to alert the participants. These six road warning events were designed based on the most frequent accident causes reported by the Taiwan National Police Agency (NPA); they included two hidden events (pedestrians crossing and roadside vehicles cutting in) and four visible events (overtaking vehicles, oncoming vehicles turning left, red-light runners, and illegal right-turning vehicles).
The road environment was projected by an EPSON projector onto a 100- inch (200×150 cm) Mocom Power Screen®. Engine sounds and ambient driving audio were delivered via an Edifier C3X 2.1-channel three-piece wooden speaker system.
EXPERIMENTAL DESIGN AND PROCEDURES This study employed a mixed-factor experimental design: 2 (Age: older adults vs. younger adults; between-subjects) × 3 (Visual Interface: HDD vs. HUD vs. AR-HUD; within-subjects) × 2 (Auditory Interface: audio-off vs. audio-on; within-subjects). The dependent variables collected in this experiment are categorized into: driving behavior, navigation performance, warning event response performance, and subjective workload ratings.
Upon arrival, participants’ eligibility was verified by confirming a valid driver’s license and conducting vision, hearing, and cognitive screenings. Qualified participants were then briefed via a concise presentation detailing the experimental workflow, the display characteristics of the HDD, HUD, and AR-HUD, and the required responses for road events and scales. After providing informed consent and basic demographic data, participants underwent a 10-minute practice session. This involved driving a 2-kilometer urban segment for each interface to familiarize themselves with the simulator’s operation, the event triggers, and the survey procedures.
The formal experiment followed a multi-stage process. Before driving, participants completed the DALI (Driver Activity Load Index) questionnaire.
Impact of AR Head-Up Displays on Driver Performance and Safety Across Age Groups 555 They then drove six randomized scenario combinations, each lasting approximately 20 minutes. During each drive, participants were required to drive safely and performed navigation tasks and responded to six road events. Following each scenario, they completed the DALI, and a preference questionnaire regarding event warning displays. To prevent fatigue, a 5-minute rest period was provided between scenarios. The total experimental duration was approximately four hours, split across two days (three interface combinations per day) with at least a one-day interval between the two sessions.
RESULTS
Based on the dependent variables collected, the significant findings of this study are summarized as follows: (1) Driving behavior and vehicle control: Statistical analysis revealed that Age
had a significant main effect on mean speed (F(1,60) = 8.99, p = 0.004), with younger drivers maintaining higher speeds overall. A significant Interface × Age interaction (F(2,120) = 5.08, p = 0.008) indicated that while younger drivers were consistently faster, the age gap was most pronounced in the AR-HUD condition.
Regarding vehicle stability, AR-HUD significantly outperformed both HDD and HUD by reducing speed variance (F(2,120) = 77.64, p < 0.001) and longitudinal acceleration variance (F(2,120) = 5.77, p < 0.001). Furthermore, a significant interaction for lateral acceleration variance (F(2,120) = 4.54, p = 0.013) and lane position variance (F(2,120) = 1.78, p < 0.001) demonstrated that older adults experienced the highest instability when using the HDD; however, this instability was significantly mitigated by the AR-HUD and HUD interfaces. Audio alerts also played a critical role in enhancing control, significantly improving steering stability (F(1,60) = 21.53, p < 0.001). (2) Warning event response: ANOVAs for visible warning event reaction time (RT) revealed significant main effects for Age (F(1,60) = 28.308, p < .001), Display (F(2,120) = 72.888, p < .001), and Audio (F(1,60) = 132.657, p < .001), along with significant interactions for Audio × Age (F(1,60) = 6.495, p = .013) and Display × Audio (F(2,120) = 8.274, p < .001).
For the Audio × Age interaction, younger drivers were significantly faster than older drivers in both silent (0.981s vs. 1.244s) and audio-on (0.746s vs. 0.876s) conditions, though audio significantly improved RTs for both groups. For the display, audio alert presence significantly reduced RTs across all interfaces: HDD (1.324s to 0.982s), HUD (1.173s to 0.773s), and AR-HUD (0.830s to 0.672s). Without audio alert, AR-HUD was significantly faster than HUD and HDD; with audio, HDD remained significantly slower than both HUD (0.773) and AR-HUD.
For hidden warning event RTs revealed significant main effects for Age (F(1,60) = 19.444, p < .001), Display (F(2,120) = 56.746, p < .001), and Audio (F(1,60) = 31.770, p < .001). Younger drivers reacted significantly faster than older drivers (0.907s vs. 1.080s). Regarding the display, AR-HUD yielded the fastest reaction times (0.776s), significantly outperforming HUD (1.026s) and HDD (1.179s), with HUD also
556 Song and Liu significantly faster than HDD. Additionally, the presence of audio alerts significantly reduced reaction times compared to silent conditions (0.888s vs. 1.099s). (3) Navigation performance: Navigation accuracy was significantly affected
by the main effects of Age (F(1,60) = 31.199, p < .001), Display (F(2,120) = 7.035, p = .001), and Audio (F(1,60) = 34.439, p < .001), along with a significant Audio × Age interaction (F(1,60) = 27.236, p < .001). Post- hoc analysis showed that in silent conditions, younger drivers were significantly more accurate than older drivers (97.82% vs. 86.26%); however, the introduction of audio verbal messages significantly benefited only the older group, raising their accuracy to 97.82% and effectively eliminating the age gap.
ANOVA for navigation error rate showed significant main effects for Age (F(1,60) = 8.916, p = .004), Display (F(2,120) = 9.408, p < .001), and Audio (F(1,60) = 10.301, p = .002), with significant interactions for Display × Age (p = .045) and Audio × Age (p = .018). In the Display × Age interaction, younger drivers had lower error rates than older drivers on HDD (2.27% vs. 7.12%) and HUD (2.27% vs. 4.70%), while older drivers committed significantly fewer errors with AR-HUD (1.67%) compared to HDD. Regarding Audio × Age, younger drivers outperformed older drivers only in silent conditions (2.08% vs. 6.57%); however, audio verbal messages significantly reduced error rates specifically for older drivers (2.42%). (4) Workload rating: ANOVAs for DALI Score revealed significant main effects for Display (F(2,120) = 23.839, p < .001) and Audio (F(1,60) = 6.657, p < .001), with a significant Display × Audio interaction (F(2,120) = 3.094, p = .049). Regarding the display types, the presence of audio significantly reduced subjective workload scores across all interfaces: HDD (57.31 to 42.22), HUD (52.94 to 38.29), and AR-HUD (42.95 to 33.95). In terms of audio conditions, when silent, the AR-HUD resulted in a significantly lower workload score compared to the HDD (42.95 vs. 57.31).
DISCUSSION
The results of this study highlight the critical role that augmented reality head-up displays (AR-HUD) and Audio interface play in mitigating age- related performance gaps in modern driving environments.
(1) The superiority of AR-HUD in cognitive load reduction: The significant main effects found across all reaction time and workload measures (F(2,120) = 72.888 for RT; F(2,120) = 23.839 for DALI) confirm that AR-HUD effectively addresses the “eyes-off-the-road” issue established by Dingus et al. (2006). By projecting information directly into the driver’s forward field of view, AR-HUD reduces the need for the rapid focal adjustments and head movements required by HDD. This is further evidenced by the Display × Audio interaction (p = .049), where AR-HUD provided the lowest subjective workload scores even without audio assistance, suggesting the visual interface itself is more intuitive.
Impact of AR Head-Up Displays on Driver Performance and Safety Across Age Groups 557 (2) Bridging the age gap with multimodal cues: A key finding was the Audio
× Age interaction in navigation accuracy (F(1,60) = 27.236) and error rates (p = .018). While older drivers struggled significantly more than younger drivers in silent conditions (86.26% vs. 97.82%), the addition of audio cues completely eliminated this performance gap. This suggests that older drivers rely more heavily on redundant, multimodal information to compensate for slower cognitive processing speeds—a concept aligned with Fuller’s (2011) Task Difficulty Homeostasis. The audio alerts likely lowered the perceived task difficulty, allowing older drivers to maintain a performance level comparable to their younger counterparts. (3) Vehicle stability and safety: The instability observed in older adults using HDD, marked by significant variances in lateral acceleration (F(2,120) = 4.54) and lane position (F(2,120) = 1.78), was effectively mitigated by HUD and AR-HUD. This supports the theory of cognitive tunneling (Thomas & Wickens, 2001); by keeping navigation cues “in-path,” drivers avoid the momentary loss of vehicle control that occurs when attention is diverted to a head-down display.
CONCLUSION This research demonstrates that the combination of AR-HUD and Audio alerts provides the most significant safety benefit for both young and older drivers. While younger drivers generally exhibit faster reaction times and higher speeds, the AR-HUD interface significantly stabilizes vehicle control and reduces speed variance for all users. Most importantly, for the older population, the AR-HUD and Audio integration serves as a crucial compensatory tool. It not only reduces subjective workload but also eliminates age-related disparities in navigation accuracy. As automotive technology advances, the implementation of AR-HUD systems with redundant audio feedback should be prioritized as a standard safety feature to support the mobility and safety of an aging society.
ACKNOWLEDGMENT The authors express gratitude to the National Science and Technology Council(NSTC) for funding this research project under grant number 113-2221-E-224-047-.
REFERENCES
Ablassmeier, M., Poitschke, T., Wallhoff, F., Bengler, K., & Rigoll, G. (2007). Eye gaze studies comparing Head-Up and Head-Down displays in vehicles. 2007 IEEE International Conference on Multimedia and Expo, 2250–2252. Calvi, A., D’Amico, F., Ferrante, C., & Ciampoli, L. B. (2020a). Effectiveness of
augmented reality warnings on driving behaviour whilst approaching pedestrian crossings: A driving simulator study. Accident Analysis & Prevention, 147, 105760. Calvi, A., D’Amico, F., Ferrante, C., & Ciampoli, L. B. (2020b). Evaluation of augmented reality cues to improve the safety of left-turn maneuvers in a connected environment: A driving simulator study. Accident Analysis & Prevention, 148, 105793.
558 Song and Liu Chauvin, C., Said, F., & Langlois, S. (2023). Augmented reality HUD vs. conventional
HUD to perform a navigation task in a complex driving situation. Cognition, Technology & Work, 1–16. Dingus, T. A., Guo, F., Lee, S., Antin, J. F., Perez, M. A., Buchanan-King, M., & Hankey, J. M. (2016). Driver crash risk factors and prevalence evaluation using naturalistic driving data. Proceedings of the National Academy of Sciences, 113(10), 2636–2641. Doroudgar, S., Chuang, H. M., Perry, P. J., Thomas, K., Bohnert, K., & Canedo,
J. (2017). Driving performance comparing older versus younger drivers. Traffic Injury Prevention, 18(1), 41–46. Fuller, R. (2011). Driver control theory: From task difficulty homeostasis to risk allostasis. In B. E. Porter (Ed.), Handbook of traffic psychology (pp. 13–26). Academic Press. George, P., Thouvenin, I., Fremont, V., & Cherfaoui, V. (2012). DAARIA: Driver
assistance by augmented reality for intelligent automobile. 2012 IEEE Intelligent Vehicles Symposium, 1043–1048. Kim, H., Wu, X., Gabbard, J. L., & Polys, N. F. (2013). Exploring head-up augmented reality interfaces for crash warning systems. Proceedings of the 5th International Conference on Automotive User Interfaces and Interactive Vehicular Applications, 224–227. Large, D. R., & Burnett, G. E. (2013). Drivers’ preferences and emotional responses
to satellite navigation voices. International Journal of Vehicle Noise and Vibration, 9(1-2), 28–46. Maag, C., Schömig, N., Naujoks, F., Karl, I., Keinath, A., & Neukum, A. (2023).
Measuring workload effects of augmented reality head-up displays using detection response task. Transportation Research Part F: Traffic Psychology and Behaviour, 92, 201–219. Moussa, G., Radwan, E., & Hussain, K. (2012). Augmented reality vehicle system: Left-turn maneuver study. Transportation Research Part C: Emerging Technologies, 21(1), 1–16. Pfannmüller, L., Walter, M., & Bengler, K. (2015). Lead me the right way?! The impact
of position accuracy of augmented reality navigation arrows in a contact-analog head-up display on driving performance, workload, and usability. Proceedings of the 19th Triennial Congress of the IEA, 1–6. Prinzel III, L. J., & Risser, M. (2004). Head-up displays and attention capture (NASA/ TM-2004-213000). National Aeronautics and Space Administration. Schall Jr, M. C., Rusch, M. L., Lee, J. D., Dawson, J. D., Thomas, G., Aksan, N., &
Rizzo, M. (2013). Augmented reality cues and elderly driver hazard perception. Human Factors, 55(3), 643–658. Thomas, L. C., & Wickens, C. D. (2001). Visual displays and cognitive tunneling: Frames of reference effects on spatial judgments and change detection. Proceedings of the Human Factors and Ergonomics Society Annual Meeting, 45(4), 336–340. Winkler, M., & Soleimani, M. (2025). A review of augmented reality heads up
display in vehicles: Effectiveness, application, and safety. International Journal of Human–Computer Interaction, 41(18), 11405–11420. Xiang, W., Yan, X., Weng, J., & Li, X. (2016). Effect of auditory in-vehicle warning information on drivers’ brake response time to red-light running vehicles during collision avoidance. Transportation Research Part F: Traffic Psychology and Behaviour, 40, 56–67. Yount, Z. F., Kass, S. J., & Arruda, J. E. (2022). Route learning with augmented
reality navigation aids. Transportation Research Part F: Traffic Psychology and Behaviour, 88, 132–140.
LISTED IN THE AHFE DIGITAL BOOKSTORE CATALOGUE
Explore the complete digital volume
Advances in Human Factors of Transportation
Read this individual research paper free through the original publisher, or explore the full digital proceedings book.
ISBN 979-8-950676-00-0
Explore this ISBN in the AHFE Bookstore ↗Listed in the July 2026 bookstore catalogue; search by ISBN to confirm current availability · Digital book purchase optional