Matthias Beggiato, Cornelia Hollander, Stephan Enhuber, Klaus Moessner, Georg Jahn (2024). Typology of Behavioral and Emotional Reactions to Uncomfortable Automated Driving Operations. In: Advances in Human Factors of Transportation. AHFE Open Access, vol. 148, pp. 139–149. https://doi.org/10.54941/ahfe1005204
Driving comfort is considered one of the core factors for broad public acceptance of automated driving. Monitoring emotional and behavioral reactions to potentially uncomfortable automated driving maneuvers could allow for early interventions to avoid discomfort, e.g. by adapting the automated driving style or information presentation. In a driving simulator study, 74 participants balanced in gender and age (51% male, 19 to 75 years) were instructed to answer emails on a laptop placed at the center console during a highly automated drive. After several kilometers, they experienced a rather fast and uncomfortable approach to a stationary truck at the rear end of a traffic jam. Behavioral (take-over, glances, interruption of laptop work) as well as emotional reactions (facial expression analysis using Visage FaceTrack and FaceAnalysis v9.0) were assessed 200m before reaching the end of the traffic jam and compared to a 200m baseline. To consider individual differences, a clustering approach was applied, resulting in a typology of five reaction patterns. Cluster 1 (“not noticed”, 9%) did not interrupt the laptop work and showed no glances ahead to the approach situation. Cluster 2 (“quick check”, 15%) interrupted the laptop work only briefly but did not take the hands off the keyboard, quickly checked the situation (9.5% glance time ahead) and showed a small average peak increase in the emotion “surprise” of 4.8% compared to the baseline. Cluster 3 (“observation”, 30%) interrupted the laptop work by removing the hands from the keyboard, observed the situation (20.6% glance time ahead) and showed an increase in average peak surprise by 9.7%. Cluster 4 (“quick take-over”, 31%) observed the situation (45.1% glance time ahead), interrupted the laptop work by grasping the steering wheel, started braking rather quickly at the last moments of the approach and showed an increase in average peak surprise by 9.2%. Cluster 5 (“planned take-over”, 15%) observed the situation intensively already at a very early stage (64.3% glance time ahead), resumed manual control in a planned manner and showed little increase in average peak surprise by 3.8%. To conclude, behavioral and emotional reactions to an identical uncomfortable automated approach maneuver differ considerably between participants. Thus, information and prevention strategies to avoid discomfort cannot be designed as a one-fits-all solution, but need to be tailored to the actual state and behavior of each driver.
Driving comfort is considered one of the core factors for broad public accep- tance of automated driving, enabling new opportunities such as relaxation, work, and entertainment (ERTRAC, 2022). Next to traditional comfort aspects such as noise, vibrations, or sitting comfort, new and additional deter- minants are discussed in automated driving such as apparent safety, trust in the system, motion sickness, feeling of control, familiarity of driving maneu- vers as well as information about system states and actions (Beggiato et al., 2020). As these new comfort aspects are primarily related to specific and dynamic situations, continuous evaluation of perceived comfort is advisable. Based on this evaluation by driver monitoring, arising discomfort could be avoided by adapting automation features such as the driving style (e.g., speed, lateral distance, distance to vehicle ahead) or information presentation. The basic principle of such comfort-adaptive automation is the idea of a coac- tive vehicle-driver-team that knows each other’s strengths, limitations, and current states and can react accordingly (Jahn, 2024). Discomfort or unex- pected automated system behavior can also trigger unnecessary interventions by the driver (e.g., if apparent safety is perceived as compromised) lead- ing to potentially safety-critical take-over situations (Hergeth et al., 2016). Hence, knowledge about drivers’ comfort could also allow for prevent- ing disengagement of automation or dangerous and unnecessary take-over situations.
A promising source for continuous comfort evaluation is the analysis of facial expressions. For decades, decoding emotional states from facial expres- sions has been a research interest in psychology (Ekman & Friesen, 2003). Recent technological developments in automated emotion detection based on video processing and machine learning (Geiger & Wilhelm, 2023) make facial expression analysis attractive as an in-vehicle driver state sensor for automated vehicles. Most of these computerized techniques aim at identify- ing facial Action Units (AUs), which represent movements of an individual face muscle or muscle group (Ekman & Friesen, 2003). Prior research on changes in AUs associated with uncomfortable automated driving maneu- vers during close approach situations showed a reaction of surprise, visual attention, and tension (Beggiato et al., 2022). Both eyes were kept open and eye blinks were reduced (visual attention), raising the inner brows in associ- ation with the upper lid are considered essential parts in all prototypes and major variants of the emotion surprise and lip pressing as well as lip stretching indicated tension. However, individual differences in the quality and quan- tity of facial expressions complicate the establishment of a direct relationship between AU changes and distinct driver states. Thus, recent works aim at identifying groups/clusters of facial expressivity and relate them to personal characteristics, thereby considering individual differences (Borowsky et al., 2020; Bosch et al., 2023). The present driving simulator study aims at identifying clusters of emotional and behavioral reactions to an uncomfortable automated close approach situation. This approach situation was selected due to several rea- sons: First, keeping short distances is one of the most mentioned causes
Typology of Behavioral and Emotional Reactions 141
for discomfort when driving as a co-driver (Beggiato et al., 2019). Second, maintaining a comfortable distance to vehicles driving ahead is already rel- evant for existing assistance systems and partial automation. Finally, the results can directly be compared with previous studies using this maneu- ver. A special focus of this study is on the potential and added value of directly analyzing emotional states (surprise) instead of AUs out of the Vis- age FaceTrack and FaceAnalysis software in version 9.0. One major aim of the Human Factors part in the current German research initiative STADT:up (https://www.stadtup-online.de/) is to develop a real-time capable vehicle demonstrator of an emotional-state-aware automated driving system. Thus, this research aims at identifying the potential of emotional state detection, i.e., types of relevant emotions, thresholds, and analytical approaches for data processing. Based on the knowledge about the importance of individual differences, these analyses are placed in the context of a clustering approach, resulting in a typology of behavioral and emotional reactions.
METHOD
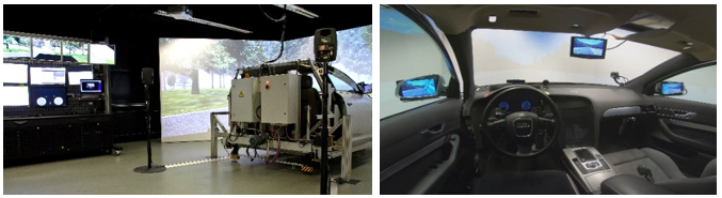
Driving simulator study design. The driving simulator study took place in a fixed-base driving simulator (SILAB 7.0 Software) with a fully equipped interior and a 180
horizontal field of view (Figure 1). Data collection was conducted in the framework of the EU-project MEDIATOR (https://mediator project.eu/). The participants experienced in total four different conditions of the same driving scenario in a fixed order – drive 1 was manual, drives 2 to 4 were automated. The driving scenario consisted of a highway with two lanes in each direction, an average driving speed of approx. 80 km/h, moderate surrounding traffic that did not provoke overtaking maneuvers, and good weather (clear view, blue sky). In all conditions, drivers started in manual driving mode at a rest stop and, afterwards, drove in either manual mode or switched to an automated driving mode.
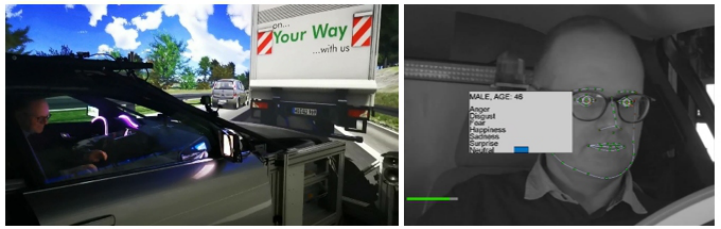
After 4km, the participants approached a stationary white truck at the rear end of a traffic jam caused by a construction zone (Figure 2). In drive 3, the automated vehicle approached the truck smoothly, i.e., slowed down well in advance and kept enough distance. In drive 4, the same automated approach situation was programmed differently to provoke discomfort. Automated braking started relatively late at a distance of 30m with a rather strong decel- eration from 60 km/h to 0 km/h in 4.75s, resulting in a minimum time to contact (TTC) of 0.84s until standstill at a distance of 3m behind the truck (Figure 2). In both highly automated drives 3 and 4 (SAE level 3), the par- ticipants were instructed to read and answer a longer email presented at a laptop mounted in front of the center console. Even though the automa- tion was always able to handle the situation, drivers had the opportunity to take over manual control (i.e., brake or steer), leading to an immediate disengagement of the automated driving mode. The interior was equipped with an innovative Human-Machine Interface including time budget infor- mation, LED-strips showing the automation mode and availability as well as proactive proposals from the automation system (for more details see https://mediatorproject.eu/).
The 200m section of drive 4 before the stop behind the truck was analyzed using video data capturing the drivers face and behavior (Figure 2). A road stretch of 200m located 3km before the traffic jam served as baseline for comparing emotional reactions within each person.
Figure 1: Driving simulator at Chemnitz University of Technology.
Participants. A sample of 74 participants was recruited for the study, balanced in gender (51% male) and age (19 to 75 years; M=40 years, SD=17). All participants held a valid driver’s license (M=21 years, SD=15). The annual mileage ranged from 1,000 to 60,000 km with an average of M=14,000 km (SD=11,300). All participants gave written informed consent in accordance with the regulations and consent templates of the TU Chem- nitz Ethics Commission (Approval No. 101518732) and were compensated with 25 Euro for participation.
Questionnaires. Several questionnaires on personality traits and attitudes were administered before and after all drives. For convenience and better comparability, all questionnaire scores were transformed into percentages. The personality trait “affinity for technology interaction” (ATI, Franke et al., 2017) revealed a relatively high average affinity for technology of M=69% (SD=17) in the sample. Before the first drive, participants were prompted to state their general opinion about vehicle automation by “What is your general opinion about functions in the vehicle that can automate parts or the entire driving task?”. Answers could range from “1 – very negative” to “5 – very positive”. On average (M=77%, SD=23), participants were fairly positive towards vehicle automation. To additionally assess the general atti- tude on vehicle automation in more detail, the SUaaVE questionnaire (Post et al., 2020) was administered before the first drive. Participants rated several statements on a 7-point Likert scale ranging from “1 - completely disagree”to “7 – completely agree”. The SUaaVE subscales revealed relatively high initial acceptability (M=82%, SD=16), perceived safety (M=66%, SD=19) and convenience (M=67%, SD=19). Trust in automation (Jian et al., 2000) was assessed before the first and after the fourth drive. Initial trust was already above the mean with M=62% (SD=12) and increased in the whole sample to M=75% (SD=15) after drive four. Acceptance of automation was assessed at the beginning and the end of the study by the Van der Laan acceptance scale (VdL; Van der Laan et al., 1997). Initial acceptance ranged quite high at M=74% (SD=12) and reached M=76% (SD=21) after the fourth drive.
Typology of Behavioral and Emotional Reactions 143
Video cameras and emotion analysis. The driver’s face was captured by several video cameras from different perspectives. For the emotion analyses, the grayscale image (1024 × 768 pixel, 30 frames per second) of a high-end automotive grade camera Blackfly S USB3 from the manufacturer FLIR was used (Figure 2). Glances were annotated manually for the 200m before the traffic jam using four areas of interest (ahead, laptop, HMI, other). For these analyses, the number of fixations as well as the total time in % for “ahead” were calculated as a measure of visual attention on the driving scenario.
The analysis of facial expressions was performed by the Visage FaceTrack and FaceAnalysis SDK v9.0 for Windows (http://visagetechnologies.com/). The software reports values from 0 to 100 for six basic emotions (Anger, Disgust, Fear, Sadness, Happiness, Surprise) as well as a seventh category “Neutral” (Figure 2). Emotions were only considered when looking ahead (and not to the laptop), as the emotional reaction to the automated maneu- ver was of interest. A first step consisted in the inspection of all emotion values in the 200m of the close approach as well as the 200m baseline section 3km before the traffic jam. Several features were calculated per person for all emotions and both driving sections including the average, the peak value, the difference in averages between both sections, the difference of the peak val- ues between both sections as well as the difference of the peak value during the approach compared to the average during the baseline. No other basic emotions except of “surprise” showed particular situation-specific changes, therefore only surprise was analyzed in further detail.
Figure 2: Standstill after the automated approach at a distance of 3m behind the truck (left) and emotion analysis by the Visage FaceTrack and FaceAnalysis SDK v9.0 (right).
RESULTS
The reactions of the participants during the 200m of approach were clustered into five groups (Table 1) using these three indicators: 1) If manual control was resumed by a take-over using the brake pedal or the steering wheel and if the take-over was rather unplanned and last-minute (“quick take-over”) or planned at an early stage of the approach (“planned take-over”). 2) If the work on the laptop was interrupted by taking the hands off the keyboard. 3) If there were glances ahead towards the driving situation. All other features regarding emotional reactions (surprise), demographics, personality traits, and attitudes were analyzed for these five clusters and are
reported in Table 1. Groups one to three (54%, n = 40) did not take over manual control, whereas groups four and five (46%, n = 34) resumed manual driving control. Between-group comparisons showed statistically significant differences in the clustering variables take-over (χ2(4, N = 74)=74.00, p<.001), interruption of laptop work (χ2(4, N = 74)=64.54, p<.001), num- ber of fixations ahead (F(4, 69)=16.59, p<.001) as well as the percentage of glance time ahead (F(4, 69)=17.26, p<.001). Regarding demographics, per- sonality traits and attitudes, initial trust (F(4, 69)=2.51, p=0.049) as well as final trust (F(4, 69)=8.71, p<.001), final acceptance (F(4, 69)=6.52, p< .001) and perceived safety (F(4, 69)=2.9, p=.024) differed significantly between the groups.
Table 1. Cluster characteristics.
Table available in the original PDF paper.
Feature CL1 not noticed
CL2 quick check
CL3 obser- vation
CL4 quick take-over
CL5 planned take-over
N (total 74) %
7 9.4% 11 14.9% 22 29.7% 23 31.1% 11 14.9%
Take-over *** No No No Yes Yes Stop laptop work *** No No Yes Yes Yes
Glances “ahead” % of time (M/SD) *** 0.0% 0.0 9.5% 5.8 20.6% 18.8 45.1% 30.3 64.3% 17.3 Number of fixations “ahead” (M/SD) *** 0.0 0.0 1.2 0.4 1.4 0.8 2.2 1.5 4.4 2.1
Between cluster comparison: * p <.05, ** p <.01, *** p <.001
Cluster 1 (“not noticed”) did not interrupt the laptop work at any moment of the approach and showed no glances ahead on the approach situation. Thus, no emotion values were calculated. Regarding demographics, person- ality traits, and attitudes, this cluster consisted of the highest proportion of females and showed the most positive initial attitude towards automation as well as the highest initial acceptability ratings. Initial trust and accep- tance were rather low compared to the other groups, however, final trust a well as final acceptance increased to the highest values. Thus, cluster 1 showed the steepest incline in positive attitudes towards automation as well as corresponding high reliance behavior.
Cluster 2 (“quick check”) interrupted the laptop work only briefly but did not take the hands off the keyboard. They quickly checked the situation (on average 1.2 fixations; 9.5% glance time ahead) and showed a small aver- age peak increase in the surprise emotion of 4.8% compared to the baseline. The average absolute maximum during the approach situation was 8.2%. This cluster showed the highest initial values for trust, acceptance, perceived safety, and convenience. Final trust and acceptance ended up as second high- est scores of all clusters. Thus, the cluster showed a positive development of attitudes (from rather high starting values), little emotional reactions, and quite high reliance on automation with only quick visual checks of the maneuver.
Cluster 3 (“observation”) interrupted the laptop work by removing the hands from the keyboard and observed the situation (on average 1.4 fixa- tions; 20.6% glance time ahead). They showed the highest increase in average peak surprise by 9.7% compared to the baseline as well as the highest aver- age absolute maximum of 13.8% during the approach. Cluster 3 forms the youngest group with the least driving experience in km/year. The initial opin- ion about automation was the lowest of all clusters. Initial as well as final trust and acceptance ranged in the middle of all clusters, the same holds true for initial acceptability, perceived safety, and convenience. To sum up, cluster 3 showed most emotional surprise reactions by observing the situation with- out manual intervention. Initial skepticism about automation changed to a slightly more positive attitude without reaching real enthusiasm.
Cluster 4 (“quick take-over”) as the largest group (31%) observed the situ- ation (on average 1.2 fixations; 45.1% glance time ahead) and interrupted the laptop work by grasping the steering wheel. They took over manual driving control by pressing the brake pedal on rather short-term at the last moments of the approach. Some take-over actions appeared to be rather critical resem- bling a panic reaction, even leading in one case to a rear-end crash by pressing the brake and accelerator pedal simultaneously shortly before reaching the truck. The cluster showed the second most increase in average peak surprise by 9.2% compared to the baseline with an average absolute maximum of 12.0% during the approach. The group had the highest driving experience in km/year and the lowest affinity for technology interaction. Initial as well as final trust and acceptance, perceived safety, and convenience were the lowest of all clusters, showing even a decrease in acceptance over time. This already skeptical cluster experienced the automated close approach as rather critical with intense emotional surprise reactions and corresponding unplanned and last-minute take-over behavior.
Cluster 5 (“planned take-over”) observed the situation intensively already at a very early stage (on average 4.4 fixations; 64.3% glance time ahead). They stopped working on the laptop and resumed manual driving control in a planned manner already at a very early stage. The cluster showed little increase in average peak surprise by 3.8% compared to the baseline with an average absolute maximum of 8.0% during the approach. Cluster 5 consisted of most males (82%) with the highest affinity for technology interaction of all clusters. Initial acceptability was the lowest of all clusters, initial as well as final trust and acceptance the second lowest with a small decrease in final acceptance compared to the start. Initial perceived safety, convenience, and the general attitude towards automation ranged approximately in the middle of all clusters. This cluster adopted a different behavioral strategy than the other groups by applying a controlled and early take-over already before getting in potentially risky time constraints. Initial skepticism was not really relieved by the automation experience.
DISCUSSION, LIMITATIONS, AND OUTLOOK The present driving simulator study aimed at identifying clusters of emotional and behavioral reactions to an uncomfortable automated close approach
Typology of Behavioral and Emotional Reactions 147
situation, with a special focus on the potential of emotional state detection based on facial expression analysis. Overall, behavioral and emotional reac- tions to an identical uncomfortable automated approach maneuver differed considerably between participants. Thus, information and prevention strate- gies to avoid discomfort need to be tailored to the actual state and behavior of the driver.
The clustering approach revealed the importance of initial expectations and attitudes towards automation. Individuals with rather high initial trust, acceptance, perceived safety, and convenience showed high reliance on automation with none or just few quick checks of the situation (clusters 1 and 2). On the other hand, individuals with higher initial skepticism towards automation showed lower reliance, even after experiencing a completely smooth approach in the previous drive 3. However, behavioral reactions connected to lower reliance differed in these groups. Even though all per- sons stopped the engagement in the non-driving related task and observed the situation, one group relied on automation and just observed (cluster 3), another group resumed manual driving control in a planned manner at an early stage (cluster 5), and the third group took over manual control in a rather unplanned (up to panic) manner (cluster 4). The latter cluster 4 could be considered as inclined to the most dangerous behavior due to a high prob- ability of unnecessary and potentially inappropriate interventions (Hergeth et al., 2016). Behavioral reactions and connected experiences do also show effects on the development of attitudes over time. Whereas high reliance led to a further increase of trust and acceptance, initially sceptic individuals (espe- cially with a negative experience of a quick intervention) showed no changes or even a decrease in trust and acceptance.
Emotional state detection showed potential for identifying discomfort at a rather early stage before a critical intervention. The emotion “surprise” turned out to be the most promising indicator, as already suggested by AU analyses in previous studies (Beggiato et al., 2022). However, the detection and analysis of emotions only makes sense if it is situation-related, i.e., when drivers look ahead on the road. Detecting surprise while looking on the smart- phone or the laptop could mainly be related to screen-content instead of driving and therefore lead to false alarms. Thus, if a non-driving related activ- ity such as work on a laptop or a smartphone is carried out, interruptions of these activities could be an even earlier (although unspecific) indicator of potential discomfort. An optimal suggested combination could be the combi- nation of both indicators, i.e., stop of non-driving related activities as trigger for emotional state detection based on facial expressions while observing automated driving operations. This strategy could avoid false alarms in clus- ter 5 with early and planned interventions as well as clusters 1 and 2, where no interventions would be indicated. For making this tailored approach suc- cessful, thresholds for the surprise emotion as well as analysis strategies are required. Based on the results of this study, an increase of about 5% in sur- prise compared to an individual baseline could form a starting threshold for interventions such as providing additional information or adapting the automated driving behavior.
Even though emotional state detection shows potential, some limitations need to be considered for future research and application. First, the close approach situation is just one of several potentially uncomfortable scenarios, even though distance regulation is considered a crucial factor for perceived comfort (Beggiato et al., 2019). Thus, the transferability needs to be validated for other situations. Second, even though the balanced sample of 74 partici- pants is rather large for a driving simulator study, it does probably not cover all potential behaviors and emotional reactions. Thus, the results need to be validated with new samples. Third, ethical and privacy aspects regarding video-based facial expression analysis need to be considered, such as potential biases against certain skin colors or gender, problems in non-ideal condi- tions as well as underlying assumptions of the specific theory of emotions on which the software is based (Cross et al., 2023). Fourth, the partly rather high variance in emotion features of Table 1 still indicates further individual differences in emotional reactions. A different clustering approach focusing just on magnitude and types of emotional responses (similar to Borowsky et al., 2020) could provide additional insights into individual characteristics and detection potential. Fifth, the results from the driving simulator need to be validated in real driving conditions, as environmental conditions such as vibrations, forces, and lighting conditions vary markedly (glare, sunlight, dark, contrasts, directional lighting…).
As an outlook, the mentioned limitations are taken up for subsequent driving simulator as well as on-road studies in the STADT:up project. The final aim is to develop and show a working prototype vehicle demonstra- tor, in which real-time monitoring of behavior and emotional states as well as prototypical interventions based on this information should provide an individually adapted pleasant automated driving experience.
ACKNOWLEDGMENT
The analysis of behavioral and emotional reactions is a result of the joint research project STADT:up (19A22006R). STADT:up is supported by the German Federal Ministry for Economic Affairs and Climate Action (BMWK), based on a decision of the German Bundestag. Data collection was funded by the European Union’s Horizon 2020 research and innovation program under grant agreement No. 814735 (Project MEDIATOR).
REFERENCES
Beggiato, M., Hartwich, F., Roßner, P., Dettmann, A., Enhuber, S., Pech, T., Gesmann-Nuissl, D., Mößner, K., Bullinger, A. C., & Krems, J. (2020). KomfoPilot - Comfortable Automated Driving. In G. Meixner (Ed.), Smart Auto- motive Mobility: Reliable Technology for the Mobile Human (pp. 71–154). Cham: Springer International Publishing. https://doi.org/10.1007/978-3-030- 45131-8_2 Beggiato, M., Rauh, N., & Krems, J. (2022). Multi-camera Face Tracking for Esti-
mating User’s Discomfort with Automated Vehicle Operations. In W. Karwowski et al. (Eds.), Proceedings of the 4th International Conference on Human Systems Engineering and Design (IHSED2021), 23–25. September 2021. https://doi.org/ 10.54941/ahfe1001104
Typology of Behavioral and Emotional Reactions 149
Beggiato, M., Hartwich, F., & Krems, J. (2019). Physiological correlates of discomfort in automated driving. Transportation Research Part F: Traffic Psychology and Behaviour, 66, 445–458. https://doi.org/10.1016/j.trf.2019.09.018 Bosch, E., Käthner, D., Jipp, M., Drewitz, U., & Ihme, K. (2023). Fifty shades
of frustration: Intra- and interindividual variances in expressing frustration. Transportation Research Part F: Traffic Psychology and Behaviour, 94, 436–452. Borowsky, A., Oron-Gilad, T., Chasidim, H., … & Christoph, M. (2020).
Behavioural Markers for Degraded Human Performance. Deliverable D1.2 from the H2020 project MEDIATOR. Retrieved from https://mediatorproject.eu/deliv erables. Cross, M. P., Acevedo, A. M., & Hunter, J. F. (2023). A Critique of Automated Approaches to Code Facial Expressions: What Do Researchers Need to Know? Affective Science, 4(3), 500–505. https://doi.org/10.1007/s42761-023-00195-0 Ekman, P., & Friesen, W. V. (2003). Unmasking the face: A guide to recognizing
emotions from facial clues. Cambridge (Mas.): Malor Books. ERTRAC. (2022). Connected, Cooperative and Automated Mobility Roadmap.
European Road Transport Research Advisory Council. Retrieved from https://www.ertrac.org/wp-content/uploads/2022/07/ERTRAC-CCAM- Roadmap-V10.pdf. Franke, T., Attig, C. & Wessel, D. (2019). A Personal Resource for Technology Interaction: Development and Validation of the Affinity for Technology Interac- tion (ATI) Scale. International Journal of Human–Computer Interaction, 35(6), 456–467. Geiger, M., & Wilhelm, O. (2023). Computerized Facial Emotion Expression Recog-
nition. In C. Montag & H. Baumeister (Eds.), Studies in Neuroscience, Psychology and Behavioral Economics. Digital Phenotyping and Mobile Sensing (pp. 43–56). Springer International Publishing. https://doi.org/10.1007/978-3-030-98546-2_4 Hergeth, S., Lorenz, L., & Krems, J. F. (2016). Prior Familiarization With Takeover Requests Affects Drivers’ Takeover Performance and Automation Trust. Human Factors: The Journal of the Human Factors and Ergonomics Society, 59(3), 457–470. Jahn, G. (2024). Resilience engineering for highly automated driving, autonomous
vehicles, and urban robotics: wizards and shepherds in hybrid societies. Theoreti- cal Issues in Ergonomics Science, 1–22. https://doi.org/10.1080/1463922X.2024. 2328062 Jian, J. Y., Bisantz, A. M., & Drury, C. G. (2000). Foundations for an empirically determined scale of trust in automated systems. International Journal of Cognitive Ergonomics, 4(1), 53–71. Post, J. M. M., Ünal, A. B., & Veldstra, J. L. (2020). Deliverable 1.2. Model and guidelines depicting key psychological factors that explain and promote public acceptability of CAV among different user groups. SUaaVE. Retrieved from http://www.suaave.eu/wp-content/uploads/sites/17/2021/02/SUaa VE_WP1_D1.2_20200930_V100.pdf. Van der Laan, J. D., Heino, A., & De Waard, D. (1997). A simple procedure for
the assessment of acceptance of advanced transport telematics. Transportation research. Part C, Emerging technologies, 5(1), 1–10. http://www.hfes-europe.org/ accept/accept.htm
LISTED IN THE AHFE DIGITAL BOOKSTORE CATALOGUE
Explore the complete digital volume
Advances in Human Factors of Transportation
Read this individual research paper free through the original publisher, or explore the full digital proceedings book.
ISBN 978-1-964867-24-3
Explore this ISBN in the AHFE Bookstore ↗Listed in the July 2026 bookstore catalogue; search by ISBN to confirm current availability · Digital book purchase optional