Mark Ching-Pong Poo, Leila Kamalian, Zaili Yang, Yui-yip Lau (2024). Climate Threats and Resilience Assessment of Road and Railway Networks: Scenario Analysis for 2025, 2030, 2050. In: Human Systems Engineering and Design (IHSED2024): Future Trends and Applications. AHFE Open Access, vol. 158, pp. 363–371. https://doi.org/10.54941/ahfe1005559
1 Liverpool Hope Business School, Liverpool Hope University, UK ↗
2 Liverpool Logistics, Offshore and Marine Research Institute, Liverpool John Moores, University, UK ↗
3 Division of Business and Hospitality Management, College of Professional and Continuing Education, The Hong Kong Polytechnic University, Hong Kong Special Administrative Region ↗
Road and railway networks are significantly impacted by climate change, facing various climate extremes on different scales (de Miranda Pinto et al., 2018, Hooper and Chapman, 2012, Nemry and Demirel, 2012)Forecasting the future impacts on these essential transport and logistics links, vital for human lives, goes beyond likelihood and risk severity. Resilience, a key factor, is evaluated uniquely in this study. We employ Bayesian network analysis to assess the strength of road and railway systems in relation to various climate-induced threats under changing climatic conditions. (Zhou et al., 2017). This research model explicitly impacts road networks for 2025, 2030, and 2050 by analysing the likelihood of occurrences, the extent of damage, and overall resilience.Understanding the urgency of these impacts is essential for proactive planning and policymaking. This study, with its comprehensive framework that integrates various factors influencing the resilience of transportation networks, is a proactive step. It highlights the importance of incorporating resilience assessments into infrastructure planning and management, which will help mitigate potential disruptions and ensure the continued functionality and reliability of transport networks in the face of climate change.
Road and railway networks are significantly impacted by climate change, facing various climate extremes on different scales (de Miranda Pinto et al., 2018; Hooper and Chapman, 2012; Nemry and Demirel, 2012). Forecasting the future impacts on these essential transport and logistics links, vital for human lives, goes beyond likelihood and risk severity. Resilience, a key factor, is evaluated uniquely in this study. We employ Bayesian network analysis to
assess the strength of road and railway systems in relation to various climate- induced threats under changing climatic conditions (Zhou et al., 2017). This research model explicitly impacts road networks for 2025, 2030, and 2050 by analysing the likelihood of occurrences, the extent of damage, and overall resilience.
Understanding the urgency of these impacts is essential for proactive planning and policymaking. This study, with its comprehensive framework that integrates various factors influencing the resilience of transportation networks, is a proactive step. It highlights the importance of incorporating resilience assessments into infrastructure planning and management, which will help mitigate potential disruptions and ensure the continued functionality and reliability of transport networks in the face of climate change.
METHODOLOGY
Background
Building upon the previous study’s methodology for analysing climate change impacts on the UK’s road transportation and rail transportation, this revised approach aims to assess further the trends in climate change and the development of adaptation measures (Wang et al., 2019; 2020). The methodology will now incorporate an advanced assessment of the road network’s resilience by adding three new sub-items: resilience capacity, the length of disruption period, and recovery cost.
The study will continue to employ the Fuzzy Bayesian Reasoning (FBR) model to evaluate the uncertainty-laden climate risks within road transport networks and rail transport, enhancing the understanding of the potential temporal distribution of climate threats, their likelihood, and the severity of their consequences (Yang et al., 2008). The expansion to a multi-tier risk evaluation framework allows for a more nuanced assessment of the severity of implications by including economic loss, environmental damage, and human casualties as distinct sub-attributes (Yang et al., 2018).
Incorporating new dimensions of resilience into the assessment framework, this study meticulously evaluates the robustness and adaptability of the road and rail network’s resilience capacity, focusing on structural and functional durability in the face of climate-induced disruptions (Manyena, 2006). Furthermore, it examines the length of the disruption period to gauge the impact of climate events on the network’s operational efficacy and continuity (Baghersad and Zobel, 2022). Additionally, it quantifies the cost of recovery, forecasting the financial requirements necessary for the network’s post-event recovery and restoration (Dormady et al., 2022). These integrated resilience aspects provide a more holistic understanding of the network’s ability to cope with and recover from climate threats, informing strategic adaptation planning for a sustainable transportation future.
This methodology will enable a comprehensive and dynamic understanding of the road and rail network’s resilience against climate change. It aims to guide policymakers and planners in the road and rail sectors by providing actionable insights and adaptation plans for the related
Climate Threats and Resilience Assessment of Road and Railway Networks 365
road and rail shareholders. This approach ensures that both current resilience and future adaptation planning are addressed with a clear understanding of economic, environmental, and social impacts, leading to sustainable and resilient road and rail transport systems.
Key Framework This paper introduces a new approach to improving how transportation systems deal with climate change. It outlines a framework that focuses on understanding and managing these risks through four main steps:
Identify potential climate threats to transportation systems.
Assess the risks (for the year 2025) these threats pose to transportation systems.
Predict the future (years 2030 and 2050) changes and impacts of these threats on transportation systems.
Analyse the factors that affect these risks, such as geographic location, different types of transportation, and the roles of operators, looking ahead to the years 2025, 2030, and 2050.
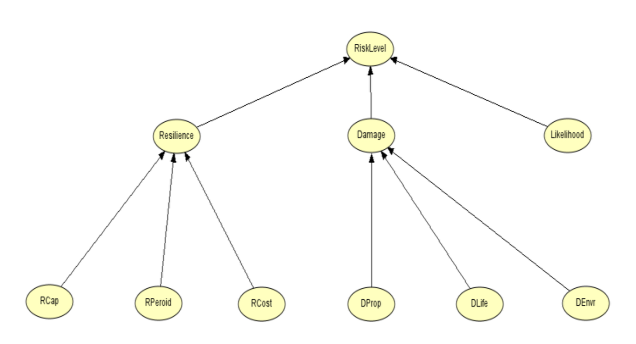
The Flow of the Study Beginning in May 2023, questionnaires will be circulated among professional networks linked to road and rail networks. The data collected from these questionnaires will be used to build an FBR model. This model will consist of several components: “likelihood,” “damages to property,” “injuries and loss of lives,” “damages to the environment,” “resilience capacity,” “length of disruption period,” and “cost of recovery.” Additionally, the model includes two pivotal connecting components, “damage” and “resilience,” which integrate all the other components to assess the overall “climate risk” levels, as illustrated in Figure 1.
Figure 1: The structure of FBR model for climate resilience.
This paper develops a three-layer hierarchy to model new CSC climate risk assessment parameters. They include a single parameter on the top layer, namely Climate Risk Level (RiskLevel), which is influenced by related sources (Yang et al., 2018; Wang et al., 2019; 2020). A few parameters are added for a more comprehensive resilience analysis, timeframe (T) is removed from the network, and three scenarios will be run in the experiment sections. Damage to property (DProp), Injuries and loss of lives (DLife), and Damage to environment (DEnvir) are used to evaluate the damage. Resilience capacity (Rcap), Length of disruption (RPeriod) and Cost of recovery (RCost) are used to assess resilience. Then, damage, resilience and likelihood are used to assess RiskLevel. Then, it is noticed that all three gates (resilience, damage and RiskLevel) have three parameters. They include 15 (5 + 5 + 5) linguistic variables assembled to generate 125 (5 × 5 × 5) antecedents.
The impacts of climate change are measured across seven parameters for three different scenarios (2025, 2030, and 2050). These parameters include damaging cyclones, sea-level rise, warming trends/extreme temperature/drought, heavy precipitation, snow cover/frost cover, seasonal changes in fog events, and seasonal changes in wind speed and direction. This results in a total of 21 cases (7 parameters x 3 scenarios). To quantify the RiskLevel, values are assigned to each linguistic variable as follows: Very High (Grade 5 = 1), High (0.75), Medium (Grade 3 = 0.5), Low (Grade 2 = 0.25), and Very Low (Grade 1 = 0).
This structured approach allows for a detailed analysis of the potential impacts on road networks, enabling a comprehensive assessment of future risks. By assigning numerical values to qualitative risk assessments, this method facilitates more precise modelling and comparison of different climate scenarios.
RESULT
The findings, generated from the expertise of seven road experts and fourteen rail experts, highlight the superior resilience of rail networks, attributed to their robust construction and centralized management, compared to road networks that are more vulnerable to extreme weather conditions like flooding and heat damage.
From 2025 to 2030, the impact of damaging cyclones on road networks saw a significant increase, with the risk level rising from 0.4801 to 0.5596. Sea-level rise also showed a notable increase from 0.5602 to 0.6675, indicating a growing concern. The impact of warming trends/extreme temperatures/drought increased from 0.5583 to 0.6075. In contrast, heavy precipitation saw a slight decrease from 0.5315 to 0.5305. There was a significant decrease in the impact of snow cover/frost cover from 0.4155 to 0.3707, and seasonal changes of fog events decreased markedly from 0.2801 to 0.3313. Seasonal changes to wind speed and direction also decreased slightly from 0.3625 to 0.3908.
Climate Threats and Resilience Assessment of Road and Railway Networks 367
Table 1. Linguistic terms of all variables in the FBR model.
5 Very High Very High Catastrophic Very Low Catastrophic Catastrophic Catastrophic Very Weak Very Long Catastrophic
4 High High Critical Low Critical Critical Critical Weak Long Critical
3 Medium Medium Major Medium Major Major Major Average Average Major
2 Low Low Minor High Minor Minor Minor Strong Short Minor
1 Very Low Very Low Negligible Very High Negligible Negligible Negligible Very Strong Very Short Negligible
Table 2. RiskLevel of road networks.
Table available in the original PDF paper.
Year RiskLevel Damaging cyclone
Sea-level rise
Heavy precipitation
Snow cover/ Frost cover
Seasonal changes of fog events
Warming trend/ Extreme temperature/ Drought
Seasonal changes to wind speed and direction 2025 VL 19.05% 26.85% 27.70% 17.20% 1.59% 0.00% 0.00% L 22.22% 26.85% 19.13% 24.87% 18.73% 6.98% 19.64% M 14.29% 10.58% 15.32% 22.35% 37.30% 26.98% 28.74% H 20.63% 14.95% 24.48% 24.47% 29.05% 37.14% 28.61% VH 23.81% 20.77% 13.37% 11.11% 13.33% 28.89% 23.00% Final value 0.4801 0.5602 0.5583 0.5315 0.4155 0.2801 0.3625
2030 VL 31.55% 40.87% 34.44% 11.64% 4.76% 3.17% 3.17% L 15.28% 23.48% 15.87% 27.78% 18.10% 13.89% 21.16% M 12.10% 14.35% 10.91% 24.87% 16.51% 17.06% 25.66% H 27.58% 4.37% 35.79% 32.54% 41.90% 44.05% 28.84% VH 13.49% 16.93% 2.98% 3.17% 18.73% 21.83% 21.16% Final value 0.5596 0.6675 0.6075 0.5305 0.3707 0.3313 0.3908 2050 VL 46.03% 53.17% 48.68% 29.10% 10.16% 10.16% 6.35% L 1.59% 14.55% 9.52% 27.25% 26.03% 26.03% 29.10% M 6.35% 12.70% 19.31% 14.55% 11.11% 11.11% 24.07% H 31.75% 8.47% 20.90% 27.51% 35.56% 35.56% 22.49% VH 14.29% 11.11% 1.59% 1.59% 17.14% 17.14% 17.99% Final value 0.5834 0.7255 0.7070 0.6369 0.4413 0.4413 0.4583
Between 2030 and 2050, the impact of damaging cyclones on roads continued to rise, increasing from 0.5596 to 0.5834. Sea-level rise showed a substantial increase from 0.6675 to 0.7255. The impact of warming trends/extreme temperatures/drought rose significantly from 0.6075 to 0.7070. Heavy precipitation’s impact increased from 0.5305 to 0.6369. The impact of snow cover/frost cover increased slightly from 0.3707 to 0.4413, and seasonal changes of fog events also increased from 0.3313 to 0.4413. The impact of seasonal changes to wind speed and direction showed an increase from 0.3908 to 0.4583.
For rail networks, the period from 2025 to 2030 saw a slight decrease in the impact of damaging cyclones, with the risk level dropping from 0.5240 to 0.5182. The effect of sea-level rise decreased from 0.5979 to 0.5618, and warming trends/extreme temperatures/drought also decreased from 0.5926 to 0.5702. Heavy precipitation’s impact was slightly reduced from 0.6041 to 0.5940. Conversely, the impact of snow cover/frost cover increased from 0.7016 to 0.7241. Seasonal changes of fog events showed a decrease from 0.7537 to 0.6859, and seasonal changes to wind speed and direction decreased from 0.6852 to 0.6568.
From 2030 to 2050, the impact of damaging cyclones on rail networks increased from 0.5182 to 0.5689. The impact of sea-level rise increased from 0.5618 to 0.5916. The influence of warming trends/extreme temperatures/drought decreased slightly from 0.5702 to 0.5543. Snow cover/frost cover impact decreased from 0.7241 to 0.6800. Seasonal changes of fog events showed a slight increase from 0.6859 to 0.6868, and the impact of seasonal changes to wind speed and direction decreased marginally from 0.6568 to 0.6551.
Climate Threats and Resilience Assessment of Road and Railway Networks 369
Table 3. RiskLevel of rail networks.
Table available in the original PDF paper.
Year RiskLevel Damaging cyclone
Sea-level rise
Heavy precipitation
Snow cover/ Frost cover
Seasonal changes of fog events
Warming trend/ Extreme temperature/ Drought
Seasonal changes to wind speed and direction 2025 VL 21.55% 17.86% 20.11% 23.41% 3.24% 5.56% 14.29% L 18.83% 23.28% 31.48% 21.56% 24.79% 13.10% 14.68% M 35.23% 24.74% 26.46% 34.92% 40.78% 39.29% 37.83% H 11.17% 25.13% 18.65% 17.59% 26.37% 37.96% 29.23% VH 13.68% 8.99% 3.31% 2.51% 4.82% 4.10% 3.97% Final value 0.5240 0.5979 0.5926 0.6041 0.7016 0.7537 0.6852
2030 VL 20.88% 23.54% 13.76% 19.44% 5.62% 4.10% 4.76% L 22.34% 25.66% 41.80% 39.55% 16.79% 9.66% 16.67% M 34.37% 24.21% 30.69% 25.00% 56.78% 42.72% 32.54% H 9.65% 19.31% 9.66% 16.01% 20.02% 30.69% 31.75% VH 12.76% 7.28% 4.10% 0.00% 0.79% 12.83% 14.29% Final value 0.5182 0.5618 0.5702 0.5940 0.7241 0.6859 0.6568 2050 VL 28.19% 34.43% 29.55% 35.92% 10.38% 11.24% 12.96% L 19.87% 17.52% 27.96% 26.31% 22.34% 11.24% 14.42% M 24.81% 21.61% 33.70% 29.66% 39.26% 26.72% 24.21% H 21.30% 25.58% 8.79% 7.14% 24.79% 40.21% 36.90% VH 5.82% 0.85% 0.00% 0.96% 3.24% 10.58% 11.51% Final value 0.5689 0.5916 0.5543 0.5152 0.6800 0.6868 0.6551
Both road and rail networks show an increasing trend in the impacts of sea-level rise over time, highlighting it as a significant concern for future infrastructure planning. Warming trends/extreme temperatures/drought continue to impact both networks, though with varying degrees of change. Seasonal changes in fog events show a general decrease from 2025 to 2030 for both networks, but increase again from 2030 to 2050, indicating fluctuating patterns.
However, there are notable differences between the two networks. For roads, heavy precipitation decreases from 2025 to 2030, followed by an increase till 2050. In contrast, rail networks experience a consistent decrease in the impact of heavy precipitation from 2025 to 2050. The effect of snow cover/frost cover on roads increases over time, whereas rails see a decrease from 2030 to 2050. Additionally, roads generally show an increasing impact of seasonal changes of fog events and wind speed and direction over time, while rails exhibit mixed trends with decreases in some periods.
CONCLUSION
This study provides critical insights into the differing resilience capacities of road and rail networks facing climate-induced threats. The findings highlight the superior resilience of rail networks, attributed to their robust construction and centralised management, compared to road networks that are more vulnerable to extreme weather conditions like flooding and heat damage.
From 2025 to 2030, road networks saw significant increases in the impact of damaging cyclones and sea-level rise, while warming trends/extreme temperatures/drought also posed an increasing threat. However, there was
a slight decrease in the impact of heavy precipitation, a marked reduction in snow cover/frost cover, and seasonal changes in fog events. Between 2030 and 2050, these impacts continued to rise, with substantial increases in sea-level rise and warming trends/extreme temperatures/drought. Heavy precipitation, snow cover/frost cover, and seasonal changes of fog events also showed an increasing impact.
For rail networks, the period from 2025 to 2030 saw a slight decrease in the impact of damaging cyclones, sea-level rise, and warming trends/extreme temperatures/drought. Heavy precipitation’s impact slightly decreased, while snow cover/frost cover impact increased. Seasonal changes in fog events and wind speed and direction also showed a decrease. From 2030 to 2050, the effect of damaging cyclones and sea-level rise on rail networks increased, while the impact of warming trends/extreme temperatures/drought and heavy precipitation decreased. The impact of snow cover/frost cover decreased, and seasonal changes in fog events and wind speed and direction showed mixed trends.
Both road and rail networks show an increasing trend in the impacts of sea-level rise over time, highlighting it as a significant concern for future infrastructure planning. Warming trends/extreme temperatures/drought continue to impact both networks, though with varying degrees of change. Seasonal changes in fog events show a general decrease from 2025 to 2030 for both networks, but increase again from 2030 to 2050, indicating fluctuating patterns.
However, there are notable differences between the two networks. For roads, heavy precipitation decreases from 2025 to 2030, followed by an increase till 2050. In contrast, rail networks experience a consistent decrease in the impact of heavy rainfall from 2025 to 2050. The effect of snow cover/frost cover on roads increases over time, whereas rails see a decrease from 2030 to 2050. Additionally, roads generally show an increasing impact of seasonal changes in fog events, wind speed, and direction over time, while rails exhibit mixed trends with decreases in some periods.
These results underscore the urgency for targeted infrastructure enhancements and strategic planning to bolster the weaker segments of transportation networks. Moving forward, this research will inform policymakers and planners in prioritising and implementing effective climate adaptation strategies, ensuring the sustainability and safety of transportation systems in the face of evolving climate challenges. Future updates will provide more detailed recommendations based on extended analysis and further data collection. This fundamental study may further develop other modes of transportation to conduct a comparative study in the following research study.
ACKNOWLEDGMENT
This project has received funding from the European Research Council (ERC) under the European Union’s Horizon 2020 research and innovation programme (Grant Agreement No. 864724) and internal funding from Liverpool Hope University.
Climate Threats and Resilience Assessment of Road and Railway Networks 371
REFERENCES
Baghersad, M. & Zobel, C. W. 2022. Organizational resilience to disruption risks: Developing metrics and testing effectiveness of operational strategies. Risk Analysis, 42, 561–579. De Miranda Pinto, J. T., Mistage, O., Bilotta, P. & Helmers, E. 2018. Road-
rail intermodal freight transport as a strategy for climate change mitigation. Environmental development, 25, 100–110. Dormady, N. C., Rose, A., Roa-Henriquez, A. & Morin, C. B. 2022. The cost-effectiveness of economic resilience. International Journal of Production Economics, 244, 108371. Hooper, E. & Chapman, L. 2012. Chapter 5 The Impacts of Climate Change on
National Road and Rail Networks. Transport and Climate Change. Emerald Group Publishing Limited. Manyena, S. B. 2006. The concept of resilience revisited. Disasters, 30, 434–450. Nemry, F. & Demirel, H. 2012. Impacts of Climate Change on Transport: A focus on road and rail transport infrastructures. European commission, joint research centre (JRC), institute for prospective technological studies (IPTS), 89. Wang, T., Qu, Z., Yang, Z., Nichol, T., Dimitriu, D., Clarke, G. & Bowden, D.
2019. How can the UK road system be adapted to the impacts posed by climate change? By creating a climate adaptation framework. Transportation Research Part D: Transport and Environment, 77, 403–424. Wang, T., Qu, Z., Yang, Z., Nichol, T., Dimitriu, D., Clarke, G., Bowden, D.
& Lee, P. T. 2020. Impact analysis of climate change on rail systems for adaptation planning: A UK case. Transportation Research Part D: Transport and Environment, 83, 102324. Yang, Z., Bonsall, S. & Wang, J. 2008. Fuzzy rule-based Bayesian reasoning approach for prioritization of failures in FMEA. IEEE Transactions on Reliability, 57, 517–528. Yang, Z., Ng, A. K., Lee, P. T.-W., Wang, T., Qu, Z., Rodrigues, V. S., Pettit, S.,
Harris, I., Zhang, D. & Lau, Y.-Y. 2018. Risk and cost evaluation of port adaptation measures to climate change impacts. Transportation Research Part D: Transport and Environment, 61, 444–458. Zhou, M., Wang, D., Li, Q., Yue, Y., Tu, W. & Cao, R. 2017. Impacts of weather on public transport ridership: Results from mining data from different sources. Transportation research part C: emerging technologies, 75, 17–29.
LISTED IN THE AHFE DIGITAL BOOKSTORE CATALOGUE
Explore the complete digital volume
Human Systems Engineering and Design (IHSED2024): Future Trends and Applications
Read this individual research paper free through the original publisher, or explore the full digital proceedings book.
ISBN 978-1-964867-34-2
Explore this ISBN in the AHFE Bookstore ↗Listed in the July 2026 bookstore catalogue; search by ISBN to confirm current availability · Digital book purchase optional