Peixuan Wang, Qiong Zhang, Xueqin Li, Tao Zhang, Yuanyuan Liu (2024). Exploring Cross-Sensory Perception: the Correlation of Visual and Tactile Sensations in Home Product Materials. In: Interdisciplinary Practice in Industrial Design. AHFE Open Access, vol. 144, pp. 90–100. https://doi.org/10.54941/ahfe1005121
This research investigates the interconnection between visual and tactile perceptions through the lens of household product materials. By focusing on common materials used in these products, the study aims to investigate the correlation between the tactile and visual perception of materials. An experiment was conducted to explore the cross-sensory correlation between vision and touch. Using a controlled variable method, the material samples were divided into three categories based on differences in roughness, hardness and type. Twenty-one participants engaged with these materials through blind tactile sensation and subsequently described their concurrent visual experience via a questionnaire. The questionnaire evaluated visual perceptions in terms of style features, physical properties, and functional characteristics. Findings indicate tactile properties of materials influence visual perceptions among users. Specifically, materials with higher levels of roughness are perceived as visually complex, darker, and heavier, suggesting reliability, while smoother materials are associated with a more transparent and clean visual impression. Harder materials are typically viewed as brighter, heavier and cleaner. Regarding material type, both acrylic and mirror-finished metal are more likely to evoke “bright” visual experiences, with mirror-finished metals also perceived as "heavier" compared to acrylic and frosted metals. These insights provide valuable guidance for product designers, suggesting that materials selection can enhance user experiences by aligning tactile feedback with visual expectations.
In daily life, we interact with many different materials that evoke diverse sensations, with over 70% of these sensations being obtained through vision (Ludden et al., 2009). In home settings, touch serves as another important means of acquiring sensory information during product interaction. This study focuses on typical materials used in home products such as TPU, PVC, leather, acrylic, and metal, aiming to explore the connection between the visual and tactile sensations these materials evoke in users, that is,
Exploring Cross-Sensory Perception: The Correlation of Visual and Tactile Sensations 91
cross-sensory perception (Li et al., 2017). The goal is to offer insights to prod- uct designers on material selection to create products that provide a more enriching sensory experience.
Researchers have extensively organized and defined the concepts sur- rounding sensory perception. Multi-sensory perception is described as any neural or behavioral process that involves multiple senses (Lloyd et al., 2020), and another definition highlights it as the internal neural and behavioral responses triggered by stimulating multiple senses (Stein et al., 2010). Essen- tially, cross-sensory perception involves using one sense to comprehend and identify information acquired through another sense. This paper explores the types of visual information that can be perceived through various tactile sensations.
There has been significant experimental research on cross-sensory per- ception. Steer et al. (2023) investigated the cross-modal correspondences of deformable interfaces, enabling participants to perceive colors and shapes by touching materials of varying hardness. Zuo et al. (2016) explored users’ per- ception of different materials and textures on hair dryer handles to suggest product improvements. Tang et al. (2017) developed a method for industrial design material testing and evaluation based on users’ visual and tactile expe- riences, creating a system for testing user visual and tactile experiences. Gui et al. (2021) studied the application of cross-sensory elements in children’s toy packaging.
Therefore, the aim of this paper is to investigate the correlation between visual and tactile perceptions of different materials in a home setting. Two research questions are raised in response to the research goals: i) What visual experiences do people have when using touch to perceive materials with varying physical properties? ii) Why do certain tactile experiences evoke specific visual associations?
METHODS
As shown in Figure 1, the research was divided into three steps: i) Prepa- ration; ii) Experiment, and iii) Analysis. During the Preparation phase, a variety of typical home products were collected to analyze and summarize their perceptual experiences. From this analysis, we selected materials for the experiment and identified appropriate vocabulary for evaluating visual per- ception. The Experiment phase involved conducting experiments to explore the correlation between visual and tactile perceptions. Finally, the Analysis phase consisted of both data and qualitative analysis of the experimental results.
Sections 3, 4, and 5 of this paper will detail these research methods.
Procedure To better understand the types and characteristics of materials in common home products, we collected a wide range of these products. We then sum- marized their main interaction points, prevalent materials, and aspects of perceptual experience research.
Results We selected six common household products for analysis, including sweep- ing robots, washing machines, refrigerators, smart toilet seats, smartwatches and telephones, as shown in Table 1. We sorted out the materials used in these products, noting the colors and textures of each part, and summarized keywords for perceptual experience research. This informed the subsequent selection of vocabulary for visual evaluation.
Matte, frosted Cold-warm, light- heavy, clean- unclean, traditional- modern
Shell: plastic, metal Handle: plastic, rubber Button: plastic, metal, rubber
Selecting Materials for Experiment Procedure Based on the materials in Table 1, we created samples and measured their roughness and hardness (Figure 2). Each material underwent three
Exploring Cross-Sensory Perception: The Correlation of Visual and Tactile Sensations 93
measurements, with the average value taken after excluding significantly deviant data. The results are shown in Tables 2 and 3. We classified rough- ness and hardness into three categories - low, medium, and high - based on these measurement results (see Table 4), ensuring minimal tactile differences within each category. The hardness units were standardized to Ha.
Figure 2: Measuring roughness and hardness.
Figure available in the original PDF paper.
Table 2. Roughness measurement results (unit: Ra in um).
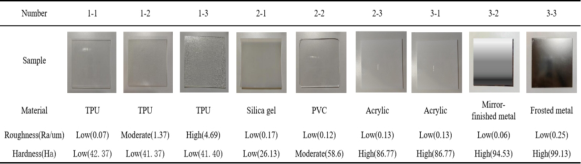
Results Using the measured data and the established intervals, we further selected experimental materials and divided them into three groups. The first group examined the relationship between different roughness levels and visual per- ception, using three types of TPU with low hardness but varying roughness (low, medium and high). The second group explored the connection between different hardnesses levels and visual perception, with materials in the low roughness range but varying in hardness (low, medium and high). Due to the strong correlation between material hardness and type, this group did not control for material uniformity. The third group investigated the relationship between different material types and visual experience, using materials with
low roughness and high hardness, specifically acrylic, mirror-finished metal and frosted metal (see Figure 3).
Figure 3: Three groups of material samples.
Selecting Evaluation Vocabulary Procedure Based on the perceptual experience research points outlined in Figure 1, we further discussed the visual experiences associated with tactile experience in home environments and proceeded with the selection and classification.
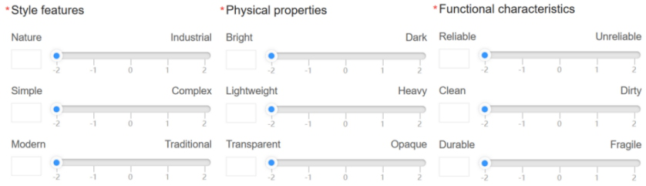
Results We identified three evaluation dimensions: style features, physical properties, and functional characteristics. For each dimension, we selected three visual evaluation words relevant to the home environment, as shown in Figure 4. In addition, we gathered feedback on visual experience related to touching material samples through questionnaires. The questionnaire utilized a Likert scale, a psychological response scale on which subjects indicate their level of agreement with a statement (Yang et al., 2010).
Figure 4: Visual evaluation vocabulary.
STEP 2: EXPERIMENT Participants
We recruited 21 students from various majors (including both undergradu- ates and graduate students) as participants. The group comprised 11 males and 10 females, with an average age of about 22 years old. Each participant completed the experiment in approximately 30 minutes.
Exploring Cross-Sensory Perception: The Correlation of Visual and Tactile Sensations 95
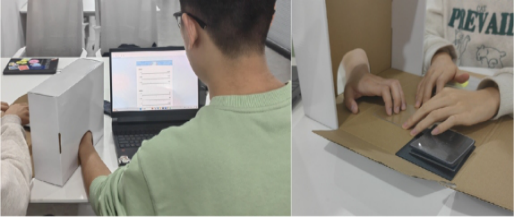
Tasks The experiment involved an apparatus called a “touching box”, which allowed participants to feel the material samples with their fingers without seeing them. Participants were instructed to place their one hand inside the touching box and use their other hand to complete a questionnaire on a com- puter, based on their tactile impressions (Figure 5). Concurrently, researchers conducted further interviews based on participants’ responses to understand their immediate thoughts.
Figure 5: Experiment task.
Procedure Before starting the experiment, we introduced the content and tasks of the experiment to each participant. This included instructions on how to interact with the material samples, how to complete the questionnaire, and a brief explanation of the vocabulary used in the questionnaire.
During the experiment, participants placed their left hand in the touching box and filled out the questionnaire with their other hand. This setup ensured that they could not see the material while completing the questionnaire. The experimenter changed the material in the touching box and randomized the presentation order of the three groups of materials to mitigate any potential bias from the order of touch. Throughout the experiment, the experimenter engaged with participants, asking questions to express their associations and feelings. This approach served dual purposes: facilitating subsequent analyt- ical studies and preventing participants from experiencing numbness due to prolonged repetitive touching of the materials.
STEP 3: ANALYSIS Data Analysis
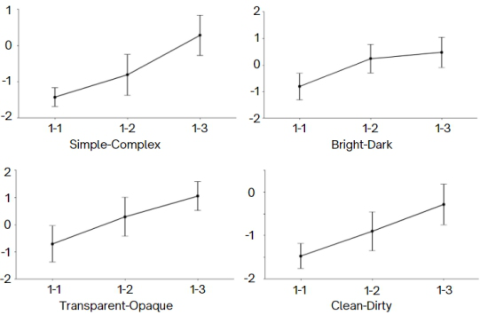
We applied one-way ANOVA to evaluate the significance of visual percep- tion vocabulary across different material groups (significant at λ = 0.05, as shown in Table 5). In Group 1, roughness significantly influenced the dimen- sions of simple-complex, light-dark, transparent-opaque, and clean-unclean. In Group 2, hardness had a significant impact on light-dark, light-heavy and clean-dirty dimensions. In Group 3, material type significantly impacted the light-dark, transparent-opaque and clean-dirty dimensions.
Figure 6 illustrates that materials with higher roughness correlate with more complex visual styles, and darker, more opaque features. Additionally, in the clean-dirty dimension, all materials in Group 1 scored negatively, indi- cating a tendency towards cleanliness, with lower roughness enhancing the visual perception of cleanliness. (Vertical axis: Score; Horizontal axis: Sample number).
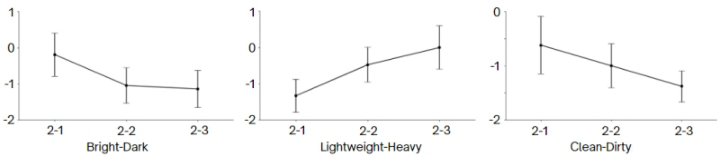
Group 2: Different Hardness Levels As shown in Figure 7, materials in Group 2 consistently showed negative values across three salient dimensions, indicating a tendency towards bright, light, and clean visual experience. Higher hardness correlated with brighter and cleaner appearances, while lower hardness was associated with lighter perceptions. (Vertical axis: Score; Horizontal axis: Sample number).
Exploring Cross-Sensory Perception: The Correlation of Visual and Tactile Sensations 97
Figure 6: Error bar plot of group 1.Figure 7: Error bar plot of group 2.
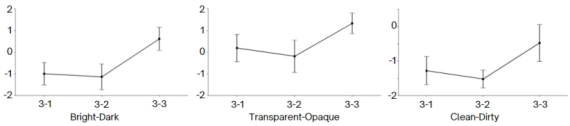
Group 3: Different Material Types As depicted in Figure 8, among the significant dimensions, the differences between acrylic and mirror-finished metal were not significant, and the differ- ences with frosted metal were more pronounced. Frosted metal was perceived as darker and more opaque. All three materials were associated with clean- liness, but acrylic and mirror-finished metal appeared visually cleaner than frosted metal. (Vertical axis: Score; Horizontal axis: Sample number).
Figure 8: Error bar plot of group 3.
Qualitative Analysis Throughout the experiment, we actively engaged with participants to under- stand their immediate experience and to prevent numbness. Consent was obtained to record the entire experiment. These recordings were then tran- scribed, anonymized, and subjected to qualitative analysis using MAXQDA software. The specific coding process unfolded as follows: Firstly, researchers organized the raw data, filtered out irrelevant information, and retained valu- able text paragraphs as units for coding. Subsequently, they categorized and
labeled each unit according to a pre-defined classification system. As the cod- ing process progressed, the researchers continuously revised and improved the category system to accommodate new data attributes. Upon completing the coding, we identified and summarized the inherent patterns and char- acteristics within the data. The purpose of this analysis was to explain the reasons behind participants’ specific visual sensations experienced through tactile interaction, as detailed in Table 6.
Table 6. Analysis of cross-sensory perception reasons.
Table available in the original PDF paper.
First Coding (Frequency) Typical Statement (Subject Number)
Secondary Coding (Frequency)
Both of these two are like glass, so I think they will be transparent.(P21)
Associating the objective properties of materials (19)
Inferring Material Type (29)
Wood reminds me of nature.(P5)
Associating the subjective feelings of materials (10) Associating the specific products (16) Imagining Application (27) The material is very rough and reminds me of leather on cars or leather sofas.(P9) Associating the using scenes (11)
Physical properties association (2)
High hardness is associated with high density, and high density is associated with high weight.(P16)
I feel like this material is very similar to the kind of transparent table mats used in roadside restaurants.(P6) Direct Visual Sensations from Touch (19) tactile perception association (6) This material feels so cool, like a cold industrial style product. (P17) Hard to explain (11) This material doesn’t feel that slippery, and I feel like it may not be as bright as the previous two materials. There’s no reason why. (P7)
DISCUSSION
The data and qualitative analysis revealed that most subjects fell into three categories when performing cross-sensory perception: (1) Inferring Material Type: Participants often guessed the type of mate- rial by touch and then based their visual assessment on this inference. This aligns with Knut et al. (2017), who examined the correlation between various materials and perceptual dimensions. For example, in the context of roughness and the dimensions of simplicity-complexity, clean-unclean, some participants directly linked their visual impressions
Exploring Cross-Sensory Perception: The Correlation of Visual and Tactile Sensations 99
with tactile sensations: ‘This material is rougher than the last one, and it may look densely packed. So it’s more complicated and unclean, and it feels like it will harbor dirt,’ said participant 6 (P6).” (2) Imagining Application: Some participants imagined real-life applica- tions,influencing their visual assessment. This reflects findings that cross-sensory perception variations relate to individual environmen- tal backgrounds (Zuo, 2010). For example, regarding roughness and transparent-opaque dimension, a participant related: ‘I feel that this material is very similar to the transparent table mat in my home, and it is very smooth,’ stated participant 9 (P9). (3) Direct Visual Sensations from Touch: Certain participants directly translated tactile sensations into visual impressions. For example, in evaluating material type and the light-dark dimension, a participant commented, ‘This material, frosted metal) feels slippery, so it might not be as bright as the others, though there’s no specific reason why,’ observed participant 7 (P7).
Based on these findings, we propose five design recommendations for material selection in home product design: i) Smooth materials help create simpler styles, while rough materials can achieve more complex styles. ii) Smoother and softer materials can offer individuals a brighter visual experience, whereas rougher and harder materials tend to evoke a sense of darkness. Frosted textures can also contribute to a darker aesthetic. iii) Softer materials leave a visually lightweight impression; in contrast, harder materials can evoke a sense of weight and security, as seen in electronic door locks. iv) Smooth materials can suggest transparency; in contrast, rough or frosted textures imply less transparency, which is an important consideration for products that require internal visibility. v) Smooth and hard materials, such as acrylic or metal, contribute to a clean appearance, this is beneficial, for instance, in the dust box of a sweeping robot to improve user experience.
CONCLUSION
In this study, we investigated the correlation between tactile and visual per- ceptions of materials used in home products. Our findings indicate that material roughness significantly influences visual perception; higher rough- ness correlates with a more visually complex style and darker characteristics, while lower the roughness is associated with a more transparent and cleaner visual experience. Materials hardness impacts visual perception as well: mate- rials with higher hardness are perceived as brighter, heavier, and cleaner. Material type affects visual associations: compared to frosted metal, acrylic and mirror-finished metal are more likely to evoke “clean”and “transparent” visual experiences, whereas frosted metal tends to be associated with “dark” characteristics more than the other two.
From these insights, we proposed five design recommendations for select- ing materials in home product design, outlined in the discussion section. These suggestions can guide designers in making informed material choices to enhance the visual experience of home products. Future research will expand to include a broader range of materials and delve into the interaction between tactile and visual experiences across different product categories and components.
ACKNOWLEDGMENT
This work was funded by the National Science Foundation support project (Grant No. 52305245) and the Cutting-edge Interdisciplinary Project (Grant No. KG16250001) of Beihang University, China.
REFERENCES
Gui, S. and Ding, X. (2021). Packaging Design of Children’s Toys Based on Synesthesia. Advances in Creativity, Innovation, Entrepreneurship and Communication of Design, pp. 244–250. Knut Drewing, Weyel, C., Celebi, H. and Kaya, D. (2017). Feeling and feelings:
Affective and perceptual dimensions of touched materials and their connection. Li, M. Y., Huang, X. L., Yuan, F., Xu, L. P.: Packaging color design based on Munsell’s color harmony theory. Packag. Eng.38(15), 219–223 (2017). Lloyd-Esenkaya, T., Lloyd-Esenkaya, V., O’Neill, E. and Proulx, M. J. (2020). Multi-
sensory inclusive design with sensory substitution. Cognitive Research: Principles and Implications, 5(1). Ludden, G. D. S., Schifferstein, H. N. J. and Hekkert, P. (2008). Visual–Tactual Incongruities in Products as Sources of Surprise. Empirical Studies of the Arts, 27(1), pp. 61–87. Steer, C., Dinca, T., Jicol, C., Proulx, M. J. and Alexander, J. (2023). Feel the Force,
See the Force: Exploring Visual-tactile Associations of Deformable Surfaces with Colours and Shapes. Proceedings of the 2023 CHI Conference on Human Factors in Computing Systems. Stein, B. E., Burr, D., Constantinidis, C., Laurienti, P. J., Alex Meredith, M., Perrault, T. J., Ramachandran, R., Röder, B., Rowland, B. A., Sathian, K., Schroeder, C. E., Shams, L., Stanford, T. R., Wallace, M. T., Yu, L. and Lewkowicz, D. J. (2010). Semantic confusion regarding the development of multisensory integration: a practical solution. European Journal of Neuroscience, 31(10), pp. 1713–1720. Tang, B., Guo, G., and Xia, J. (2017). Method for Industry Design Material Test and
Evaluation Based on User Visual and Tactile Experience. Journal of Mechanical Engineering, 53(3), pp. 162–172. Yang C., Yang Q. (2010). Application of SPSS item analysis in questionnaire design.
Journal of Advanced Correspondence Education (Natural Science Edition), 23(03): 107–10. Zuo H. (2010) “The Selection of Materials to Match Human Sensory Adaptation and Aesthetic Expectation in Industrial Design.” Metu Journal of The Faculty of Architecture, 27 (2010): 301–319. Zuo, H., Jones, M., Hope, T. and Jones, R. (2016). Sensory Perception of Material
Texture in Consumer Products. The Design Journal, 19(3), pp. 405–427.
LISTED IN THE AHFE DIGITAL BOOKSTORE CATALOGUE
Explore the complete digital volume
Interdisciplinary Practice in Industrial Design
Read this individual research paper free through the original publisher, or explore the full digital proceedings book.
ISBN 978-1-964867-20-5
Explore this ISBN in the AHFE Bookstore ↗Listed in the July 2026 bookstore catalogue; search by ISBN to confirm current availability · Digital book purchase optional