Si Chen, Yuanyuan Liu (2025). Sensory Perception of Surface Textures in Handheld Operational Products: A Case Study of E-Bike Handgrips. In: Physical Ergonomics and Human Factors. AHFE Open Access, vol. 185, pp. 29–40. https://doi.org/10.54941/ahfe1006461
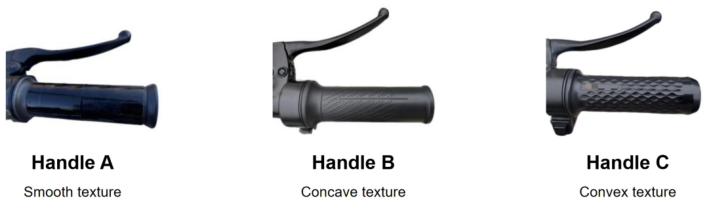
Handheld operational products including bicycles, e-bikes, and other personal mobility devices, the grip and tactile perception between users' hands and the product’s handle have a direct impact on safety, comfort, and psychological state. Given the widespread popularity of e-bike in the short-distance travel, it is essential to investigate whether specific surface texture can enhance anti-slip performance, comfort, and emotional stability under different usage contexts. By systematically analyzing e-bike handgrips, this study provides practical design insights that can be extended to a wide variety of handheld operational products, ultimately contributing to improved user experience and safety.A mixed-method approach was employed, integrating both subjective and objective data. Three representative e-bike handgrips textures-smooth, concave, and convex-were selected. Twenty volunteers were recruited for two experimental sessions: i) Participants performed a simulated riding task under normal and slippery conditions. A seven-point Likert scale gathered subjective feedback on comfort, visual impressions, and anti-slip performance. Meanwhile, electromyography (EMG) recorded grip force to quantify the force levels associated with each texture; ii) Participants first watched an e-bike accident video to elicit an emotional response. They then completed a short real-world driving task using each of the three handgrips. During this session, galvanic skin response (GSR) was monitored to capture fluctuations in emotional arousal, and brief interviews before and after provided additional qualitative insights into user experience and perceived safety. User-reported experiences differed markedly among the three handgrip textures. Convex handgrips generally fostered stronger feelings of security and reduced perceived force, particularly in slippery conditions, where users noted enhanced control. Concave handgrips were consistently praised for long-term comfort, as participants felt less fatigue during extended grip scenarios. Smooth handgrips, while sufficient in stable conditions, tended to elicit uncertainty and higher perceived exertion when surfaces were wet. Observational notes and interview transcripts suggest that users’ emotional stability and confidence improved most with the convex texture, indicating a potential link between tactile cues and perceived safety.Overall, each texture delivers distinct advantages: convex surfaces improve anti-slip properties and user confidence, concave grips enhance comfort over longer duration, and smooth surfaces suffice in ideal settings but may underperform when heightened grip stability is required. For handheld products requiring high grip security, convex textures appear preferable, whereas scenarios emphasizing prolonged comfort may favor a concave design. These insights demonstrate the importance of nuanced surface features in shaping user perceptions and experiences. Future research can investigate variations in concavity and convexity depth, as well as diverse user demographics and additional physiological metrics, to refine texture-based design strategies. By integrating these user-centered findings into product development, designers and engineers can more effectively meet the functional and emotional needs of individuals across various handheld operational contexts.
In modern life, handheld products are ubiquitous, covering a wide range of fields—from everyday tools to control components in transportation. When people operate these products, they not only focus on their basic functionality but also increasingly value tactile perception, operational comfort, and overall user experience. Haptic perception plays a crucial role in object recognition, as it is influenced by tactile stimuli and neuronal excitability (Bahar and Owain, 2021). Researchers have confirmed that the shape and size of handheld product grips significantly affect users’ sense of security, comfort, and psychological state (Zuo et al., 2016). Additionally, surface texture, as one of the key factors, is directly related to users’ perception during gripping and operation. However, existing literature remains insufficient in exploring the effects of surface texture on users’ force levels and physiological emotions in dynamic usage scenarios.
The role of surface texture extends beyond altering the friction experienced in the palm; it also influences users’ psychological security and emotional states through haptic feedback. Existing studies suggest that the perception of product surface texture is a multidimensional process involving geometric, physicochemical, emotional, and associative dimensions. The geometric dimension pertains to the shape and arrangement of the texture (Rachel and Christian, 2023), while the physicochemical dimension encompasses attributes such as smoothness, stickiness, and temperature (Karana et al., 2009). The affective dimension relates to subjective feelings such as comfort and pleasure (Zuo et al., 2016). Additionally, smooth surfaces are typically perceived as glossy, sticky, and wet, whereas rough surfaces are associated with friction and vibration. Moderate roughness can enhance comfort, but excessive roughness may cause discomfort (Zhang et al., 2025). Nevertheless, most research has focused on haptic perception under static conditions, with limited studies examining the combined effects of different surface textures on users’ force levels and physiological emotions in dynamic handheld operations.
During dynamic handheld operations, users must continuously adjust their grip strength to adapt to varying usage environments. These force variations directly impact hand muscle fatigue and the comfort of prolonged use. Furthermore, emotional state is a critical factor in driving safety, as excessive psychological stress may lead to distraction or operational errors. Therefore, investigating how surface texture affects force generation levels and physiological emotions can not only optimize the haptic experience of handheld products but also enhance safety and comfort.
To address this research gap, this study explores how surface texture influences users’ force levels and emotional states in dynamic handheld operations, using an e-bike handlebar as an example. By integrating both subjective and objective data, we aim to answer the following questions: i) Do different handlebar textures significantly affect users’ muscle force generation levels? ii) What is the correlation between users’ physiological mood fluctuations and different handle surface textures?
Sensory Perception of Surface Textures in Handheld Operational Products 31
The objective of this study is to provide a theoretical foundation and design reference for e-bike handlebar surface texture optimization and other handheld products. Through an in-depth, multidimensional analysis, we seek to offer innovative perspectives for enhancing user safety, comfort, and emotional stability.
METHODS
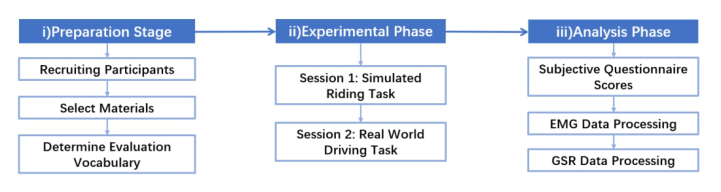
As illustrated in Figure 1, the study was conducted in three phases: i) preparation, ii) experimentation, and iii) analysis. In the preparation phase, we recruited volunteers from both within and outside the university, selected three e-bikes with distinct and representative handle textures, and identified appropriate vocabulary for evaluating visuo-tactile perception. In the experimental phase, participants performed predefined tasks. We quantified users’ muscle force generation while operating handlebars with different textures using electromyography (EMG) to assess the impact of texture on force exertion. Participants’ comfort and pleasure levels were evaluated using the Subjective Emotion Scale (SES), while their mood fluctuations during riding were tracked using galvanic skin response (GSR) physiological indicators. In the analysis phase, experimental data from EMG, GSR, and subjective evaluations were integrated to examine how surface texture affects users’ tactile experience, force exertion levels, and emotional states.
Figure 1: Research process.
PREPARATION STAGE Participants
We recruited 20 participants, including 16 postgraduate students and 4 professionals who regularly use e-bikes in China including delivery workers and couriers. There were 9 females and 11 males, with an age distribution of 5 in the 18–23 age group, 1 in the 24–30 age group, 3 in the 31–40 age group, and 1 in the 41–50 age group. The usage scenarios were mainly on campus, commuting to and from work, and for the frequency of use, eight people used it more frequently, using it every day.
4. Looks warm to me Strongly disagree # # # # # # # Strongly agree
5. Non-slip to the touch Strongly disagree # # # # # # # Strongly agree
6. Smooth to the touch Strongly disagree # # # # # # # Strongly agree
7. Sticky to the touch Strongly disagree # # # # # # # Strongly agree
8. Dry to the touch Strongly disagree # # # # # # # Strongly agree
9. Feel comfortable when holding the handle Strongly disagree # # # # # # # Strongly agree
10. Feel confident when driving with the handle Strongly disagree # # # # # # # Strongly agree The questionnaire is based on the framework of existing literature on material texture perception, which is adapted and expanded in the context of e-bike handlebar use. Zuo et al. (2016) proposed in their study that the texture perception of materials involves multiple dimensions such as visual, tactile, and emotional, and emphasized the close connection between the appearance of the material, the sense of touch, and the user experience. Referring to that study, we selected the following three main evaluation dimensions: Visual Perception, Tactile Perception, and Emotional Perception.
Muscles tested: Brachioradialis muscle. In the preliminary experimental design, in order to measure the degree of force exerted when twisting the handlebar of a motorized bicycle, we chose two muscle groups in the forearm to be tested, namely the ulnar lateral wrist flexor and the brachioradialis muscle. However, in preliminary tests, we found that the surface electromyographic signal (sEMG) of the brachioradialis muscle was more distinctive, with higher signal quality and relatively less interference from other muscles. Therefore, subsequent experiments were chosen to focus on the EMG signal of the brachioradialis muscle.
Sensory Perception of Surface Textures in Handheld Operational Products 33
Step 1) First, participants were asked to observe the 3 handles, and then fill out the Likert 7-point scale subjective questionnaire. This step was designed to obtain the participants’ initial visual perception evaluations, as well as the specific dimensions covered by the questionnaire (e.g., appearance preference, texture complexity perception, etc.).
Step 2) The EMG receiver was attached to the participant, and the instructions and precautions were explained to ensure the accuracy and reliability of the test data.
Step 3) Participants simulated driving for 1 minute, and then filled out the subjective questionnaire, and the experimenter instructed the participants to fill out the questionnaire (e.g., operating comfort, grip stability, etc.).
Step 4) Use a spray can to simulate a slippery scene on a rainy day, and let the participants fill out the Likert seven-level subjective slip resistance questionnaire, while the experimenter explains to the participants the key points of concern in the slip resistance questionnaire.
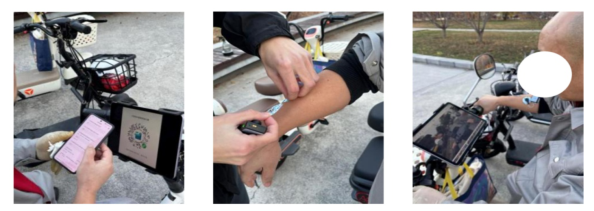
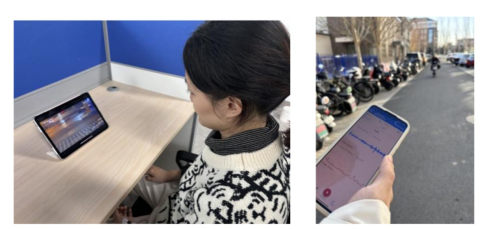
Figure 3: A participant is filling out a subjective questionnaire with a simulated driving experiment.
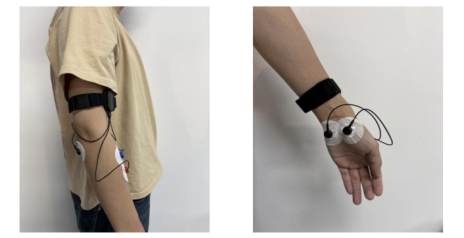
Session 2: Real-World Driving Task Step 1) Attach myoelectric and electrodermal electrodes to the participant along with the signal receiver, explain the operation specifications and precautions to ensure the accuracy and reliability of the test data.
Figure 4: Schematic of a participant affixing myoelectric and electrodermal electrode pads and wearing a signal receiver.
34 Chen and Liu
Step 2) Participants sit still for 30 seconds. Step 3) Participants watched a 1-minute video of a motorized vehicle accident to stimulate emotions.
Step 4) Participants drove a 10-meter-long road using three e-bikes with different textured handlebars in turn.
Figure 5: One participant was performing steps 3 and 4 of the experimental task.
RESULTS
Analysis Phase Data Processing of Subjective Questionnaire Scores After completing the subjective questionnaire collection, in order to explore the differences in the influence of different e-bike handlebar surface textures on user evaluation, the questionnaire rating data were processed by ANOVA. Through the one-way ANOVA test, the between-group sum of squares, within-group sum of squares, and the corresponding degrees of freedom were calculated to derive the F-value. Based on the pre-set significance level (usually 0.05), it was determined whether the F-value exceeded the critical value to determine whether there was a significant difference between the different handle types on each evaluation index.
Table 2: ANOVA results.
Table available in the original PDF paper.
Equation reproduced from the original PDF.
The shape looks
4.30±2.41 5.50±1.43 4.70±1.57 1.087 0.351
beautiful Looks non-slip 5.50±1.65 5.80±0.92 6.30±0.82 1.154 0.330 Looks shiny 3.60±2.41 3.40±1.90 4.30±2.16 0.475 0.627 Looks warm to me 4.40±1.71 4.00±1.70 4.00±1.76 0.179 0.837 Non-slip to the touch 2.50±2.22 3.50±1.90 5.90±0.88 9.826 0.001** Smooth to the touch 5.10±1.29 6.00±0.94 5.50±1.27 1.468 0.248 Sticky to the touch 4.10±2.08 2.70±1.49 2.50±1.84 2.293 0.120 Dry to the touch 3.20±1.62 5.00±1.25 5.40±1.65 5.981 0.007**
Continued
Sensory Perception of Surface Textures in Handheld Operational Products 35
Table 2: Continued
Table available in the original PDF paper.
Equation reproduced from the original PDF.
Feel comfortable
2.00±1.33 4.50±1.84 3.30±2.31 4.462 0.021*
when holding the handle Feel confident when
4.90±1.85 6.20±0.79 6.50±0.53 5.008 0.014*
driving with the handle
* p<0.05 ** p<0.01 ANOVA was used to analyze ten dimensions: ‘The shape looks beautiful,’ ‘Looks non-slip,’ ‘Looks shiny,’ ‘Looks warm to me,’ ‘Non-slip to the touch,’ ‘Smooth to the touch,’ ‘Sticky to the touch,’ ‘Dry to the touch,’ ‘Feels comfortable when holding the handle,’ and ‘Feels confident when driving with the handle.’ As shown in Table 2, four dimensions—’Non-slip to the touch,’ ‘Dry to the touch,’ ‘Feels comfortable when holding the handle,’ and ‘Feels confident when driving with the handle’—showed significant differences (p < 0.05), while the remaining dimensions did not show statistical significance.
After analyzing the subjective questionnaire score data, it was concluded that the surface texture of different e-bike handlebars differed in each evaluation dimension. Convex textured handlebars (C) were rated the highest in terms of anti-slip performance and driving confidence. For comfort, concave textured handlebars (B) rated the highest (Figure 6).
Figure 6: Analysis of variance (ANOVA) line graph for subjective evaluation scales.
EMG Data Processing For the acquired EMG data, the average degree of force exerted by the participants on each handle was analyzed by calculating the average value.
The experimental data (Table 3) showed that the average muscle force of participants using the smooth textured handle (A) was significantly higher than that of the concave textured handle (B) and convex textured handle (C). This indicates that driving with smooth textured handles (A) was more strenuous, whereas participants drove with concave textured handles (B) and convex textured handles (C) with less effort.
36 Chen and Liu
Table 3: Means and standard deviations of participants’ brachioradialis data.
Table available in the original PDF paper.
Maximum_
Minimum_
Average_
Handle Type mean
Maximum_ Standard_ mean
Minimum_ Standard_ mean
Mean_ Standard_
Deviation
Deviation
Deviation Handle A 166.039 111.8818727 7.1855 1.357687433 44.3262 30.1745594 Handle B 155.9729 85.53259039 6.9793 2.115155421 37.231 20.93740839 Handle C 151.842 112.5641719 6.5997 1.698106269 38.1365 26.74006787
GSR Data Processing In the picoelectric data processing session, the raw acquired picoelectric signals are first preprocessed, including removal of outliers and baseline correction.
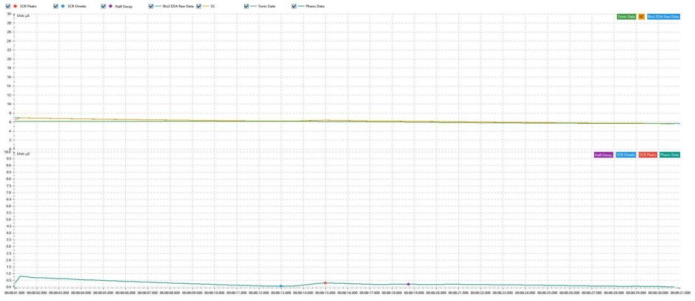
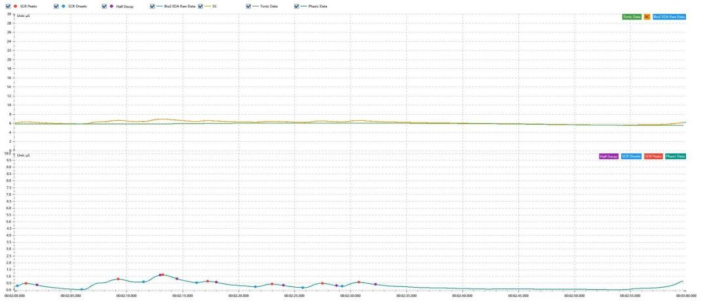
Figure 7: Filtered waveforms of GSR for one participant while sitting still.Figure 8: Filtered waveforms of GSR of the same participant while watching the video of the e-bike accident.
After preprocessing, a normality test was conducted to analyze whether the electrodermal activity (EDA) data followed a normal distribution. The commonly used Shapiro-Wilk test was applied, where the test statistic W value was calculated and compared with the corresponding critical value. Tonic (gradual signal) refers to the slowly varying component of the
Sensory Perception of Surface Textures in Handheld Operational Products 37
EDA signal. It changes at a slow rate, typically increasing or decreasing gradually over time, making it suitable for assessing long-term emotional states such as anxiety or relaxation. Phasic (sudden signal) represents the rapidly changing component of the EDA signal, reflecting an individual’s instantaneous response to short-term stimuli (e.g., a sudden fright). The figure above compares the phasic waveform of a participant during quiet sitting (Figure 7) and while watching an e-bike accident video (Figure 8). A noticeable spike in electrodermal activity can be observed, indicating that the participant’s instantaneous emotional arousal was triggered.
Table 4: Analysis results of the normality test for GSR.
Table available in the original PDF paper.
Mean Standard Skewness Kurtosis Kolmogorov-
Shapiro-Wilk
Name Sample Size Deviation
Smirnov Test Test
p
Test Statistic D Value
p Test Statistic W Value SC average 30 6.410 3.624 0.443 −0.684 0.153 0.072 0.947 0.140 Tonic average 30 5.548 3.403 0.384 −0.229 0.121 0.319 0.970 0.546 Phasic average 30 0.863 1.103 4.468 22.007 0.314 0.000** 0.461 0.000**
* p<0.05 ** p<0.01 We performed normality test for SC mean, Tonic mean, and Phasic mean, the sample size of the study data was less than or equal to 50, thus Shapiro- Wilk test was used. As can be seen in Table 4: Phasic mean presents a total of 1 item that shows significance (p < 0.05), implying that Phasic mean does not have the quality of normality. The summary of data analysis shows that Phasic mean does not have the quality of normality. In addition, SC Mean, Tonic Mean has the quality of normality.
Table 5: Table of mean values of participants’ galvanic skin response data.
Analysis of the skin electric data Table 5 comparing the Tonic values under the different textured handles revealed that the convex textured handle (C) had the smallest value, suggesting that the participant was more relaxed and stable, and was able to provide the user with a higher sense of security.
DISCUSSION
In this study, we investigated the effects of e-bike handlebars with different surface textures on users’ muscle activation and emotional responses. The results revealed significant differences among the handlebars in terms of anti- slip properties, grip comfort, driving confidence, and physiological emotions. These findings align with Zuo et al.’s (2016) research on material texture perception, suggesting that surface properties (e.g., smoothness, stickiness) not only influence the haptic experience but also impact users’ emotional responses.
EMG data indicated that friction was lower when using smooth-textured handlebars (A), requiring participants to apply greater grip force to maintain stability—reflecting a lower coefficient of friction. In contrast, concave (B) and convex (C) textured handlebars required less grip force, indicating better slip resistance. Subjective ratings also showed that concave (B) handlebars received the highest comfort scores and were particularly suitable for prolonged use, which is consistent with previous research highlighting the role of surface texture in reducing hand fatigue and enhancing comfort.
The GSR data revealed that when using smooth-textured handlebars (A), participants exhibited higher galvanic skin responses (GSR), indicating heightened emotional arousal—suggesting that users may feel nervous or uneasy while driving. In contrast, convex-textured handlebars (C) resulted in the smoothest GSR responses, indicating greater emotional stability. These findings suggest that convex-textured surfaces may enhance users’ sense of security and psychological stability. The results further confirm that tactile perception not only affects muscle force generation but is also closely linked to users’ emotional responses.
Different surface textures can trigger physiological mood fluctuations in users. The palm is often considered a “mental sweat zone” and is highly sensitive to psychogenic activities and sensory stimuli (Yin Han, 2018).
While most existing studies focus on the presence or absence of texture in static haptic perception, this study extends previous research by shifting the focus from static perception to dynamic handheld manipulation. The integration of electromyography (EMG) and galvanic skin response (GSR) data provides new insights into the user experience in dynamic operation contexts. In the design of handheld operating products, surface textures should be carefully considered for their impact on grip and comfort. Concave and convex textures, which enhance user safety and reduce emotional stress, should be prioritized to improve the driving experience.
However, this study has some limitations. Only three different bumpy textures were compared, and the experimental environment was relatively controlled, which may differ from real-world driving conditions. Future
Sensory Perception of Surface Textures in Handheld Operational Products 39
research could further refine texture variations to explore finer differences in bumpiness and validate the findings in more realistic settings. Additionally, individual differences in surface texture perception across different user groups should be explored to better inform product design.
CONCLUSION
This study provides an in-depth analysis of the effects of different e-bike handlebar surface textures on users’ force generation levels and physiological emotions. The results indicate that:
Smooth (A) handlebars, while performing moderately well under ideal conditions, exhibit lower slip resistance in slippery environments, potentially leading to higher emotional tension and increased muscular exertion.
Concave (B) handlebars provide greater comfort during prolonged use, making them ideal for extended operating environments.
Convex (C) handlebars offer the best slip resistance and driving confidence, making them suitable for scenarios that require a secure grip and enhanced safety.
When designing handheld operating products, designers should select appropriate surface textures based on specific usage scenarios. Special attention should be given to enhancing users’ sense of security, comfort, and emotional stability by considering the impact of textures on slip resistance, grip comfort, and emotional responses. By optimizing surface texture design, the overall user experience can be significantly improved to better meet the needs of various operational conditions.
ACKNOWLEDGMENT
This work was supported by the National Science Foundation Support Project (Grant No. 52305245), the Ministry of Education Industry- University Cooperation Collaborative Education Project (Grant No. CES/Kingfar 202309RYJG32), and the Educational Reform Project of Beihang University (Curriculum Reform and Practice of Human Factors Engineering Based on Frontier Interdisciplinary Research).
REFERENCES
Bahar ¸Sener, Owain P. (2021). Surface texture as a designed material-product attribute. Expanding Territories of Materials and Design, pp. 67–88. Elvin Karana, Paul, H., Prabhu, K. (2009). Meanings of materials through sensorial
properties and manufacturing processes, Materials & Design, Volume 30, Issue 7, pp. 2778–2784. Han, Y., Dong, Y. Q., Bi, J. G. (2018). The Physiological Data Representation of Emotion in Learning Analysis-Prospects for the Application of Galvanic Skin Response, Modern Educational Technology, pp. 12–19. Rachel, H. F., Christian J. S. (2023). A study of the role of surface parameters on the
relationship between biotribology and cognitive perception involved in the design of tactile graphics, Wear, Volume 523.
40 Chen and Liu
Zhang, S. S., Tang, W., Fang, X. X., Yang, L., and Zhang, M. (2025). Tactile perception of rough surface based on skin friction and brain response, Tribology International, Volume 202. Zuo, H. F, Jones, M., Hope, T. and Jones, R. (2016). Sensory Perception of Material
Texture in Consumer Products. The Design Journal, 19(3), pp. 405–427.
LISTED IN THE AHFE DIGITAL BOOKSTORE CATALOGUE
Explore the complete digital volume
Physical Ergonomics and Human Factors
Read this individual research paper free through the original publisher, or explore the full digital proceedings book.
ISBN 978-1-964867-61-8
Explore this ISBN in the AHFE Bookstore ↗Listed in the July 2026 bookstore catalogue; search by ISBN to confirm current availability · Digital book purchase optional