Due to its non-invasive neuroimaging properties and wide applicability in the field of aviation, fNIRS is chosen as the main tool for studying human factors in aviation. Currently, fNIRS-based brain-computer interface (BCI) and neurofeedback learning systems have a detection time of 4-6 seconds, which does not meet the needs of rapid decision-making by pilots in emergency situations. To shorten the detection time, we look for features to respond faster to subjects' stimuli and improve the feasibility of fNIRS for real-time application in aviation human factors. In this paper, two features of the NIR signal are extracted: the degree of variability feature and the oxygen exchange feature. By calculating the standard deviation, the degree of variability feature is compared between before and after stimulation, and the larger standard deviation indicates the more obvious activation effect of the stimulation on the brain prefrontal. In addition, by assessing the oxygenation between oxygenated hemoglobin and deoxyhemoglobin in each channel, the activation response between different brain regions can be recognized, thus reflecting the occurrence of the stimulus more accurately.that the results shown that the standard deviation of the first-order derivatives of the oxygenated hemoglobin concentration of some of the channels increased compared with the resting state 1.5 s after the stimulus onset, suggesting that the difference between before and after stimulation brain frontal increased. Analysis of the degree of oxygen exchange of channel oxyhemoglobin and deoxyhemoglobin before and after stimulation revealed that in 85% of the trials, the degree of oxygen exchange of certain channels changed significantly between 1 and 2 s after stimulation. Our study suggests that subjects' responses to stimulation and brain prefrontal activity could be detected on the basis of changes in the standard deviation of the first-order derivative of oxyhemoglobin and changes in the degree of oxygen exchange of oxyhemoglobin and deoxyhemoglobin in certain channels within 1 to 2 seconds after stimulation. This finding may enhance the feasibility of NIR imaging in future real-time applications of human factors.
Pilot Cognitive Activity Research aims to improve flight safety, optimize task allocation, design human-machine interfaces, and training and assessment
Rapid Detection of Near-Infrared Spectral Response of Neural Activity in Prefrontal Cortex 189
tools by providing insights into the cognitive processes and activities of pilots during flight missions, ultimately enhancing pilot cognitive abilities and mis- sion performance. Several techniques for recording neural activity have been investigated in human-computer interaction research in aviation (Verdière et al., 2018), including electroencephalography (EEG) (Liu et al., 2021), func- tional magnetic resonance imaging (fMRI) (Ahn & Jun. 2017), and fNIRS, to name a few. EEG has the advantages of being non-invasive, less technically demanding and widely available at low cost. However, EEG also has certain disadvantages; portable EEG devices are prone to artifacts as well as low spa- tial resolution. Functional magnetic resonance imaging, on the other hand, requires the subject to lie on the scanner, which is technically demanding and therefore unsuitable for human-computer interaction studies in aviation. The non-invasive optical method of fNIRS offers flexibility of use, portabil- ity, metabolic specificity, good spatial resolution, localized information, high sensitivity for detecting small concentrations of substances, and affordability (Tak & Ye, 2014; Brigadoi et al., 2014; Brigadoi et al., 2018). Nevertheless, the ability of fNIRS to record localized brain activity with centimeter-level spatial resolution (depending on the geometry of the probe) makes it broadly applicable in the field of aviation for monitoring the cognitive state of pilots and human-computer interactions in the aviation environment. Therefore, in this paper, fNIRS is chosen as the main tool for studying human factors in aviation.
Current fNIRS utilizes a continuous wave technique of near-infrared spec- troscopy. Regional brain activation is accompanied by an increase in regional cerebral blood flow (rCBF) and regional cerebral metabolic rate of oxygena- tion (rCMRO2). In turn, the degree of increase in rCBF and the degree of increase in rCMRO affects the rise and fall of HbO and HbR (Sitaram et al., 2007). We therefore examined the response of subjects to stimuli by study- ing the relevant changes in HbO and HbR. Changes in the concentration of HbO and HbR were calculated from changes in light intensity at different wavelengths using the modified Beer-Lambert equation (Tai & Chau, 2009). The advantages of the continuous wave method are its simplicity, flexibility and high signal-to-noise ratio.
In the research field of fNIRS, there are numerous studies focusing on signal feature extraction, and commonly used features include signal mean, signal slope, signal peak, skewness, kurtosis, variance, sum of peaks, root- mean-square, median, and so on (Hong and Zafar, 2018; Wibowo et al., 2018; Hu and Yacoub, 2012). Sitaram et al. used changes in the ampli- tude of HbO and HbR as category discriminating features (Sitaram et al., 2007). Kelly Tai and Tom Chau used the number of instances in which the signal crosses the zero line, the asymmetry of the signal values around the mean with respect to the normal distribution, the percentage of the total sig- nal energy contributed by the approximated signal from the 6-level wavelet decomposition of the time-domain signal, and a measure of the degree of peakedness of the distribution of the signal values with respect to the nor- mal distribution as the extracted signal features to categorize the affective state period and baseline state (Tai & Chau, 2009). Togo et al. converted the
fNIRS signals to 2D signals and then performed image-based feature extrac- tion using a pre-trained convolutional neural network (CNN) model (Togo et al., 2023). Also, there have been many studies centered around stimulus detection and feature extraction times. Benaron et al. (2000) demonstrated an optical response leading to the contralateral hemisphere about 5–8 s after the onset of exercise (Benaron and Hintz, 2000). Hong et al. used early changes in oxygenation prior to an increase in CBF to detect an initial inclination requiring a detection time of about 2.5 s (Cui, Bray, & Reiss, 2010; Zafar & Hong, 2020). However, such delays are therefore an important challenge for the aviation domain. Pilots are required to perform a large number of cognitive activities during flight, as well as to respond quickly to unexpected events, and these responses need to be accomplished in a very short period of time to ensure the safety of the aircraft. If there is a long delay in detection, the pilot’s response time is prolonged, resulting in the inability to take the correct measures in time, thus increasing the risk of accidents.
Therefore the main objective of this paper is to shorten the detection time of fNIRS and to explore features to respond faster to the stimuli experienced by the subject, thus increasing the feasibility of real-time application of fNIRS for human factors in aviation.
In this paper, we design a visual search experiment, describe the signal acquisition method and data analysis, and finally then summarize the results of the analysis.
MATERIALS AND METHODS
Participants Nine healthy young adults (mean age 24 years, age range 22–25 years, 5 males, 4 females) were recruited for this study. None of the recruited sub- jects had a history of psychiatric illness or were taking medication. Written informed consent was obtained from all subjects.
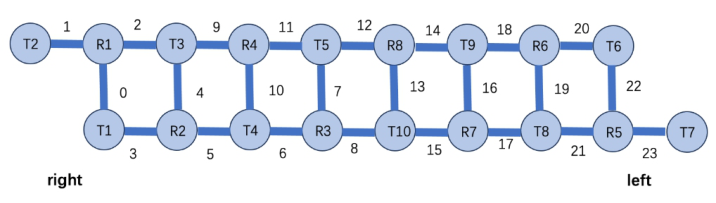
Experimental Setup In this study, we used a Brite-1907 (Artinis Medical Systems B.V) continuous wave near-infrared spectrometer instrument to obtain changes in the concen- tration of HbO and HbR during the visual search experiment. The system consists of 10 transmitters emitting light at two different wavelengths (760 and 850 nm) and 8 receivers generating a total of 24 channels. The probes are secured to the forehead by a neoprene headband that roughly covers the anterior PFC as well as part of the dorsolateral and ventral PFC. And Figure 1 shows a view of the transmitter and receiver arrangement. The source detec- tor distance for each channel was 2.5 cm, providing a penetration depth of approximately 1.25 cm, and the sampling frequency was set to 50 Hz. The fNIRS instrument is capable of storing the raw signal intensity values for each wavelength, and the change in HbO and HbR concentration values for all time points, in a pre-specified format in an output file. Signal pre-processing, analysis, and classification procedures were implemented to read data from the file in either offline or online mode.
Rapid Detection of Near-Infrared Spectral Response of Neural Activity in Prefrontal Cortex 191
Figure 1: Enlarged view of the transmitter and receiver arrangement.
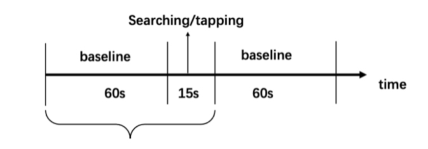
Experimental Procedure During the experiments, subjects were seated in a dimly lit and quiet room, facing the display stimulus computer screen, and were asked to remain still. Individual trial consisted of a baseline sequence and a task sequence. Each trial began with a baseline sequence, during which the subject stared at a grey screen for 60 seconds and was asked to relax; then, in the task sequence, 25 random numbers appeared on the screen, arranged in a 5 × 5 grid, and a certain number among the 25 random numbers was played on the head- phones, and the subject was asked to find the number on the screen, and after finding the number, he or she operated the mouse with the right hand to click on the corresponding position on the screen, as shown in the Figure 2. Each subject performed a total of 35 trials over the course of the experiment.
Figure 2: Experimental paradigm.
Data Processing In order to ensure the quality of data, bad channels should be excluded first, otherwise these channels will pollute the data. the raw signal is signal decom- posed by Fourier transform to observe the presence of physiological signal frequencies, such as heart pulsation frequency. If these specific frequencies can be observed in the channel, the probe of the channel is considered to be in good contact with the forehead and can correctly receive the reflected light from the forehead. The data processing and analysis that follows in this paper is also centered around the good channel. The selected raw signals were then filtered, and in order to remove long term baseline drift and most of the physiological noise including heartbeat waves, a Butterworth filter of 0.02 Hz to 0.4 Hz was used in this paper.
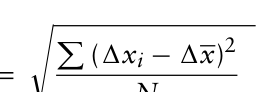
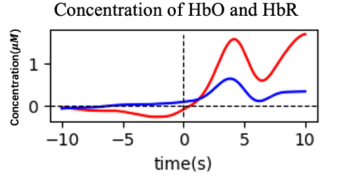
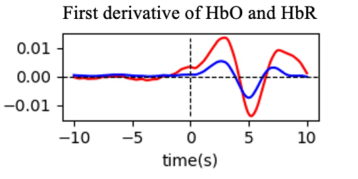
Data Analysis Characterization of the Degree of Variation As task stimulation causes an increase in prefrontal nerve activity in the brain, which causes an increase in blood flow, it will result in more blood and oxy- gen being delivered to active brain regions, ultimately resulting in a tendency for HbO concentrations to rise after stimulation, as shown in the Figure 3. However, if the HbO concentration maintains an upward trend before/in the stimulation, it is impossible to distinguish whether the rise is caused by the stimulation or maintains its own upward trend. Therefore, the change of the first-order derivative of the HbO and HbR concentrations was considered in the study. The first-order derivative values increased, indicating that the stimulation triggered a more obvious hemodynamic response, as shown in the Figure 4. The first derivative of HbO and HbR concentrations is calcu- lated using the central differences method as the following formula (1). In order to better compare the differences between pre- and post-stimulation, the standard deviations of the first-order derivative values of HbO in 1.5s post-stimulation from different channels were compared those in 1.5 s pre- stimulation. We calculated the standard deviation of the first-order derivative values of HbO within 1.5 s before and after stimulation, respectively, using the following formula (2).
1xi = xt + 1 −xt−1 2 , 1 < t < n −1 (1) If xt is the recorded HbO or HbR concentration at time t at a particular channel i, then the amplitude feature vector for a given stimulus is xi=x0, …, xt, …, xn.
Equation reproduced from the original PDF.
where 1xi denotes the first-order derivative value of each data point of HbO in 1.5s, 1x denotes the average value of the first-order derivative value of HbO in 1.5s, and N denotes the number of data for the first-order derivative value of HbO in 1.5s.
Figure 3: Concentration of HbO and HbR. The vertical dashed line represents the start time of the stimulus, the red solid line represents the concentration of HbO, and the blue solid line represents concentration of HbR.
Rapid Detection of Near-Infrared Spectral Response of Neural Activity in Prefrontal Cortex 193
Figure 4: First derivative of HbO and HbR. The vertical dashed line represents the start time of the stimulus, the red solid line represents the first derivative change of HbO, and the blue solid line represents the first derivative change of HbR.
Oxygen Exchange Characteristics When the subject receives a stimulus, the prefrontal region of the brain increases neural activity and requires a greater supply of oxygen to maintain normal neural signaling and brain function (Herrmann, 2004). Therefore, the oxygen supply to the brain, i.e., the degree of oxygen binding to hemoglobin in the blood of the brain complement, can be used to indicate the degree of neural activity in the prefrontal region of the brain. In this study, the ratio of the change in the concentration of HbO and the change in the total blood oxygen concentration (D) is used to indicate the degree of oxygen binding to hemoglobin in the blood, and the formula (3) is as follows. the ratio indi- cates that the stimulus triggers a more obvious hemodynamic response, and the degree of binding of oxygen to hemoglobin in the blood changes, thus reflecting the activation of the brain frontal activated by the stimulus.
D = 1HbO 1HbO + 1HbR (3) Where 1HbO represents the change in concentration of HbO, and1HbR represents the change in concentration of HbR.
RESULTS
Characterization of the Degree of Variation
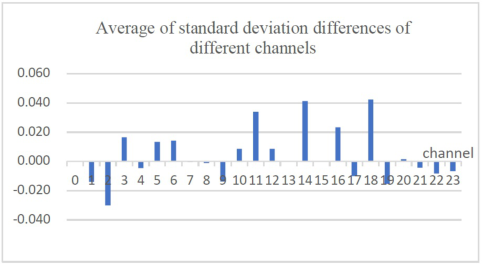
Table 1 shows the difference between the standard deviation of the first-order derivative values of HbO for different channels of different subjects 1.5 s after stimulation and 1.5 s before stimulation. A positive value indicates that the standard deviation of that channel of that subject increased after stimulation with respect to the resting state, while a negative value indicates a decrease. As shown in the table, channels 5, 6, 14, 16, and 18 all showed an increase in standard deviation relative to the resting state after stimulation; channels 3 and 10 showed an increase in standard deviation relative to the resting state in eight subjects and a decrease in standard deviation relative to the resting state in one subject after stimulation; and the remaining channels were not characterized by any significant increase or decrease. The standard deviation differences of the same channels for 9 subjects were averaged and the results are shown in Figure 5. The means of the standard deviation differences of
channels 3, 5, 6, 11, 14, 16, and 18 increase; while the means of channels 1, 2, 9, 17, 19 decrease. The brain prefrontal HbO concentration increased relative to the resting state standard deviation, indicating that the difference before and after stim- ulation became larger. The implication is that stimulation of the cerebral prefrontal leads to increased volatility of HbO concentration.
Table 1. Difference in standard deviation between different channels.
Figure 5: Average of standard deviation differences between before and after stimulation.
Rapid Detection of Near-Infrared Spectral Response of Neural Activity in Prefrontal Cortex 195
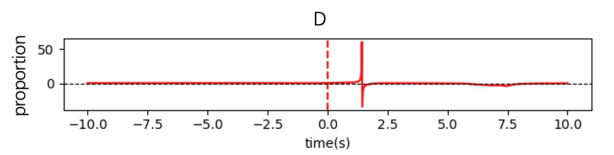
Oxygen Exchange Characteristics The degree of oxygen exchange in the different channels was analysed in 315 trials (9 subjects * 35 trials). It was found that in more than 85% of the trials, there were channels that produced pulse-like mutation points after stimula- tion as characterized in the Figure 6, whereas no similar significant changes occurred in the resting state. We analysed the values of changes in HbO and HbR concentrations before and after the mutation point. It was found that the values of the change in concentration of HbO and HbR changed in oppo- site trends when the subjects were stimulated. When the absolute values of the changes of the two are close to each other, as in Figure 6, mutation points appear.
Figure 6: Changes in blood oxygen saturation of one of the channels of a subject. The red dashed line represents the start time of the stimulus, and the red solid line represents the curve of changes in blood oxygen saturation.
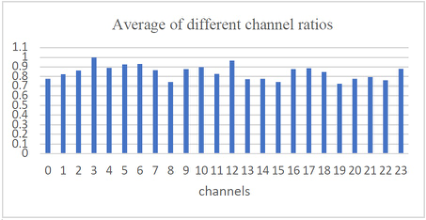
When the stimulus occurs, 1HbO and 1HbR undergo opposite trends due to the hemodynamic response. In order to detect whether the mutation point is characterized by this feature before and after the mutation point, we calculated the ratio that the opposite trend of HbO and HbR concentration change occurs in 1s before and after the mutation point in different channels, as shown in Figure 7. the ratio of all channels are greater than 70%, the ratio values of channels 1, 2, 3, 4, 5, 6, 7, 9, 10, 11, 12, 16, 17, 18, 23 are greater than 80%, and the ratio values of channels 3, 5, 6, 10, 12 are greater than 90%. This indicates that after the occurrence of a stimulus, the appearance of mutation points in channels 3, 5, 6, 10, and 12 is accompanied by a clear hemodynamic response characteristic of the stimulus, thus it is suggested that the mutation points could be used as a feature for detecting the stimulus. The distribution of the above channels in the prefrontal brain region is mainly on the right and in the center. It suggests that the right side and center of the prefrontal are the main parts involved when performing visual search tasks.
Figure 7: Average of different channel ratios.
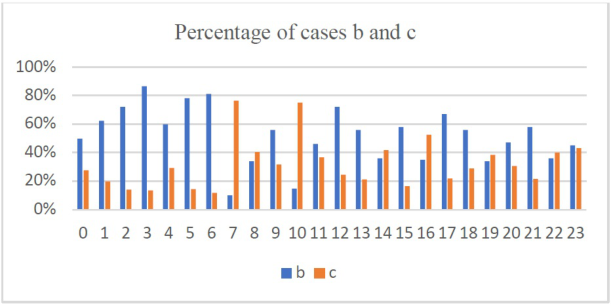
Because there is a strong link between activation and deactivation in the prefrontal cortex of the brain and higher cognitive functions such as deci- sion making, attention modulation, and working memory. Therefore, in this paper, the trends of HbO and HbR by different channels were investigated for all the trials to analyze the activation and deactivation responses in different regions of prefrontal cortex. The trends of 1HbO and 1HbR in the vicinity of the mutation sites were counted, and a total of four trends were classi- fied: (a) 1HbO increased and 1HbR increased; (b) 1HbO increased and 1HbR decreased; (c) 1HbO decreased and 1HbR increased; and (d) 1HbO decreased and 1HbR decreased. where the activation response is character- ized by a rise in 1HbO and a fall in 1HbR (b) and the inactivation response is characterized by a fall in 1HbO and a rise in 1HbR (c). A channel is defined as an activation channel if the number of samples in that channel that simul- taneously satisfy 1HbO rise and 1HbR fall accounts for more than 70% of the total number of mutation sites in that channel. If the number of samples with both 1HbO falling and 1HbR rising accounted for 70% or more of the total number of mutation points in the channel, the channel is defined as inactivated. For all trials, the activation and inactivation statistics are shown in Figure 8.
Figure 8: Percentage of cases b and c.
It was found that channels 2, 3, 5, 6, and 12 were activated and channels 7 and 10 were deactivated after the task was initiated. It can be found that the activated and inactivated regions are generally in close proximity. This sug- gests that activation of some prefrontal regions of the brain is accompanied by deactivation of the surrounding regions when a task stimulus occurs, a phe- nomenon known as ‘reverse connectivity inactivation’ (Herculano-Houzel et al., 2013). During cognitive tasks, activation in the prefrontal regions of the brain can inhibit activity in other brain regions, allowing attention to be focused on task-relevant information.
Therefore, we use the degree of variation and oxygen exchange as charac- teristics for detecting stimulus occurrence. Based on the above two features,
Rapid Detection of Near-Infrared Spectral Response of Neural Activity in Prefrontal Cortex 197
we choose channels 3, 5, 6, 10, and 12 as the regions of interest. We com- pared the detection time (the time from the start of the stimulus to the point of mutation) of each channel in the region of interest with the time of channels in non- region of interest. in order to investigate whether regions of interest has an impact on detection time. The t-test results showed that the final detection time of selecting ROI was significantly shorter than that of not selecting ROI (p<0.05). For different trials, the detection time can be reduced to 0.5-2.5s, which greatly improve the detection time of the stimulus response.
SUMMARY In order to improve the feasibility of real-time application of fNIRS in this paper, we extracted the degree of variability feature and the oxygen exchange feature of the fNIRS signal and selected channels 3, 5, 6, 10, and 12 (the right side and center of the prefrontal) as regions of interest to respond faster to the stimuli experienced by the subjects. Our results show that the use of these two features to detect the onset of a stimulus such that the detection latency of a single subject can be minimized, reducing the detection time to about 1.5 s. The use of these two features to detect the onset of a stimulus can also be used to further reduce the detection time. Thus, it could be a valuable tool for future studies of human factors in aviation.
REFERENCES
Ahn, S., & Jun, S. C. (2017). Multi-Modal Integration of EEG-fNIRS for Brain- Computer Interfaces – Current Limitations and Future Directions. Frontiers in Human Neuroscience, 11. Benaron, D. A., Hintz, S. R., Villringer, A., Boas, D., Kleinschmidt, A., Frahm, J.,
Hirth, C., Obrig, H., vanHouten, J. C., Kermit, E. L., Cheong, W. F., & Stevenson, D. K. (2000). Noninvasive functional imaging of human brain using light. Journal of Cerebral Blood Flow & Metabolism, 20, 469–477. Brigadoi, S., et al. (2014). Motion artifacts in functional near-infrared spectroscopy: A comparison of motion correction techniques applied to real cognitive data. Cui, X., Bray, S., & Reiss, A. L. (2010). Speeded Near Infrared Spectroscopy (NIRS)
Response Detection. PLoS ONE, 5, e15474. Dehais, F., et al. (2018). Monitoring Pilot’s Cognitive Fatigue with Engagement Features in Simulated and Actual Flight Conditions Using an Hybrid fNIRS- EEG Passive BCI. 2018 IEEE International Conference on Systems, Man, and Cybernetics (SMC). Herculano-Houzel, S., 2013. Distribution of neurons in functional areas of the
mouse cerebral cortex reveals quantitatively different cortical zones. Front Neuroanat 7, 35. Herrmann, M. J., Ehlis, A.-C., & Fallgatter, A. J. (2004). Bilaterally Reduced Frontal Activation During a Verbal Fluency Task in Depressed Patients as Mea- sured by Near-Infrared Spectroscopy. Journal of Neuropsychiatry and Clinical Neurosciences. Hong, K.-S., & Zafar, A. (2018). Existence of initial dip for BCI: an illusion or reality.
Frontiers in Neurorobotics, 12, 69. Hu, X. P., & Yacoub, E. (2012). The story of the initial dip in fMRI. NeuroImage, 62.
Hwang, H. J., Choi, H., Kim, J. Y., Chang, W. D., Kim, D. W., Kim, K., et al. (2016).
Toward more intuitive brain-computer interfacing: classification of binary covert intentions using functional near-infrared spectroscopy. Journal of Biomedical Optics. Jasdzewski, G., Strangman, G., Wagner, J., Kwong, K. K., Poldrack, R. A., & Boas, D. A. (2003). Differences in the Hemodynamic Response to Event- Related Motor and Visual Paradigms as Measured by near-Infrared Spectroscopy. NeuroImage, 20(1), 479–488. Liu, X. L., & Hong, K.-S. (2017). Detection of primary RGB colors projected on a
screen using fNIRS. Journal of Innovative Optical Health Sciences, 10, 1750006. Malonek, D., & Grinvald, A. (1996). Interactions between electrical activity and cortical microcirculation revealed by imaging spectroscopy: implications for functional brain mapping. Science, 272, 551–554. Sitaram, R., et al. (2007). Temporal classification of multichannel near-infrared spec-
troscopy signals of motor imagery for developing a brain–computer interface. NeuroImage, 34, 1416–1427. Tai, K., & Chau, T. (2009). Single-trial classification of NIRS signals during emotional induction tasks: towards a corporeal machine interface. Journal of NeuroEngineering and Rehabilitation, 6, 39. Tak, S., & Ye, J. C. (2014). Statistical analysis of fNIRS data: A comprehensive
review. NeuroImage, 85, 72–91. Togo, T., Togo, R., Keisuke, M., Ogawa, T., & Haseyama, M. (2023). Novel Feature Extraction for Classification of Auditory-visual Stimuli from fNIRS Sig- nals. In 2023 IEEE 12th Global Conference on Consumer Electronics (GCCE) (pp. 759–760). Wibowo, S. A., Lee, H., Kim, E. K., & Kim, S. (2018). Collaborative learning based
on convolutional features and correlation filter for visual tracking. International Journal of Control, Automation and Systems, 16, 335–349. Zafar, A., & Hong, K.-S. (2020). Reduction of Onset Delay in Functional Near- Infrared Spectroscopy: Prediction of HbO/HbR Signals. Frontiers in Neuro- robotics, 14, 10.
LISTED IN THE AHFE DIGITAL BOOKSTORE CATALOGUE
Explore the complete digital volume
Neuroergonomics and Cognitive Engineering
Read this individual research paper free through the original publisher, or explore the full digital proceedings book.
ISBN 978-1-964867-02-1
Explore this ISBN in the AHFE Bookstore ↗Listed in the July 2026 bookstore catalogue; search by ISBN to confirm current availability · Digital book purchase optional