Tianrui Qi, Xiaodan Wang, Yiyuan Zheng, Shan Fu, Yanyu Lu (2024). A potential rapid detection of cognitive status in the brain: an fNIRS study. In: Neuroergonomics and Cognitive Engineering. AHFE Open Access, vol. 126, pp. 199–210. https://doi.org/10.54941/ahfe1004753
In the realm of human factors, objective assessment of cognitive states is crucial for the safe completion of tasks. Functional near-infrared spectroscopy (fNIRS) can be employed to recognize the cognitive activities and evaluate the mental workload associated with cognitive-executive processes. This study proposes a method for facilitating the faster detection of changes in cognitive states based on the correlation coefficients of adjacent channels, which enables the extraction of local connectivity (LC) features from fNIRS data. The results indicate that the extracted new features can reflect changes in the activation patterns of specific brain regions during the early stages (0~2.5s) of the task. It is suggested that these features could be used to identify the brain's task states.
With the advancement of aviation technology and the improvement in air- craft design capabilities, the level of aviation flight safety has significantly increased. However, human factors remain one of the primary contributors to aviation accidents and incidents. The statistical data indicates that the main reasons for airplane accidents are pilot errors and incorrect decision-making (Dong, 2011). In aviation, integrating neurophysiological signals into cockpit interfaces and monitoring pilots’ cognitive activities improves system safety and performance by considering human factors (Li, 2001).
Pilots engage in visual search and rapid responses when interacting with instruments, exhibiting characteristics of cognitive-executive tasks involving the integration of cognitive processes (such as perception, attention, etc.) and executive processes (such as directional movements, button responses) (Bendall, 2016). These processes are primarily associated with brain activity, particularly the activity of the frontal lobe (Orellana, 2013).
Methods for detecting brain activity include electroencephalography (EEG), functional magnetic resonance imaging (fMRI), functional near- infrared spectroscopy (fNIRS), and others. EEG is currently the most established neuroimaging technique in research (Anokhin et al., 2004), to
understand PFC cortex function during such tasks. However, EEG has lim- itations in spatial resolution and is not suitable for flight tasks in complex environments due to susceptibility to motion artifacts and the influence of complex electromagnetic environments within the cockpit. Another brain imaging technique is fMRI, which has higher spatial resolution compared to EEG but suffers from high cost, and lower signal-to-noise ratio (Yuan, 2013). Due to the poor portability of fMRI equipment, it is similarly challenging to apply within the cockpit.
In this study, we consider the use of functional near-infrared spectroscopy. Functional near-infrared spectroscopy has several advantages over other brain imaging methods. Firstly, fNIRS has higher spatial resolution, up to 1 cm. Secondly, fNIRS has higher signal-to-noise ratio (Fishburn et al., 2014), making it suitable for measuring frontal lobe activity during psychological tasks and workload. Additionally, due to the portability and lower sensitiv- ity to motion artifacts of fNIRS, it is more suitable for complex environments and tasks within the cockpit.
Researches have extracted statistical features from functional near-infrared spectroscopy to analyze brain performance in cognitive-executive tasks Sitaram et al. (Sitaram et al., 2007) extracted the average values before and after experimental responses as features for assessing binary classifica- tion tasks et al. (Herff, 2014) extracted statistical features related to brain activity in individual trials, such as skewness and kurtosis, for classify- ing or quantifying differences in brain activity under different experimental conditions. These studies confirm that cognitive-executive tasks can induce hemodynamic responses in the frontal cortex.
However, the chosen time windows in these methods are often greater than 5 seconds, which may overlook potential changes in hemodynamic responses over time, leading to unnecessary judgment delays. In cockpit scenarios, pilots face emergencies requiring rapid perception and response. Excessive time delays hinder precise determination of pilots’ rapid state transitions, reduc- ing system accuracy and increasing task risks. Therefore, it is necessary to find more rapid features that reflect brain activity during cognitive-executive periods.
Previous research has recognized the human brain’s complexity as a dynamic interactive system with functionally connected regions. Some studies employ multi-channel features, particularly connectivity features, to depict task-related functions. Racz (2017) utilized a 16-channel fNIRS device on the frontal region for visual cognitive tests. They employed graph theory methods for matrix analysis, calculating common global network metrics, and observed increased functional connectivity parameters during stimulus periods compared to resting states. Nguyen and Kim (2019) utilized Pearson correlation coefficients to measure brain functional connectivity, exam- ining differences between normal individuals and patients with cognitive impairments across various cognitive tasks.
Accordingly, connectivity features are essential potential features reflect- ing the brain’s working state Therefore, this study aims to investigate changes in the brain during the search task using brain interconnectivity and net- work properties. We designed a search task and computed local connectivity
A Potential Rapid Detection of Cognitive Status in the Brain: An fNIRS Study 201
(LC) from near-infrared spectroscopy (NIRS) data. Additionally, the acti- vated brain regions and the minimum time window of activation occurrence were determined based on the curve of activation ratio over time.
MATERIALS AND METHODS
The experiment involved 9 subjects aged 21 to 24, with an average age of 23, all in good physical health and without neurological disorders. All partici- pants were right-handed, informed about, and consented to the experiment. Each of the participants was provided with specific task instructions and a brief practice session before the experiment. Subsequently, the experiment was conducted following the same procedure for each participant.
Design of Experiments Our experimental design was as follows: subjects sat on a chair in a quiet room, 40 cm from the screen, wearing headphones to isolate external interference, and the experimental environment should be kept in normal light.
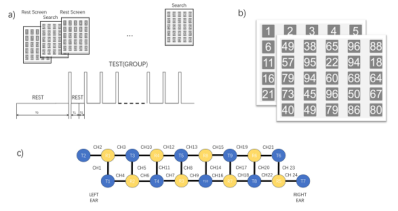
Figure 1: Experimental design and procedure. The primary objective of the search task is to select a specified number from a set of random numbers (a). The experimen- tal interface is depicted in the illustration (b). The positions of the 24-channel fNIRS optodes at the frontal lobe are shown, with yellow and blue circles representing the light source and detector, respectively (c).
The Figure 1 illustrates experimental examples for each block’s task. Each participant underwent four sets of blocks, with each block set featuring the following experimental design: Initially, before the formal commencement of the task, participants were required to undergo a two-minute resting state measurement (T0 = 120s). During the resting state, participants focused on sequentially displayed numbers from 1 to 25 on the screen. Then, they transitioned to the search task stage. The program verbally presented a randomly generated number between 10 and 99 in the participant’s native language, coinciding with a change in the sequence of numbers displayed on the screen, regenerating 25 random numbers. Participants were required to search for and identify the announced number within the randomly generated set. During the task stage, participants placed both hands on the tabletop, with the right hand resting on a fixed button. Upon locating the announced number, participants released the button and selected the identified number before returning their hand to the button. To minimize visual stimuli changes,
the screen maintained the task status with unchanged random numbers for 20 seconds. Subsequently, it transitioned to maintaining sequential numbers from 1 to 25 for 40 seconds, allowing brain activity to return to baseline. After 40 seconds, the experiment proceeded to the next set (T1 = 20s, T2 = 40s).
Each participant completed four blocks, with each block containing 9 trials, resulting in a total of 36 random numbers searched.
Data Acquisition Throughout the entire experiment, fNIRS measurements were conducted on the participants, with channel placements in the frontal lobe region, as illustrated in Figure 1(c). Artinis’ Brite24 optical near-infrared system was employed for the measurements, comprising 8 emitters and 7 detectors. The measurement array utilized a 2×24 configuration, forming 48 measurement channels, with an interoptode distance of 1 cm. The sampling rate for all channels was set at 50 Hz. Throughout the experiment, the measurement system is placed directly on the skin and remains in a fixed position.
Data Processing Out of a total of 324 search trials, the first set of experiments for each participant and any invalid trials due to participants being unfamiliar with the experiment or excessive movement amplitude were excluded. The total number of valid trials amounted to 281. We will process the trials as follows.
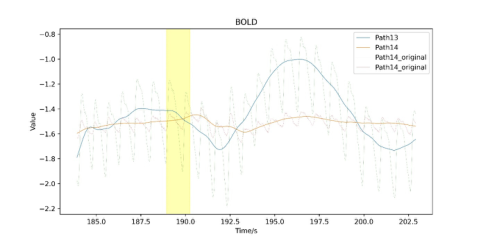
Data Pre-Processing Preprocessing is applied to the obtained HBO and HBR data, involving seg- menting each set of experimental data and discarding the initial 20 seconds of resting data to ensure signal stability. The mean of the resting state is subtracted from the data to baseline it. Subsequently, a combination filter is applied to remove physiological signals such as heartbeat and respira- tion. The combination filter comprises a 1.2Hz notch filter and a bandpass filter ranging from 0.02 to 1.5Hz, designed to eliminate slow drifts, higher- frequency noise, and the influence of physiological signals. The comparison of signals before and after filtering is presented in the Figure 2 below.
Figure 2: Comparison of HBO and HBR signals before and after filtering, the yellow band represents the period from the random number being announced to its discovery (the participant lifting their finger).
A Potential Rapid Detection of Cognitive Status in the Brain: An fNIRS Study 203
Considering that deoxygenated signals exhibit smaller fluctuations com- pared to oxygenated signals and are relatively noisier, this study primarily focuses on oxygenated signals. Throughout the data processing, Individual data for each participant was processed independently.
Pearson Correlation Matrix Analysis Correlation matrices can reveal brain functional interactions and informa- tion processing. Currently, some studies utilize the sum or mean of the upper/lower triangular part, or other matrix norms, as distance measures to quantify the overall connectivity of brain regions (Ghouse, 2020).
When calculating correlation coefficients, it is essential to balance time resolution and smoothness. Shorter time windows are advantageous for cap- turing rapid changes in the data, while longer time windows may yield more reliable conclusions. Considering these factors, we adopt the following sliding window approach to segment the data.
The filtered data is sequentially segmented in time, with a time window of 1.5 seconds and a step size of 0.1 seconds (l = 1.5, s = 0.1s). For the 24 channels, based on their positions, the Pearson correlation coef- ficients between the data of each channel within a specific window are calculated. This process results in multiple 24×24 matrices representing Pearson correlation matrices that change over time.
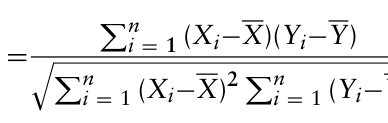
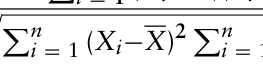
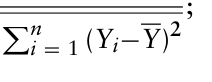
Where the Pearson correlation r coefficient and correlation matrix R are calculated as follows: Xi and Yi are the observations of the two variables, X and Y are their means, n is the number of samples.
[Equation or mathematical symbol available in the original paper PDF]
[Equation or mathematical symbol available in the original paper PDF]
Equation reproduced from the original PDF.Equation reproduced from the original PDF.
Equations and mathematical formulas are available in the original paper PDF.
Equation reproduced from the original PDF.Equation reproduced from the original PDF.
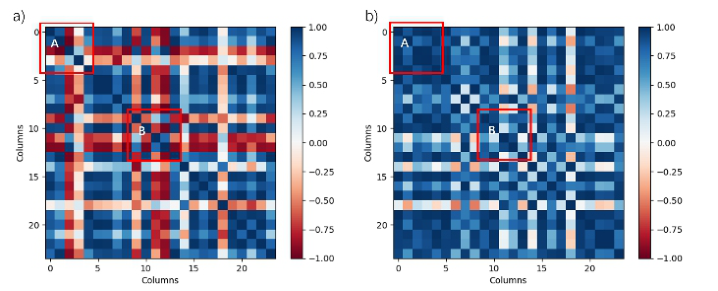
Figure 3: Comparison of Pearson correlation matrices between resting state and task stages (a) resting stage; (b) task stage.
Based on equations above, the correlation coefficient matrices between channels were calculated during the resting state and task state, as shown in Figure 3.
Assuming the occurrence of 25 new random numbers (the stimulus onset) as the reference point at time 0s, time windows for analysis were selected as follows: -1.5s to 0s for the resting state and 0s to 1.5s for the task state. Correlation coefficient matrices were computed for each respective time window.
It was noted that changes occurred after the stimulus onset in Figure 3. In comparison to the resting stage, there was an increase in correlation values in Region A, corresponding to the left side in the brain region map. Simul- taneously, there was an elevation in Region B, corresponding to the central part of the brain. Therefore,it is hypothesized that localized features within the Pearson matrix could be identified to quantify the changes in the brain during the task compared to the resting stage.
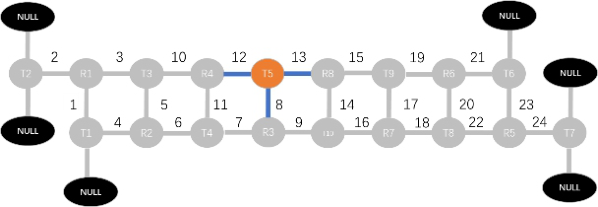
Local Connectivity Considering the local variations in Pearson correlation matrices, we measure the activation of specific brain regions by summing the correlation coeffi- cients of adjacent channels. The specific definition is as follows: We treat the results of near-infrared measurements as a network structure. Both the emitter and detector are considered as nodes, while channels are simplified as edges. After supplementation, each node is connected to three edges, as Figure 2.4. For each node, the square of the sum of correlations between its three edges is calculated as the local connectivity (LC). The definition is as follows:
2
X
(2)
LC(Ev) =
path1,path2
path1,path2∈Ev rv
Figure 4: Node augmentation and local connectivity calculation methods.
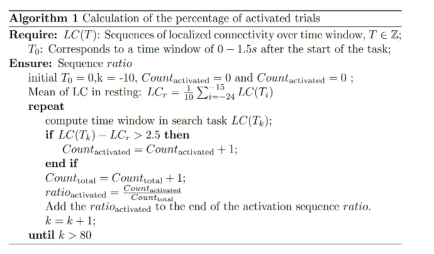
To analyse the local connectivity of the nodes after excluding the edge nodes T2 and T7 (a total of 16 nodes), the proportion of rising edges over time is calculated. Rising edges are indicative of the actual task where participants search for and find the required numbers. Since the occur- rence time of rising edges may not be fixed, activation ratio is defined as follows: Where LC(Tk) represents the local connectivity level for different time win- dows, Tk is the starting time of the time window, and k is the window number.
A Potential Rapid Detection of Cognitive Status in the Brain: An fNIRS Study 205
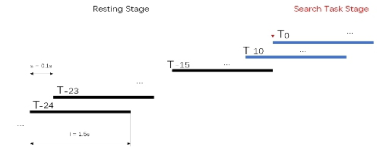
Considering the windows starting from 0 to 1.5 seconds after the task ini- tiation as the 0th window, with the step size and window length detailed in section 3.2, the numbering of each window is illustrated in Figure 6.
Figure 5: Algorithm 1: calculation of the percentage of activated trials.Figure 6: Time window identification and segmentation into different stages.
The resting average state LCR is calculated by averaging over the time win- dows from the T−15 to -T−24, which is, the mean value of local connectivity is computed for the ten time windows in the black part in Figure 6. For the task stage, computation starts from the -10th time window, following the division illustrated in Figure 6. At this point, some of the task stage data has already appeared in the windows. Using a threshold of 2.5, activation of a node is recorded when the difference between LC
Tk
and LCR exceeds 2.5. The activation ratio, ratioactivated is calculated, stored in the sequenceratio over time. Appropriate time windows and regions of interest (ROIs), i.e., nodes where activation occurs more rapidly and where the overall propor- tion of activations is larger after the stimulus onset, were selected by analysing changes in activation ratios across all trials.
For each node’s LC levels before and after the task, a t-test with FDR correction is performed. When choosing time windows, the changes in LC curve gradients and the establishment of an activation ratio threshold are considered to ensure a sufficient number of activation events are observed in a relatively short period. Through this design, we ensure the reliability of the interpretation of these changes using statistical methods.
RESULT
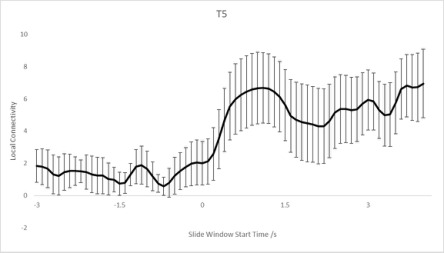
The change in LC was calculated according to Equation 2. An increase in LC levels during the task was observed at nodes R1, R2, R4, R5, R6, R8, T10, and T5. Figure 7 illustrates an example of LC at the T5 location with stan- dard error bars. In the figure, time point 0 represents the first time window after the stimulus onset, i.e., the number announcement. All time windows before -1.5 seconds are entirely within the resting state. It is evident that the LC level shows an increase around the first time window of the task stagr, aligning with our hypothesis. Additionally, it is shown that the stan- dard error (SE) increases during the task process (after 0 seconds) compared to the resting state.
Figure 7: LC at the T5 location with standard error (SE) bars.
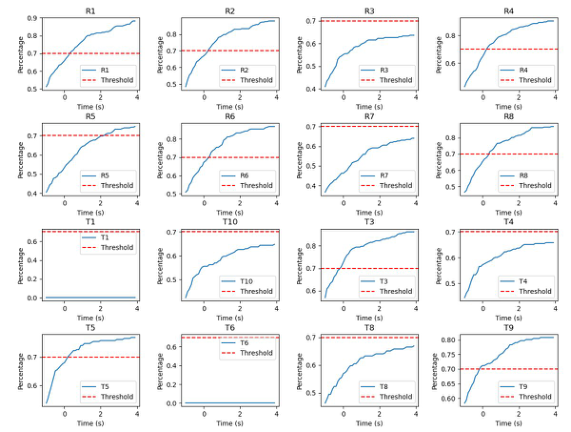
To select nodes sensitive to stimuli, i.e., to determine regions of interest (ROI), it is necessary to calculate activation ratios. For threshold selection and statistical methods, refer to Algorithm 1. Figure 8 illustrates the changes in activation ratios over time for different nodes.
Figure 8: Activation ratio curve for each node.
A Potential Rapid Detection of Cognitive Status in the Brain: An fNIRS Study 207
As shown in the figure, some nodes exhibit significant gradient changes around 0.5 to 1 second, such as R1, R2, R8, T5, T8, T3, R6, while the remaining parts of the LC curves show lower gradient increases. Based on the abscissa of the inflection point and the window length, the time window representing the brain response during the task stage is chosen as 0.5 to 2 seconds after the stimulus occurrence, corresponding to the window number k = 5, which corresponds to the time period of 0.5 to 2 seconds following the task.
Furthermore, with a LCR threshold set at 2.5 that the difference between resting and task states is most nodes exhibit enhanced local connectivity (LC) after stimulation, with certain nodes showing a more pronounced response, characterized by surpassing the threshold more rapidly, as LC
Tk
−LCR > 2.5. This is detailed as follows : R1, R2, R4, R6, R8, T3, T5, T9 all exhibit activation probabilities reaching 70% within 3 seconds of the task in all trials. Among them, the nodes of R1, R2, T5, R8, R6 and T3 show clear inflection points in the gradient and achieve an overall activation proportion of 70% relatively quickly, confirming them as Region of Interest.
To assess the reliability of the ROI and time window, a paired t-test was conducted to compare the average local connectivity LCR during the resting state with the LC(T5) within the time window of 0.5∼2 seconds after stimu- lation. The false discovery rate (FDR) correction was applied to address the issue of multiple comparisons in different participants.
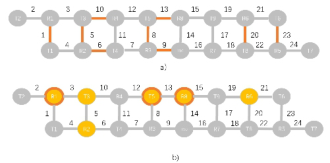
The results indicated that nodes on the left and middle as R1(p = 0.006182), T5(p = 0.040514), and R8(p = 0.028655) showed a significant increase in LC through the t-test (FDR-corrected p-value < 0.05), while T4 exhibited a significant decrease (p = 0.045272. Performing the same analysis on differ- ent time windows of resting-state data did not yield any nodes passing FDR correction. This confirmed the effectiveness of the chosen time windows for testing and further narrowed down the selection of reliable nodes in the ROI areas to R1, T5, and R8. Additionally, a significant decrease was observed in some nodes, suggesting the compensatory effect of cerebral blood flow in the brain network.
Furthermore, in comparison with traditional methods, the selected ROI regions were generally consistent.
Figure 9: Using the mean value of HbO2 and the change in LC features, the activated brain regions and channels were identified separately. In (a), the selected feature is the mean value of HbO2 during the 8–10 seconds of the task. In (b), yellow nodes represent the ROI areas chosen in this study, with red edges indicating significance in the statistical tests.
DISCUSSION
This study selected local connectivity as an indicator in the correlation matrix and utilized the high spatial resolution and appropriate temporal resolu- tion of fNIRS to analyse the data, examining brain activation and potential cognitive processes during a search task. This feature proved effective in distinguishing between task and resting states, confirming varied levels of activation in different regions of the prefrontal cortex (PFC) during the search process.
This study proposed the LC feature, considering information from multiple channels in the same region, to analyse HBO data. The results showed an increase in LC in certain channels, but the variance also increased during the task. This may be attributed to the variable duration of cognitive-executive tasks, leading to an unpredictable timing of the LC increase and subsequently causing an increase in variance in the task stage curve.
The activation proportion change over time for a specific node was statis- tically analyzed across all trials, considering both gradient change inflection points and overall activation proportions in the activation proportion curve. This was done to determine suitable time windows and ROI areas. The selected ROI areas were R1, T5, R8, R6, and T3. It was observed that the left ROI areas exhibited earlier activation and higher overall activation pro- portion, providing insights into the cognitive load during the search process. Consistent with previous studies, this activation was mainly located in the left ventrolateral and dorsolateral cortices, areas actively involved in searching, maintaining memory information, judgment, and other cognitive functions (Bonetti et al., 2019). Additionally, studies such as (Holloway, 2010) suggest that features related to symbolic processing appear earliest on the left side compared to non-symbolic processing, reflecting increased involvement of the left brain areas in tasks involving symbolic information search consistent with the results of this study.
It is noteworthy that, following FDR correction on the nodes, only a subset of ROI regions passes the correction. This indicates that the local connectiv- ity features of R1, T5, and R8 are more discriminative. This suggests that the upper half of the posterior lateral cortex plays a crucial role in the task process, which is in agreement with the findings of Carrieri et al. (Carrieri, et al., 2018). However, it does not imply that only the features of these nodes can be used to distinguish working states. Considering the activation of mul- tiple nodes comprehensively may provide a more accurate assessment of the brain’s state.
Previous studies often utilized zero-order or first-order features such as single-channel mean slope with a tendency for time lag (Heger, 2013; Herff, 2014). This study attempted to extract additional features from HBO con- centration change data. The activated brain regions selected using the new features are shown in Figures 9, and are generally consistent with the traditionally extracted activated channel areas obtained by averaging single- channel values over 8–10 seconds. However, the changes in these features occur more rapidly, appearing as early as 2.5 seconds after the response. The features extracted in this study could expand the understanding of functional
A Potential Rapid Detection of Cognitive Status in the Brain: An fNIRS Study 209
connectivity and cortical activation compared to traditional methods within the brain network.
CONCLUSION
In this study, to rapidly ascertain the brain’s state during task execution, we introduced a specialized local connectivity feature tailored for the search task. This feature is derived from Pearson correlation coefficients, reflecting the degree of mutual association within specific regions of the brain. Regions and time windows adapted to this feature were selected, and statistical analyses were conducted. The results revealed that under cognitive-executive condi- tions, bilateral dorsolateral prefrontal cortex and left ventrolateral prefrontal cortex were activated, and the emergence of this feature occurred within the first 2 seconds of the task. This novel feature proposed in our study appears faster compared to traditional features, enable the judgment of early tasks, and is expected to be used for identifying the brain’s task states.
REFERENCES
Anokhin, A. P. (2004). Genetics, prefrontal cortex, and cognitive control: A twin study of event-related brain potentials in a response inhibition task. Neuroscience Letters. Bendall, R. C. A., Galpin, A., Marrow, L. P., & Cassidy, S. (2016). Cognitive Style:
Time to Experiment. Frontiers in Psychology. Bonetti, L. V., & Hassan, S. A. (2019). Oxyhemoglobin changes in the prefrontal cortex in response to cognitive tasks: A systematic review. International Journal of Neuroscience. Carrieri, M., & Lancia, S. (2018). Does ventrolateral prefrontal cortex help in
searching for the lost key? Evidence from an fNIRS study. Brain Imaging and Behavior. Dong, Y., & Hu, Z. (2011). Driver inattention monitoring system for intelligent vehicles: A review. IEEE Transactions on Intelligent Transportation Systems, 12(2), 596–614. Fishburn, F. A., Norr, M. E., Medvedev, A. V., & Vaidya, C. J. (2014). Sensitivity of
fNIRS to cognitive state and load. Frontiers in Human Neuroscience, 8, Article 76. Ghouse, A. (2020). fNIRS Complexity Analysis for the Assessment of Motor Imagery and Mental Arithmetic Tasks. Entropy, 22(7), 761. Heger, D., & Mutter, R. (2013). Continuous recognition of affective states by
functional near infrared spectroscopy signals. In Affective Computing and Intelli- gent Interaction (ACII), 2013 Humaine Association Conference on (pp. 832–837). IEEE. Herff, C., Heger, D., Fortmann, O., Hennrich, J., Putze, F., & Schultz, T. (2014).
Mental workload during n-back task—quantified in the prefrontal cortex using fNIRS. Holloway, I. D. (2010). Common and segregated neural pathways for the processing of symbolic and nonsymbolic numerical magnitude: An fMRI study. NeuroImage. Li, G., & Baker, S. P. (2001). Factors associated with pilot error in aviation crashes.
Aviation, Space, and Environmental Medicine, 72, 52–58. Nguyen, T., & Kim, M. (2019). Investigation of brain functional connectivity in patients with mild cognitive impairment: A functional near-infrared spectroscopy (fNIRS) study. Journal of Biophotonics. First published on April 8, 2019.
Orellana, G. (2013). Executive Functioning in Schizophrenia. Frontiers in Psychiatry. Racz, F. S. (2017). Increased prefrontal cortex connectivity during cognitive challenge assessed by fNIRS imaging. Biomedical Optics Express, 8(8), 3842–3855. Yuan, Z., & Ye, J. (2013). Fusion of fNIRS and fMRI data: identifying when and
where hemodynamic signals are changing in human brains. Frontiers in Human Neuroscience, 7, Article 935.
LISTED IN THE AHFE DIGITAL BOOKSTORE CATALOGUE
Explore the complete digital volume
Neuroergonomics and Cognitive Engineering
Read this individual research paper free through the original publisher, or explore the full digital proceedings book.
ISBN 978-1-964867-02-1
Explore this ISBN in the AHFE Bookstore ↗Listed in the July 2026 bookstore catalogue; search by ISBN to confirm current availability · Digital book purchase optional