Diana Fotler, Klara Lorenz, Sven Matthiesen, Simon Saurbier (2024). Vibration Discomfort of Hand-Arm Vibration influenced by Energy Content, Frequency, Waveform and Exposure Duration. In: Human Interaction and Emerging Technologies (IHIET-AI 2024): Artificial Intelligence and Future Applications. AHFE Open Access, vol. 120. https://doi.org/10.54941/ahfe1004560
The ergonomics and user satisfaction when using technical systems, such as power tools like hammer drills, are greatly influenced by the perceived vibration. So far, the harmful effects of vibrations, based on frequency weighting equivalent to DIN EN ISO 5349-1, have been focused in the context of hand-arm vibration. However, the sense of discomfort caused by hand-arm vibration has not been considered so far. To address this research gap, a study was conducted using a full factorial experimental design with two levels of factors. The study aimed to explore the influence of energy content, frequency, waveform, and exposure duration on perceived discomfort caused by hand-arm vibration. Six subjects evaluated 16 different vibration patterns on a CP50 scale. To minimize potential confounding variables, the subjects were provided with blindfolds and in-ear hearing protection in the form of noise-cancelling headphones with white noise. Significant correlations were found between vibration discomfort and the factors of energy content, frequency, exposure duration, and waveform. These findings provide a solid foundation for further research on perceived discomfort caused by vibration, and subsequently, for enhancing the ergonomics and user satisfaction of technical systems.
Vibration Discomfort of Hand-Arm Vibration 105 usage involves frequencies ranging from 13 Hz to 2000 Hz. The most harm- ful frequencies are not necessarily the most discomfortable (Zimprich et al., 2021). Vibration frequency, considered in isolation, provides limited information about the human discomfort caused by hand-arm vibration, so it needs to be considered in combination with a state variable (Griffin, 2012). Therefore, further state variables of the hand-arm vibration and their influence on the sense of discomfort are considered in this work. In addition to the vibration frequency, the energy content is a relevant factor, which describes the energy that is emitted by the maximum amplitude of the acceleration. Another fac- tor that is not addressed in standards like DIN EN ISO 5349–1 is the impact of shocks on humans. The health sector has recognized the need to consider shocks as a factor of hazardous vibration (EN ISO 5349-1; Starck, 1984; Starck and Pyykkö, 1986). In terms of discomfort, shocks should also be con- sidered (Broyde et al., 1989). The duration of exposure to hand-transmitted vibrations is another factor that is considered in the health sector but also influences perceived discomfort (EN ISO 5349-1; Clevenson et al., 1978). The aim of this work is to explore the effects of four factors – vibration frequency, energy content, shocks, and exposure duration - on the sense of discomfort caused by hand-transmitted vibrations. This leads to the following research question:
How do vibration characteristics such as frequency, energy content, wave- form, and exposure duration influence perceived discomfort?
MATERIALS AND METHODS
To answer this research question, a laboratory study was conducted at the IPEK - Institute of Product Engineering at Karlsruhe Institute of Technology (KIT).
The following sections describes the selection of subjects, the measurement set-up and the study design.
Subjects The subjects were selected based on availability in order to have a group as homogeneous as possible. All subjects were right-handed, and the group consisted of two females and four males, aged between 23 and 32 years. The mean age of the subjects was 28.2 years (SD = 3.3), with an average body- weight of 82.2 kg (SD = 16.3) and an average height of 181 cm (SD = 9.3). Table 1 presents the specific anthropometric and demographic data of all subjects.
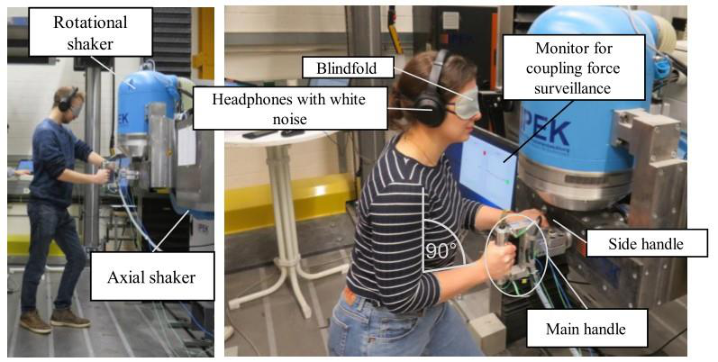
Measurement Setup The study was conducted at the user interaction test bench of the IPEK. The setup of the study environment is based on (Lindenmann et al., 2019). The test bench contains an electromagnetic shaker M124M (ETS Solutions Europe, Loffenau, Germany) which emits translational and rotational vibra- tions to a generic handle (see Figure 2). In this study, only vibration patterns
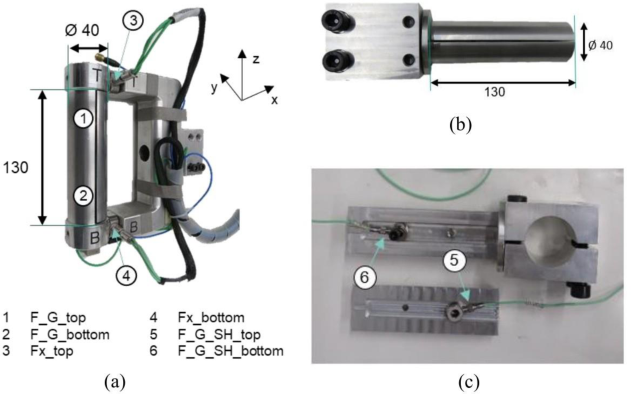
with translational excitation in x-direction were used. The vibrations were controlled by the vibration control system VR9500 (Vibration Research, Jenison MI, USA). For controlling the accelerations, they are measured bay acceleration sensors attached to the handle and reported back to the vibra- tion control system. The generic handle design was based on a hammer drill handle, consisting of a main handle (Figure 1a) and a side handle (Figure 1b). The side handle was attached on the left side of the main handle. The mea- surements for both handles were in accordance with DIN EN ISO 10819. Both handles were split and equipped with grip force sensors, as shown in Figure 1c. Additionally, the main handle featured push force sensors labelled as ‘T’ for ‘top’ and ‘B’ for ‘bottom’ in Figure 1a.
Table 1. Anthropometric and demographic data of all subjects (incl. mean values (Ø) and standard deviation (SD)).
Figure 1: (a) Main handle with force sensors (1, 2 for grip force; 3, 4 for push force), (b) side handle, (c) split side handle with visible force sensors (5, 6 for grip force).
Vibration Discomfort of Hand-Arm Vibration 107 Study Design
To investigate the influence of each individual factor on discomfort, a full factorial study design with two factor levels each was chosen. According to DIN EN ISO 5349-1, the highest frequency weighting occurs at 13 Hz, while the Pacinian corpuscle afferents in the human hand are most sensitive at approximately 315 Hz (Handwerker, 2006). Therefore, the factor levels of the frequency were chosen as 13 Hz and 315 Hz. The factor levels of expo- sure duration were 8 seconds and 32 seconds. For the factor levels of energy content, one level was set as energy content 1, while the other level, energy content 2, was four times higher than energy content 1. The formula used for calculating energy content assumed a constant mass m:
a 1
I \2 1/2/3/4 E1/2 =
2 · m · 2π ∗ f 13 315 (1) The factor waveform was divided into waveform 1, a constant sinusoidal vibration, and waveform 2, single shocks occurring one second apart but with the same maximum acceleration as in waveform 1. All vibration patterns, factor levels, and accelerations are presented in Table 2.
At the start of the study, the subjects were informed that the study aimed to assess the perception and rating of vibration patterns caused by various factors, although the specific factors were not disclosed. The variable dis- comfort was defined according to Zhang et al. (1996), as the strength of the unpleasant sensations caused by the vibration. Discomfort is associated with aspects of suffering, including pain, numbness, tingling and stiffness in the hand-arm area.
Figure 2: Components of the study.
During the study, the subjects were blindfolded and wore in ear hearing protection and over-ear headphones (SONY WH-100XM3) with noise- cancelling and white noise (approximately 65 dB), as depicted in Figure 2. The subjects rated the vibration patterns on a CP50 scale (Heller, 1982), which was chosen based on a meta-analysis by Ulherr and Bengler (2019) that identified this scale as the easiest for subjects to use when it comes to rating discomfort. The coupling forces, stance, as well as the hand and arm postures were predetermined and practiced in a trial phase before the study. Constant coupling forces of 50 N were specified for the pushing force and 30 N for the gripping force. In order to adjust the specified forces, the applied forces were monitored during the trial phase. The left foot should be placed in front. The posture of the right arm was set at a 90-degree angle. At the beginning, a reference vibration was provided to practice. During the study, the coupling forces were monitored, and the supervisor pointed out the subjects to adjust the forces if they deviated by 10 N for an extended period.
The 16 vibration patterns were randomized, and each subject went through two runs of the vibration patterns. The study results were analysed using Pear- son’s correlation, interpreted according to Cohen (1988) (Reynolds et al., 1977). In addition, the results were qualitatively analysed and graphically processed to look at changes in the discomfort ratings depending on the indi- vidual factor levels. The analysis was performed using IBM SPSS Statistics (Version 27, IBM, Armonk NY, USA).
RESULTS
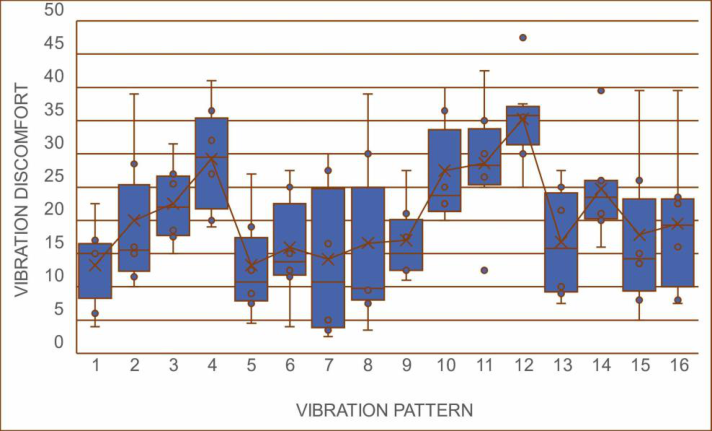
Figure 3 presents the results of the study visualized in a box plot. The x-axis shows the 16 different vibration patterns, while the y-axis indicates the rat- ing of vibration discomfort on the CP50 scale. There are 12 measuring points per vibration pattern: two for each of the six runs. The ratings exhibit notice- able variability. However, certain trends can be observed. Notably, vibration
Vibration Discomfort of Hand-Arm Vibration 109 pattern number 12 received the highest mean rating, while patterns 1 and 5 received relatively low ratings.
Figure 3: Rated vibration discomfort over the 16 vibration patterns.
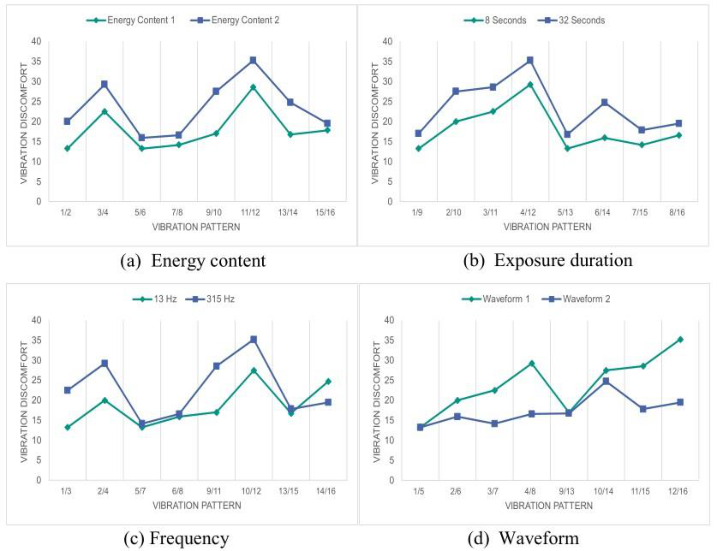
Figure 4 shows the influence of the four factors: energy content, frequency, waveform and exposure duration on the vibration discomfort at two lev- els each. To demonstrate the influence of each factor, the vibration patterns that share all factor levels, except the one being analysed, are overlaid. The corresponding vibration patterns are presented in table 3.
In the first diagram 4a, energy content 1 and 2 are overlaid. It is apparent that energy content 2 is rated higher in terms of discomfort compared to energy content 1. Vibration patterns 5/6, 7/8, and 15/16 are relatively close to each other compared to the other pattern pairs. All three of these pairs share waveform 2 as a factor. This suggests that the influence of energy content on discomfort may depend on the waveform.
Bravais-Pearson correlation analysis revealed a weak positive and signif- icant correlation between energy content and discomfort (r=.231; p=.001; N = 191). Specifically, for waveform 1, there was a moderate positive correlation with discomfort (r=.315; p=.002; N = 95). However, for waveform 2, there was no relationship observed between discomfort and energy content.
In the second diagram 4b, the two exposure durations are overlaid. It is evident that 32 seconds is rated higher in terms of discomfort compared to 8 seconds. Bravais-Pearson correlation analysis showed a weak positive significant correlation between exposure duration and perceived discomfort (r=.215; p=.003; N = 191).
Figure 4: Influence of the four factors on the vibration discomfort.Table 3. Overview of the 16 vibration patterns.
In the third diagram 4c, the two frequencies are overlaid. When examin- ing the pairs that include waveform 1 as a factor (1/3, 2/4, 9/11, 10/12), it is noticeable that 315 Hz received higher ratings in terms of perceived discom- fort compared to 13 Hz. When analysing the two waveforms separately, a moderate positive significant correlation between frequency and discomfort was observed for waveform 1 (r=.315; p=.002; N = 95), while no correlation was found for waveform 2.
In the fourth diagram 4d, the two waveforms are overlaid. The two graphs differ. Overall, it is evident that waveform 1 causes a 39% higher discomfort compared to waveform 2.
DISCUSSION
The results of this study highlight that various factors influence the perceived discomfort caused by vibrations. Although vibration frequency is commonly used to assess the potential health hazards of vibrations in the health sector
Vibration Discomfort of Hand-Arm Vibration 111 (EN ISO 5349-1), as an alone factor, it appears to be an insufficient predictor of the discomfort experienced by humans (Zimprich et al., 2021).
Influence of the Vibration Factors on the Discomfort The findings indicate that, apart from vibration frequency, factors such as exposure duration, energy content, and waveform also contribute to perceived discomfort.
Higher exposure durations were consistently associated with higher dis- comfort ratings. Interestingly, a study by Clevenson et al. (1978) reported a decrease in discomfort with increasing exposure duration, ranging from 15 seconds to 60 minutes (Clevenson et al., 1978). In contrast, it is important to note that the present study’s longest exposure duration was 32 seconds, which may hinder direct comparability to Clevenson et al.’s findings.
Energy content 2 was rated as more discomforting than energy content 1. This finding is consistent with the results of Reynolds et al. (1977), who also concluded that energy significantly contributes to discomfort (Reynolds et al., 1977). The waveform was also identified as another factor influencing perceived discomfort. In this study, a constant sinusoidal vibration was generally perceived as more discomforting than single shocks. Broyde et al. (1989) observed that high-impulse vibration in RMS procedures is often underesti- mated in terms of discomfort induced. Although, it’s important to note that the shocks, or waveform 2 in this study, were investigated independently and not superimposed with sinusoidal vibration, meaning they were not described as shock-containing vibration. Consequently, the findings of this study are not directly comparable to those of Broyde et al. (1989). To gain fur- ther insights, future research could examine scenarios involving overlapping sinusoidal vibrations with shocks.
Overall, this study provides valuable information about the factors influ- encing discomfort. However, further research is needed to explore and refine the relationships between these factors and perceived discomfort.
Placement of the Results Regarding the Application The aim of this study was to investigate vibration discomfort and its associa- tion with various vibration factors: energy content, frequency, waveform, and exposure duration. However, it is essential to acknowledge some limitations that might impact the interpretation of the results.
Firstly, the study had a small sample size, consisting of only six subjects. Such limited numbers may lead to fluctuations in the results, as discomfort is a highly subjective sensation, and each subject may have different reference points for maximum or minimum discomfort, leading to significant variation in the rating of the vibration patterns.
Secondly, the subjects’ inability to monitor their own coupling forces resulted in fluctuations in grip and push forces. As previous research has indi- cated, the intensity of coupling forces affects perceived discomfort (Revilla et al., 2021). Therefore, this factor likely influenced the discomfort ratings in this study.
Furthermore, the findings of this study may only be partially applicable to rating vibration discomfort during real power tool applications. Power tools emit random vibrations, while the vibration patterns examined in this study were more controlled and controlled for other external factors. Therefore, the controlled setting may not fully reflect the conditions and discomfort experienced during actual power tool use. Moreover, this study focused solely on haptic perception, whereas in real-world power tool usage, the primary focus is on the progress of the work. This work-oriented focus may mitigate some of the discomfort caused by vibration.
In conclusion, while this study provides valuable insights into vibration dis- comfort and its influencing factors, its application to real-world power tool usage requires further consideration of the differences in vibration patterns and the broader context of work-related factors.
CONCLUSION AND OUTLOOK In this study, the findings emphasize the factors that influence vibration dis- comfort. Vibration pattern number 12 received the highest discomfort rating, while patterns 1 and 5 were rated relatively low. Comparing energy content 2 to energy content 1, especially for waveform 1, showed higher discomfort levels. Additionally, exposure duration of 32 seconds caused more discom- fort than 8 seconds. Moreover, participants perceived the 315 Hz frequency combined with waveform 1 as more discomforting than 13 Hz. These results provide valuable insights into the relationship between different factors and vibration discomfort, opening avenues for further research.
For future investigations, it is recommended to include independent vari- ables with multiple factor levels, allowing for more accurate analysis of the relationship between vibration discomfort and these variables using multiple regression. Expanding the study participant pool and increasing data points would lead to more precise statements.
Considering that real-world power tool usage involves more random vibrations, future studies could examine the combined effects of sinusoidal vibrations and shocks to better represent actual scenarios and gain a deeper understanding of vibration discomfort in power tool applications.
Furthermore, the perception of discomfort at frequencies lower than 13 Hz, between 13 Hz and 315 Hz, and higher than 315 Hz requires fur- ther exploration. Conducting another study with a full factorial design and more than two factor levels would be beneficial in this regard.
While the study identified that higher exposure duration led to increased discomfort, the long-term trend of discomfort over time, including possible tolerance development, remains unclear. Investigating this aspect in future studies would provide valuable insights.
REFERENCES
Broyde, M., Donati, P., & Bitsch, J. (1989). Subjective Assessment of the Vibration Discomfort Produced by Different Hand Held Machines. Journal of Low Frequency Noise, Vibration and Active Control, 8(2), 50–61.
Vibration Discomfort of Hand-Arm Vibration 113
Clevenson, S. A., Dempsey, T. K., & Leatherwood, J. D. (1978). Effect of Vibration Duration on Human Discomfort (NASA Technical Paper 1283, Hrsg.). Dianat, I., Nedaei, M. & Mostashar Nezami, M. A. (2015). The effects of tool handle
shape on hand performance, usability and discomfort using masons’ trowels. Inter- national Journal of Industrial Ergonomics, 45, 13–20. https://doi.org/10.1016/j. ergon.2014.10.006 EN ISO, 5349–1 (Dezember 2001). Mechanische Schwingungen - Messung und Bewertung der Einwirkung von Schwingungen auf das Hand-Arm-System des Menschen. Berlin: Beuth Verlag GmbH. Griffin, M. J. (2012). Frequency-dependence of psychophysical and physiological
responses to hand-transmitted vibration. Industrial health, 50(5), 354–369. Handwerker, H. O. (2006). Somatosensorik. In F. Schmidt & H.-G. Schaible (Hrsg.), Neuro und Sinnesphysiologie (S. 203–228). Springer-Verlag. Heller, O. (1982). Theorie und Praxis des Verfahrens der Kategorienunterteilung
(KU). Würzburg: Universität Würzburg, Psychologisches Institut, Lehrstuhl III. Cohen, J. (1988). Statistical power analysis for the behavioral sciences (2nd ed.). Hillsdale, N. J.: L. Erlbaum Associates. Lindenmann, A., Heyden, E., Matthiesen, S., & Krause, D. Anpassbare Impedanzelemente für das Testing und die Validierung von Flugzeugkomponenten und handge- haltenen Power-Tools Adjustable Impedance Elements for Testing and Validation of Aircraft Components and Hand-Held Power Tools. Stuttgarter Symposium für Produktentwicklung SSP 2019. Revilla, J. A., Loh, P. Y., & Muraki, S. (2021). Effects of two grip force levels and
forearm postures on hand-arm transmitted vibration and physiological responses. Human Factors and Ergonomics in Manufacturing & Service Industries, 31(6), 679–692. Reynolds, D. D., Standlee, K. G., & Angevine, E. N. (1977). Hand-arm vibration, Part III: Subjective response characteristics of individuals to hand-induced vibration. Journal of Sound and Vibration, 51(2), 267–282. Starck, J. (1984). High impulse acceleration levels in hand-held vibratory tools. An
additional factor in the hazards associated with the hand-arm vibration syndrome. Scandinavian journal of work, environment & health, 10(3), 171–178. Starck, J., & Pyykkö, I. (1986). Impulsiveness of vibration as an additional factor in the hazards associated with hand-arm vibration. Scandinavian journal of work, environment & health, 12(4 Spec No), 323–326. Ulherr, A. & Bengler, K. (2019). How to Assess Sitting (Dis) comfort? – An Analy-
sis of Current Measurement Methods and Scales. In S. Bagnara, R. Tartaglia, S. Albolino, T. Alexander & Y. Fujita (Hrsg.), Proceedings of the 20th Congress of the International Ergonomics Association (IEA 2018) (Advances in Intelli- gent Systems and Computing, vol. 826, S. 566–575). Cham: Springer. DOI: 10.1007/978-3-319-96065-4_60 Zhang, L., Helander, M. G. & Drury, C. G. (1996). Identifying Factors of Comfort and Discomfort in Sitting. Human Factors: The Journal of the Human Factors and Ergonomics Society, 38(3), 377–389. https://doi.org/10.1518/ 001872096778701962 Zimprich, S., Germann, R., Helmstetter, S., Saurbier, S., & Matthiesen, S. (2021).
An Objective Rating Approach for Vibration Discomfort Evaluation in Power Tool Ergonomics – Examination of Higher Frequency Components. In T. Ahram, R. Taiar, K. Langlois & A. Choplin (Hrsg.), Human Interaction, Emerging Tech- nologies and Future Applications III (S. 84–90). Springer International Publishing.
LISTED IN THE AHFE DIGITAL BOOKSTORE CATALOGUE
Explore the complete digital volume
Human Interaction and Emerging Technologies (IHIET-AI 2024): Artificial Intelligence and Future Applications
Read this individual research paper free through the original publisher, or explore the full digital proceedings book.
ISBN 978-1-958651-96-4
Explore this ISBN in the AHFE Bookstore ↗Listed in the July 2026 bookstore catalogue; search by ISBN to confirm current availability · Digital book purchase optional