Ryunosuke Fukada, Kimi Ueda, Hirotake Ishii, Hiroshi Shimoda, Fumiaki Obayashi (2023). Object Combinations for Alternative Uses Test Suitable for 2-Condition Within-Participant Comparisons. In: Human-Centered Design and User Experience. AHFE Open Access, vol. 114, pp. 642–648. https://doi.org/10.54941/ahfe1004284
In recent years, creative thinking has been gaining importance. Creative thinking can be broadly classified into two types of thinking: divergent thinking, which generates a wide variety of ideas from a single concept or idea, and convergent thinking, which converges a wide variety of ideas into a single concluding idea [1]. Since improving the performance of divergent thinking leads to the good performance of creative thinking, many methods have been proposed to support divergent thinking. One of the representative methods to evaluate divergent thinking performance is the Alternative Uses Test (AUT) [2], a task in which participants are asked to respond to as many ideas for different uses of a presented object as possible. Measures of divergent thinking performance include fluency, flexibility, and originality, and when evaluating the AUT [3]. The AUT has been used in many studies because of the short time required to respond to tasks and the relative ease of evaluation. However, the performance of the AUT can vary greatly depending on the individual's experience with the presented object in AUT, and when conducting an AUT under multiple conditions, such as in a comparison experiment, differences in presented objects may have a greater impact on responses than differences between conditions. For these reasons, the AUT is not suitable for within-participant comparisons unless appropriate objects are chosen. Therefore, the purpose of this study was to select appropriate objects, to which the same participant shows similar responses, for within-participant comparisons. First, we listed 32 objects as candidates for appropriate objects for the AUT, which were then narrowed down to 16 through experiments with 4 participants. An experiment was conducted using these 16 objects. 32 undergraduate and graduate students participated in the experiment. They responded to the AUT on these 16 objects. In total, there were 3507 responses. Responses were independently validated by three evaluators and classified into 26 categories. Then, we calculated the quantity of responses to the AUT, and the AUT fluency score from the evaluated data, and conducted a 2-way ANOVA, which revealed that the performance of the AUT differed depending on the object. We examined combinations of objects with the lowest variance using standardized scores and suggested several combinations of objects suitable for within-participant comparisons.[1] J.P. Guilford, “The nature of human intelligence,” New York, McGraw-Hill,1967.[2] Guilford, J.P. “The Structure of Intellect”. Psychological Bulletin, 53(4), pp. 267-293. 1956.[3] Torrance, E. P.: The nature of creativity as manifest in its testing, The nature of creativity, pp. 43–75. 1988.
In recent years, the value of creative thinking in human intellectual work has been increasing with the rapid arrival of the information society. Guil- ford divided creative thinking into two broad categories: divergent thinking, which generates many diverse ideas from a single concept or problem, and convergent thinking, which derives a single concluding idea from many ideas (Guilford, 1967).
In research on divergent thinking, it is important to evaluate the per- formance of divergent thinking, and various evaluation tasks for divergent thinking have been proposed, such as TCT-DP (Urban, 2005), the prod- uct improvement test, and the incomplete figure test developed by Barron (Barron, 2008). One of the most famous divergent thinking evaluation tasks is the Alternative Uses Test (AUT) developed by Guilford (Guilford, 1956, Guilford, et al., 1978, Torrance, 1972), in which participants are asked to respond to as many ideas as possible about how to use the presented objects differently from how they were originally intended. For example, if a “sponge” is presented as an object, its original use is to be used for cleaning, etc., but alternative uses include “use as a base for fresh flowers” or “use as a
Object Combinations for Alternative Uses Test Suitable for 2-Condition 643
buffer to prevent furniture from damaging the floor”. The ideas are evaluated based on indicators such as fluency, flexibility, and originality.
Table 1. Objects presented.
Table available in the original PDF paper.
For Practice Task For Main Task Plastic shopping bag and Sponge
T-shirt, aluminum foil, washtub, bed sheet, plastic bottle, broom, pillow, chopping board, pencil, desk pad, splitable chopsticks, socks, paper cup, cardboard box, butterfly net, and baseball bat
Because of the short time required to respond to tasks and no special skills required for participants, AUT has been used in many studies. However, the performance of AUT can vary greatly depending on the objects presented. When AUT is conducted under multiple conditions, such as in comparative experiments, differences in objects may have a greater impact on responses than differences between conditions. For this reason, the AUT is not suit- able for within-participant comparisons unless an appropriate combination of objects is chosen. Therefore, in this study, experiments were conducted with undergraduate and graduate students to select objects with a focus on flexibility. Based on the experiment on AUT, this study aimed to select a suit- able combination of objects for a within-participant comparison of the two conditions.
METHOD
Overview An experiment was conducted to select an appropriate object combination. In the experiment, the experimental participants performed the AUT as an evaluation task; the AUT consisted of a practice and a main task. Two objects were presented in the practice task and 16 objects in the main task. After the experiment, three evaluators evaluated all AUT responses and calculated the AUT quantity of responses, fluency, and flexibility.
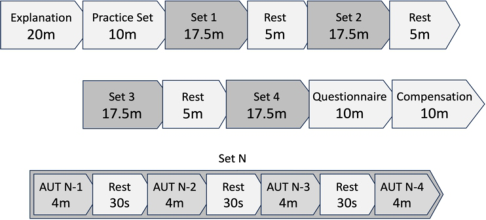
Measure In this study, the Alternative Uses Test (AUT) developed by Guilford was used as a task to evaluate divergent thinking. The objects presented in the practice and production tasks are shown in Table 1. These objects were selected from a list of 32 objects prepared in advance by the authors and narrowed down to 16 objects by excluding objects with AUT responses in a preliminary exper- iment with four participants. The example and main task were conducted for 4 minutes for each object. The order in which the objects are given was counterbalanced to reduce order effects with reference to the Latin square design.
In this experiment, the AUT quantity of responses, AUT fluency score, and AUT flexibility score (Torrance, 1988) were calculated from the responses obtained. The following describes the procedure for evaluating the AUT
quantity of responses, AUT fluency, and AUT flexibility. First, we determined whether each idea was valid as an AUT response. image1.pngundergraduate and graduate students at Kyoto University, and the final evaluation was deter- mined by consensus among the three after a discussion of the ideas that were classified differently.
Table 2. Criteria for determining the validity of each idea for the AUT.
Table available in the original PDF paper.
Validity Criteria
1. The idea must represent a different use than it was originally intended. 2. The idea must represent how the object will be used, regardless of feasibility 3. The idea must not duplicate other ideas the person has responded to on the object.
Table 3. Perspectives for classifying each idea for the AUT.
Table available in the original PDF paper.
Perspective 1 Perspective 2 Either as a material or as is.
How do ideas use object? Choose the most appropriate category from the 13 categories (Wearable items, Toys, Music & Musical Instruments, Furniture, Tools, Outdoor Sports, Kitchenware, Sanitary & Cleaning, Fuel, Vehicles, Stationery, Weapons, Packaging)
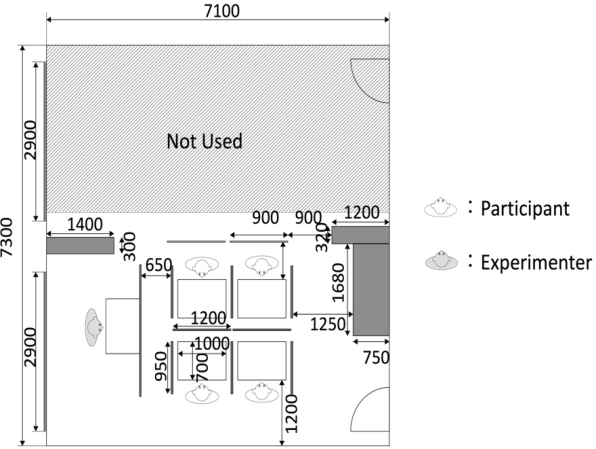
Figure 1: Layout of the experimental room.
Participant Participants in the experiment were 32 undergraduate and graduate students enrolled at Kyoto University who were at least 18 years old. All participants had Japanese as their native language and were able to type using a keyboard.
Object Combinations for Alternative Uses Test Suitable for 2-Condition 645
Figure 2: Protocol of the experiment.
Environment
Figure 1 shows the layout of the experimental room. To prevent surrounding items from giving hints to the participant performing the AUT, the partici- pant’s work desk was surrounded by 1800 mm partitions. The experimenter was seated at a desk that was out of sight of the participants, and the partici- pants were mentioned using a camera placed on the their desks. The lighting in the experimental environment was set so that the illuminance on the desk surface of the participants’ work desks was 200∼250 lx. Figure 2 shows the application screen during the AUT response.
Procedure The experiment was conducted with four participants in one group. The duration of the experiment was approximately 135 minutes. The experimen- tal protocol is shown in Figure 2.
Analysis In this experiment, performance was compared using the standardized AUT quantity of responses score (z-quantity), AUT fluency score (z-fluency), and AUT flexibility score (z-flexibility). Each score is calculated according to Equation (1), where xa is the score in object “a”, xn is the mean of the scores of participant “n”, and sn is the standard deviation of the scores of participant “n”.
Equation reproduced from the original PDF.
sn
RESULT & DISCUSSION Data from all 32 participants were used in the analysis. The means and stan- dard deviations of the AUT quantity of responses (quantity), AUT fluency score (fluency), and AUT flexibility score (flexibility) for each object are shown in Table 4, while the means and standard deviations of the standard- ized versions of these scores, z-quantity, z-fluency, and z-flexibility, are also shown in Table 5. As shown in Table 6, we conducted a two-factor repeated measures ANOVA on effects. Thus, it cannot be said that the AUTs’ perfor- mance across the 16 objects was equal. the conditions, and the result showed
a significant difference in the object factor. We did not find any significant differences in the order factor, and the interaction.
Table 4. AUT quantity of responses, fluency and flexibility scores by object.
Table available in the original PDF paper.
Quantity Fluency Flexibility Mean St Mean St Mean St
The eight objects with mean absolute values of z-quantity closer to zero are shown in Table 7, and a multiple Turkey test revealed no significant dif- ferences between them in Table 7. Therefore, these items can be expected
Object Combinations for Alternative Uses Test Suitable for 2-Condition 647
to perform almost identically in terms of the AUT quantity of responses, making them suitable for within-object comparisons. Similarly for the AUT fluency score and flexibility scores, the eight items in Table 7 do not include any significantly different sets of items. Therefore, the combinations of items in Table 7 are suitable for within-participant comparisons in terms of AUT fluency and flexibility scores. When conducting two-condition within- participant comparisons, these objects can be divided into two object groups which are used as objects of AUT in experimental and control condition, to achieve appropriate within-participant comparisons. Table 6 shows the appropriate combination of objects for each score. The optimal object com- bination based on which score is selected may be chosen based on the hypothesis of the experiment or other factors.
Table 6. F-value and P-value for each score obtained by analysis of variance.
Table available in the original PDF paper.
z-Quantity z-Fluency z-Flexibility
F P F P F P Object 6.188 4.303×10⁻¹¹ 6.020 9.589×10⁻¹¹ 5.820 2.495×10⁻¹⁰ Order 1.182 2.859×10⁻¹ 1.300 2.020×10⁻¹ 1.228 2.508×10⁻¹
Table 7. Candidates for appropriate subject combinations based on each standardized score.
Table available in the original PDF paper.
Score Objects Combination quantity T-shirt, pillow, broom, desk pad, splitable chopsticks, chopping board, baseball bat, bed sheet fluency T-shirt, pillow, broom, desk pad, washtub, splitable chopsticks, chopping board, baseball bat flexibility aluminium foil, desk pad, pencil, paper cup, cardboard box, washtub, chopping board, bed sheet
CONCLUSION
An experiment with 32 students was conducted in this study to select a suitable combination of objects for a two-condition within-participant com- parison. The results showed that the analysis of variance indicated that performance varied by object. Therefore, it may not be appropriate to con- duct a within-participant comparison of the two conditions without selecting an appropriate object. Therefore, based on each standardized score, eight objects were selected as a combination in order of absolute mean value close to zero. None of these trials were found to contain any pairs with significant differences in performance as indicated by Turkey’s multiple test. Thus, these are suitable object combinations for within-participant comparisons in the two conditions. When actually conducting an experiment using these com- binations, it is necessary to decide which score-based combination to choose
based on the hypothesis of the experiment or the expected result. It should be noted that the combinations proposed here may not adequately take into account the measurement sensitivity. If the measurement sensitivity is poor and the performance is the same under all conditions, then those object combinations are not suitable for within-participant comparison of the two conditions, since the differences between conditions cannot be observed. Fur- ther experimentation and analysis are needed to determine how to account for measurement sensitivity.
ACKNOWLEDGMENT
This work was supported by JSPS KAKENHI Grant-in-Aid for Young Scientists (A) Number JP23K16926.
REFERENCES
Barron F. X. (1958), The Psychology of Imagination, Scientific American, Volume 199, pp. 151–168. Guilford, J. P. (1956). The Structure of Intellect. Psychological Bulletin, Volume 53 No. 4, pp. 267–293. Guilford, J. P. (1967) The nature of human intelligence, in McGraw-Hill series in
psychology, New York: McGraw-Hill (Ed.). Guilford, J. P., Christensen, P. R., Merrifield, P. R., & Wilson, R. C. (1978). Alternate uses: Manual of instructions and interpretations. Orange, CA: Sheridan Psychological Services. Torrance, E. P. (1972). Predictive validity of the Torrance Tests of Creative Thinking.
The Journal of Creative Behavior, Volume 6 No. 4., pp. 236–252. Torrance, E. P. (1988). The nature of creativity as manifest in its testing. In R. J. Sternberg (Ed.), The nature of creativity: Contemporary psychological perspectives, Cambridge University Press, pp. 43–75. Urban K. K. (2005) “Assessing creativity: The Test for Creative Thinking - Drawing
Production (TCT-DP) International Education Journal, Volume 6 No. 2.
LISTED IN THE AHFE DIGITAL BOOKSTORE CATALOGUE
Explore the complete digital volume
Human-Centered Design and User Experience
Read this individual research paper free through the original publisher, or explore the full digital proceedings book.
ISBN 978-1-958651-90-2
Explore this ISBN in the AHFE Bookstore ↗Listed in the July 2026 bookstore catalogue; search by ISBN to confirm current availability · Digital book purchase optional