Ryunosuke Fukada, Kimi Ueda, Hirotake Ishii, Hiroshi Shimoda (2024). Temporal Analysis Method to Visualize Changes in Alternative Uses Test Performance. In: Intelligent Human Systems Integration (IHSI 2024): Integrating People and Intelligent Systems. AHFE Open Access, vol. 119, pp. 213–218. https://doi.org/10.54941/ahfe1004485
In recent years, creative thinking has been gaining importance. Creative thinking can be broadly classified into two types of thinking: divergent thinking, which generates a wide variety of ideas from a single concept or idea, and convergent thinking, which converges a wide variety of ideas into a single concluding idea. One of the representative methods to evaluate the performance of divergent thinking is the Alternative Uses Test (AUT), a task in which participants are asked to respond to as many ideas for different uses of a presented object as possible. There are several measures of divergent thinking performance, including fluency, flexibility, and originality, and the AUT has been evaluated by scoring the number and variety of ideas and the degree of rarity of ideas as scores for each measure respectively. Although the AUT has been used in many studies because it is easy to implement, most of these studies only evaluated performance throughout the entire AUT, making it difficult to analyze performance from a temporal perspective, such as adding stimuli to the person working on the AUT or changing the environment or conditions under which the AUT is performed, to evaluate the effects of changes in the environment, or to evaluate the impact of changes in environment and conditions on performance. With regard to flexibility in particular, it was difficult to quantify in detail the quality of ideas from the perspective of flexibility at a given point in time or to evaluate the breadth of thinking, because all participants' responses were categorized using the conventional method. Therefore, the purpose of this study is to propose a method to analyze fluency and flexibility from a temporal perspective. For the analysis of the temporal perspective, we focused on performance in intervals of AUT task time subdivided into 30-second intervals. Fluency was calculated from the number of responses in the unit interval. Flexibility was calculated by applying the flexibility method proposed by the authors (Fukada, et al. 2023), which employs natural language processing, to quantify the dissimilarity between ideas answered at a certain point in time and those answered before that point in time, in order to evaluate the quality of ideas in terms of flexibility at that point in time. An experiment was conducted with 32 undergraduate and graduate students, and the data of 3507 responses they obtained working on 16 trials of AUT, each of which lasted 4 minutes, were included in the analysis. When these data were analyzed using the proposed method, performance tended to monotonically decrease after the second interval, but fluency and flexibility increased from 30 to 60 seconds before the end of the AUT trial. This follows the suggestion that moderate time pressure has a positive impact on divergent thinking performance.Fukada, R., Ueda, K., Ishii, H., Shimoda, H., Obayashi, F., A Study on a Method for Automated Evaluation of Flexibility of Alternative Uses Test, Proceedings of the 85th National Convention of IPSJ, No.4, pp.129-130.
In recent years, with the rapid arrival of the information society, the value of creative thinking in human intellectual work has been increasing. Guil- ford divided creative thinking into two broad categories: divergent thinking, which generates many diverse ideas from a concept or problem, and conver- gent thinking, which derives a concluding idea from many ideas (Guilford, 1967). In research on divergent thinking, it is important to evaluate the perfor- mance of divergent thinking, and a variety of divergent thinking evaluation tasks have been studied. One of the most representative divergent thinking evaluation tasks is the Alternative Uses Test (AUT) developed by Guilford (Guilford, 1956, Guilford et al., 1978, Torrance, 1972), in which partici- pants are asked to respond to as many ideas for different uses of the presented objects as possible. For example, if a “sponge” is presented as an object, its original use is to be used for cleaning, etc., but alternative uses include “as a base for fresh flowers” or “as a buffer to prevent furniture from damaging the floor”. The performance measures of divergent thinking include fluency, flexibility, and originality, and when evaluating AUT, the number and vari- ety of ideas and the degree of scarcity have been evaluated as scores for each measure (Torrance, 1988).
Although the AUT has been used in many studies because it is easy to implement, past studies have mainly evaluated only the performance of the AUT as a whole, and have rarely attempted to analyze it from a temporal perspective and evaluate its performance at a certain point in time. Analyti- cal methods that focus only on performance as a whole make it difficult to analyze performance from a temporal perspective and assess how responses at a given point in time were affected, even if the people working on the AUT were stimulated or the environment or conditions under which they worked on the AUT were changed.
Therefore, the purpose of this study is to propose a method for analyzing AUT fluency and AUT flexibility from a temporal perspective. After propos- ing a method for analyzing AUT fluency and AUT flexibility from a temporal perspective, we analyzed experimental data on humans to see if it is possi- ble to confirm changes in divergent thinking performance from a temporal perspective using the proposed method and to confirm the validity of the proposed method.
TEMPORAL ANALYSIS METHOD In order to analyze performance changes in divergent thinking from a time- based perspective, this study attempted to divide task time into units of tens of seconds and to calculate the performance score in unit intervals. In this study, the length of the unit interval was set to 30 seconds based on the time spent answering the AUT in previous experiments. For example, analyzing 4 minutes of AUT responses would mean dividing the 4 minutes into 8 inter- vals and evaluating performance in that unit interval. The scores for fluency and flexibility in that unit intervals are calculated. For fluency, the number of responses in that interval was used. For flexibility, we used an automatic eval- uation method for flexibility proposed by the authors (Fukada et al., 2023). This method employs natural language processing techniques to obtain an estimate of flexibility by comparing an idea at a given point in time with a conventional idea answered by the same person as that idea, calculating the semantic distance between them, and adding a score representing how much the idea is not similar to the conventional idea. The results are used to estimate the flexibility of the idea. This method reduces the possibility of the evaluator’s subjectivity having a significant impact on the results and also allows for a more detailed evaluation of how much the idea increased the flexibility score than when the flexibility score is calculated using the number of types classified manually.
EXPERIMENT In order to confirm whether the proposed method allows us to observe changes in divergent thinking performance from a time perspective, we con- ducted an experiment on human participants and conduct an analysis on the data.
Temporal Analysis Method to Visualize Changes in Alternative Uses Test Performance 215
Table 1. Objects presented.
Table available in the original PDF paper.
For Practice Task For Main Task plastic shopping bag and sponge
T-shirt, aluminum foil, washtub, bed sheet, plastic bottle, broom, pillow, chopping board, pencil, desk pad, splitable chopsticks, socks, paper cup, cardboard box, butterfly net, and baseball bat
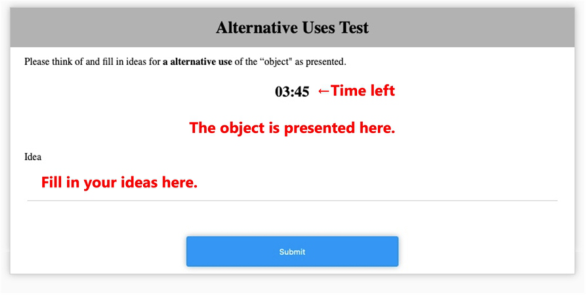
Figure 1: Screen display of application for AUT.
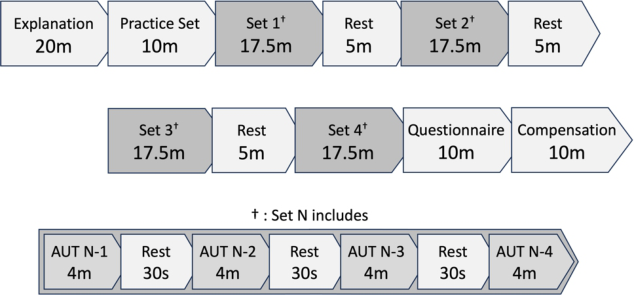
In this study, participants worked on AUT on a web application. The screen display of the application for answering tasks is shown in Figure 1. The num- ber of objects presented in the AUT was 2 for the practice task and 16 for the main task. These objects are listed in Table 1. Participants were given 4 minutes per object, with a 30 second or 5 minute break between each trial. The responses obtained were used to calculate fluency and flexibility per unit of time in the method described above. They participated in the experiment with the procedure shown in Figure 2.
Figure 2: Protocol of the experiment.
32 undergraduate and graduate students at Kyoto University participated in this experiment. They are native Japanese speakers and can type on a keyboard. They participated in this experiment with a reward of 3,000 yen.
RESULT
For the analysis in this experiment, data from participants with even a single object that had zero responses were invalidated. After processing the invalid data, all 32 participants’ data were included in the analysis.
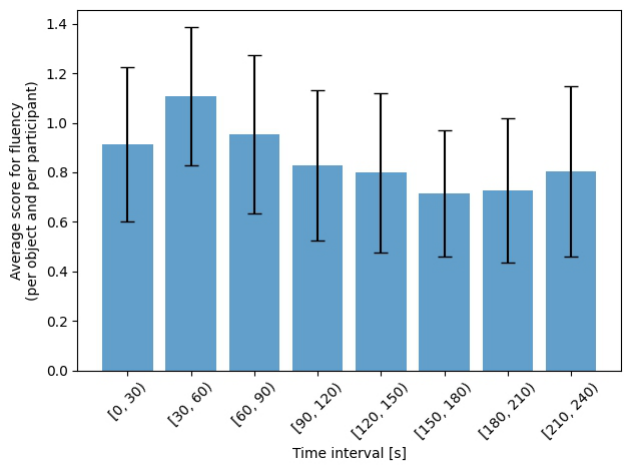
Fluency in 30-second intervals is shown in Figure 3. The vertical axis represents the average scores for fluency in that 30 seconds per object per participant. As shown in Figure 3, the overall trend is a large increase up to the second interval, followed by a monotonic decrease. However, it can be seen that the trend turns to an increase in the last 30 seconds.
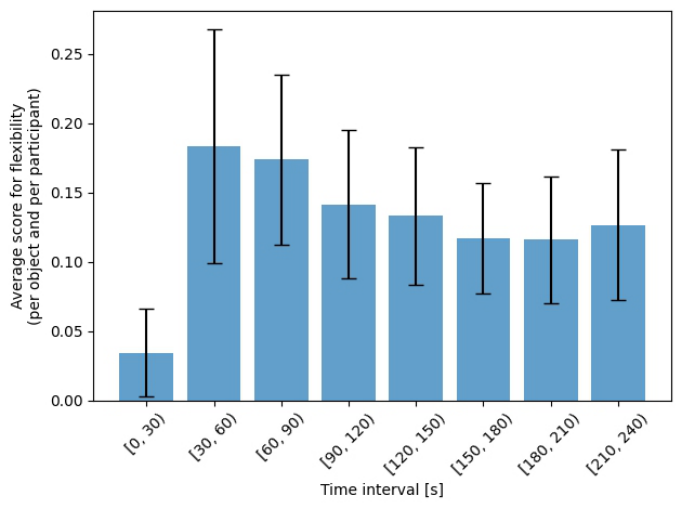
Flexibility in 30-second intervals is shown in Figure 4. The vertical axis represents the average scores for flexibility in that 30 seconds per object per participant. However, care should be taken when comparing this graph with the fluency graph. In the flexibility evaluation using the method proposed in the study, the first idea is calculated with the amplification of the flexibility score as 0, because there is no previous idea and no object for comparison. Therefore, in the first 30 seconds of the section, there are many first ideas, and since they do not add up to a score, the flexibility scores is small. Hence, the meaning is different from that shown in Figure 3 of fluency and cannot be simply compared. Figure 4 shows that the overall trend of flexibility is a significant increase at the beginning, followed by a monotonic decrease. Furthermore, in the last 30 seconds, the trend turned to an increase.
Figure 3: Average score for fluency (per object, per participant) in each interval.
Temporal Analysis Method to Visualize Changes in Alternative Uses Test Performance 217
Figure 4: Average score for flexibility (per object, per participant) in each interval.
DISCUSSION AND CONCLUSION In this study, we proposed a method for analyzing fluency and flexibility from the temporal perspective. Using this method, we analyzed the results of experiments on human subjects and were able to visualize the trends in fluency and flexibility per unit time as shown in Figure 3, and Figure 4. The large increase in fluency/flexibility in the first two intervals, as shown in Figure 3 and Figure 4, can be attributed to the fact that at the beginning, one can easily access the ideas that he/she comes up with at the ready. However, after easily accessible ideas are generated, it gradually becomes more difficult to come up with new ideas. Therefore, the overall trend was a monotonically decreasing increase in fluency and flexibility after the second interval.
Baer et al., suggested that there is an inverse U-shaped relationship between time pressure and creativity (Bear et al., 2006), and that performance may improve under appropriate time pressure. Based on their suggestions, the increasing trend in the last interval indicates that time pressure had a positive impact on the participants. In summary, it is an advantage of the proposed methodology that it can provide detailed insight into these changes in perfor- mance over time. This method also makes it possible to discuss the impact of changes in environmental conditions and stimuli on performance over time.
This study has several limitations. The first is the unit interval setting. In this study, the unit interval was set to 30 seconds based on the results of previous experiments. If this unit interval is made too long, the incremental trend in the last interval in this study may not be visualized, and if it is made too short, there may be intervals in which no ideas are answered at all. Further
study of how long it takes for each idea to be answered should be done to establish the length of this unit interval.
Another limitation concerns the way flexibility was assessed: as mentioned in a reference to the results, this study assumed that the first idea amplifies the flexibility score by 0. Therefore, it is difficult to simply compare the graphs for fluency and flexibility. It may be possible to analyze fluency and flexibility in a consistent method by evaluating the range of amplification of flexibility scores in a non-zero method, such as by comparing this first idea with the original usage.
ACKNOWLEDGMENT
This work was supported by JSPS KAKENHI Grant Number JP23K16926.
REFERENCES
Baer, M., Oldham, G. R. (2006). The curvilinear relation between experienced creative time pressure and creativity: Moderating effects of openness to experience and support for creativity. Journal of Applied Psychology, Volume 91, No. 4, pp. 963–970. Fukada, R., Ueda, K., Ishii, H., Shimoda, H., Obayashi, F., A Study on a Method for
Automated Evaluation of Flexibility of Alternative Uses Test, Proceedings of the 85th National Convention of IPSJ, No. 4, pp. 129–130. Guilford, J. P. (1956). The Structure of Intellect. Psychological Bulletin, Volume 53, No. 4, pp. 267–293. Guilford, J. P. (1967) The nature of human intelligence, in McGraw-Hill series in
psychology, New York: McGraw-Hill (Ed.) Guilford, J. P., Christensen, P. R., Merrifield, P. R., & Wilson, R. C. (1978). Alternate uses: Manual of instructions and interpretations. Orange, CA: Sheridan Psychological Services. Torrance, E. P. (1988). The nature of creativity as manifest in its testing. In R. J. Stern-
berg (Ed.), The nature of creativity: Contemporary psychological perspectives, Cambridge University Press pp. 43–75.
LISTED IN THE AHFE DIGITAL BOOKSTORE CATALOGUE
Explore the complete digital volume
Intelligent Human Systems Integration (IHSI 2024): Integrating People and Intelligent Systems
Read this individual research paper free through the original publisher, or explore the full digital proceedings book.
ISBN 978-1-958651-95-7
Explore this ISBN in the AHFE Bookstore ↗Listed in the July 2026 bookstore catalogue; search by ISBN to confirm current availability · Digital book purchase optional