Abdul Khalique (2023). Utilising state of the art eye tracking equipment to improve outcomes for maritime watchkeeper's on nocturnal navigational watches. In: Human Interaction & Emerging Technologies (IHIET 2023): Artificial Intelligence & Future Applications. AHFE Open Access, vol. 111, pp. 388–401. https://doi.org/10.54941/ahfe1004045
The International Regulations for Preventing Collisions at Sea (IRPCS) require a ship's Officer of the Watch (OOW) to maintain a proper lookout at all times. This includes looking out of the window as well as monitoring information via Multi-Function Displays (MFDs) that are found on the modern-day ship's bridge. These displays lead the OOW to spend time interrogating their various menus and functions to seek required information, thus distracting them from their primary task of maintaining a lookout. This paper identifies the function of the human eye in performing the lookout function during the hours of darkness. State of the art Eye Tracking Devices (ETDs) are utilised to collect eye movement data in both real-world and simulator-based ship bridges, and this is used to identify the impact that MFDs have at night in reducing the eye's effectiveness in the watchkeeping task. A novel scanning pattern is presented that can be adopted by OOWs to make the best use of the eye's physiology, improving lookout effectiveness at night and reducing the distraction caused by MFDs. This paper aims to assist OOWs in making better use of their eyes, enabling them to maintain optimum lookout performance during the hours of darkness.
With 65% of ship collisions resulting from improper lookout (MAIB, 2004), the maritime industry continues to indicate the lack of effective watchkeeping as a major contributing factor in numerous accidents. Whilst it is easy to say that eyes looking out of the bridge window are the best close-range navigati- onal equipment, the increasing use of technology means that the attention of watchkeepers is being trapped within the bridge, often without them being aware of it.
According to the International Convention on Standards of Training, Cer- tification and Watchkeeping for Seafarers (STCW) Code (IMO, 2017) “the
Utilising State of the Art Eye Tracking Equipment to Improve Outcomes 389
relieving officer shall ensure that the members of the relieving watch are fully capable of performing their duties, particularly as regards their adjustment to night vision”. The Code does not however specify how this is to be achie- ved, leaving it up to individual legislatures to interpret the requirements and devise guidance for watchkeepers (Wynn, Howarth, and Kunze, 2012). Con- sequently, whilst there is some general guidance available, seafarers are not specifically taught about the science behind dark adaptation and the consequ- ences of not following a scientific approach to achieving and maintaining it. Every watchkeeper must always follow a method of “scanning” which beco- mes essential for maintaining a proper lookout at night ensuring adequate ‘dark adaptation’ at all times. Whilst every watchkeeper could design their own preferred method of scanning, not all of these will make best use of the eye’s physiology at night. This paper aims to make a contribution by establi- shing whether the experienced seafarers apply any scanning pattern during their watches, whether the MFDs found on modern day ship’s bridges serve as a source of distraction during these watches, and if utilising a recognised scanning method at night improves the watchkeepers efficiency.
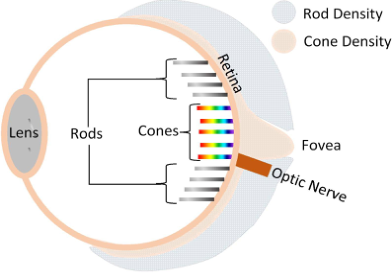
THE STRUCTURE OF THE HUMAN EYE The basic structure of the eye is shown in Figure 1 (Fernandez-Torres, 2019). There are two types of photoreceptor cell in the retina. These are commonly referred to as cones and rods estimated at 5–6 million cones and 80–90 mil- lion rods in each eye (CHIRP, 2017). When light is reflected from an object and received by the human eye, the collected ‘information’ is processed by photoreceptor cells. The average luminance at which the eye can see ranges from 0.000001 (10−6) cd/m2 on dark nights to 100,000,000 (108) cd/m2
during a bright sunny day (Boyce, 2003).
Figure 1: The structure of an eye.
Photopic Vision Cones recognise colour (certain frequencies of light which are not present in darkness) and detail (when light is reflected from an object) to provide ‘photopic vision’ (Nigalye et al., 2022). Most of the cones are clustered in
the Fovea, which is situated at the centre of the retina, and provides the eye’s sharpest vision as well as the colour perception.
Cones are further divided into three sub-types based on their ability to sense the colour- red, green, or blue. A mixture of these provides the ability to distinguish thousands of different colours. Cones function in luminance levels of above 3 cd/m2 (AOA, 2012), equivalent to a 50% moonlight evening (Kolb et al., 1995).
Scotopic Vision When presented with a luminance level of below 0.003 cd/m2 (Nigalye et al., 2022), the second type of cells (rods) provide ‘scotopic vision’. Located surrounding the fovea, rods can only distinguish colours as sha- des of grey. However, this is not a major inconvenience in low-light conditions.
Duplex System The duplex system consisting of cones and rods allows the eye to provide visibility over a range of ambient light levels. However, in order to see in the dark, eyes need to shift their focus from using cones to rods, this takes time. The photopigment Rhodopsin plays an essential role in this process as it activates adjustment of rods to low light conditions (Williams, 2020; Lamb and Pugh, 2004). This process is known as ‘dark adaptation’ and may take longer in some people depending upon their eyesight, age, fitness, and level of fatigue (Lamb, and Pugh, 2004). Regardless of these variable factors, research suggests that the full adjustment to night vision requires as long as 30 minutes (Wynn, Howarth, and Kunze, 2012; Nigalye et al. 2022). However, scotopic vision improves from 5 minutes into the process of dark adaptation (AOA, 2012).
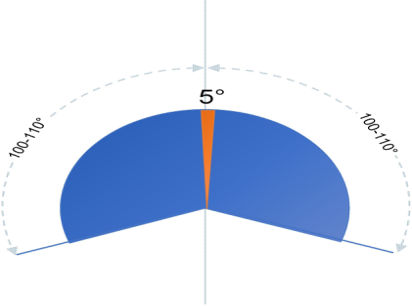
Peripheral Vision Foveal vision spans from right in front of the eyes to 2.5 degrees either side. Whereas peripheral vision covers 100-110
either side of the eye’s central point of fixation (Figure 2).
For a normal eye, foveal vision provides 20/20 visual acuity. Whereas, within the peripheral arc, visual acuity is in the region of 20/200 (Salmon, Pol and Rash, 2009). Despite a significant reduction in visual acuity, peri- pheral vision assists in detecting large objects, or objects that are in motion, without providing details, shape, or colour of the object.
When dark adaptation is complete, foveal vision is unavailable but peri- pheral vision is extremely useful in the detection of faint light sources such as the navigational lights of other vessels – a function vital for performing an optimal lookout. Whilst conducting a lookout at night the watchkeeper should rely upon the use of their peripheral vision due to the foveal night-time blind spot. The watchkeeper must therefore look between 5-10
either side of an object if they wish to see it. This can only be achieved if the watchkeeper does not search for objects in the foveal region but instead scans the areas adjacent to it. Moving the head in 10-degree blocks will allow the peripheral vision to scan the field of view and detect objects.
Utilising State of the Art Eye Tracking Equipment to Improve Outcomes 391
Figure 2: The central and peripheral field of vision (Khalique, Bury, Blanco-Davis, 2023).
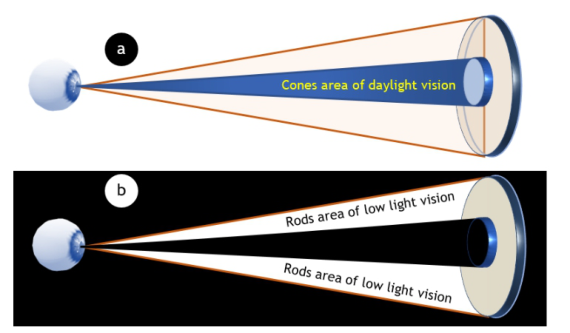
Utilising the Eye’s Structure During Night-Time Watchkeeping In darkness, the foveal cluster of cones is ‘unavailable’ for vision through an area approximately 5 to 10 degrees wide. Therefore, the focus of an indivi- dual’s vision must be off centred to ‘spot’ an object with rods in the regions shown in Figure 3. This is because the central part of retina cannot detect an object if looked at directly due to the night-blind spot in the rods area of vision. This must form part of night-time scanning for watchkeepers. A shift of the focus of vision by 10 degrees to one side will ensure that rods can be fully utilised and the night blind spot avoided (Nave, 2016). Further, the head should remain in continual motion to overcome any issues of missing a target object due to it being located within the blind spot.
FACTORS TO CONSIDER From a watchkeeper’s perspective, when maintaining a lookout at night, two factors need to be considered. These are, achieving the initial adaptation
Figure 3: Day vs night vision.
of the eyes to a low-level working environment and then maintaining that adaptation throughout the watchkeeping activity.
Initial Ocular Adaptation to the Low-Level Light Working Environment Upon initially entering the wheelhouse the watchkeepers’ eyes don’t see any- thing. This is the time at which dark adaptation commences. The dark adaptation process depends upon the light-sensitive receptor protein, Rho- dopsin. In order to quicker facilitate the eyes’ adaptation to functioning in a low-level light environment, watchkeepers are advised to spend ‘some time’ in a room illuminated by red light prior to entering the bridge (CHIRP, 2017). This is because light in the red wavelengths does not trigger the photoblea- ching of Rhodopsin. As rods are not sensitive to the red-light wavelength, Rhodopsin continues to promote dark adaptation. However, this approach only works with dim monochromatic (single frequency or wavelength) red light and not a white fluorescent light bulb covered with a red liner, coating or filter (Wynn, Howarth, and Kunze, 2012).
Difficulties Maintaining Ocular Adaptation to the ‘Low-Level’ Light Working Environment When a watchkeeper’s vision moves from a dark object onto a light one, such as when focusing on an MFD (e.g., an Electronic Chart Display and Infor- mation System (ECDIS) display using multiple colours) the eyes begin the process of adjusting for ‘light adaptation’. Part of this process is that Rho- dopsin becomes increasingly photo bleached and Opsin begins the activation of the cones. If this focus remains on an MFD for more than 5 - 7 minutes, the cones will have adjusted fully to the light level displayed by the MFD (AOA, 2012). As much as 30 minutes will then be required for the regeneration of Rhodopsin to once again establish dark adaptation. This is why it is vital that watchkeepers are aware of the level of luminance on their bridge at all times as this will allow them to identify its impact on their eyes’ ability to effectively function.
The International Hydrographic Organization (IHO, 2014) requires, for an ECDIS display, at night when so little luminance is tolerated that “area colours are reduced to shades of dark grey (maximum luminance of an area colour is 1.3 cd/m2 compared with 80 cd/m2 for bright sun)”. The maximum luminance of an area colour of 1.3 cd/m2 allowed by IHO falls in to the 0.003 cd/m2 to 3 cd/m2 range meaning that despite a watchkeeper adjusting the ECDIS luminance to the minimum design level, it will still be above the Scotopic vision luminance of less than 0.003 cd/m2. This is further compli- cated by the fact that the combined luminance of the various MFDs typically found on a ship’s bridge (e.g., engine and communication controls) will incre- ase the prevailing luminance of the watchkeepers working environment. With this being the case, there is the very real possibility that an OOWs eyes will never achieve full dark adaption throughout the entire duration of their watch.
Utilising State of the Art Eye Tracking Equipment to Improve Outcomes 393
Without a doubt the lack of assessment that has been conducted regar- ding the impact of bridge lighting and display illumination, particularly that originating from MFDs, on the watchkeeper’s ability to achieve and main- tain their eyes in a state of dark adaptation is a major flaw amongst existing shipboard systems. The International Maritime Organisation’s (IMO) perfor- mance standards for Radar, ARPA and ECDIS (IMO, 19995a, 1995b, 1996, 2004, 2006, 2017a) require that “information is clearly visible to more than one observer in the conditions of light normally experienced on the bridge of the ship by day and by night”. Classification societies such as Lloyds Register (LR) and Bureau Veritas (BV) may apply these rules with their own twist (BV, 2016) but IMO requirements are the minimum. To control ligh- ting on the bridge of the ship, including that from Visual Display Unit (VDU) or MFDs, IMO provides various requirements (IMO, 2000). For example, during the daytime, the VDU background luminance range must be between 15-20cd/m2 and VDU display luminance must have a range of 80-160cd/m2. But these IMO specifications do not provide a clear min/max luminance at night which is where the luminance level causes problems for maintaining a proper lookout. In this respect, the summary of IMO requirement for the amount of light emitted at night is that there must be:
A satisfactory level of lighting to complete such tasks as maintenance, chart and office work satisfactorily, both at sea and in port.
Visual alarms on the navigating bridge should not interfere with night vision.
All information should be presented emitting as little light as possible.
Displays should be capable of being read.
Until these shortfalls are addressed, a risk assessed approach to scanning is required that manages the OOW’s time spent viewing the MFDs deployed on a ship’s bridge.
DATA COLLECTION UTILISING EYE TRACKING DEVICES (ETDS) Eye Tracking Devices (ETDs) have been used in the aviation, road transport, market research and medical sectors to study visual scanning behaviour and attention allocation (Skvarekova and Scullery, 2019). In this case, SensoMo- tric Instruments (SMI) Eye Tracking Device (ETD) was utilised to capture participants’ eye movement data as they participated in watchkeeping duties.
Scenario Four independent scenarios were considered. In the first two scenarios (D1 and D2) participants were not given any guidance on how to scan:
Data collection 1 (D1) - All MFD screens were turned off. The collected data to be used to determine if there is an existing ‘natural’ scan pattern in participants’ (n:30) eye movement when maintaining a visual lookout through the bridge window.
Data collection 2 (D2) – The MFDs were displayed as they would be used during a navigational watch. It was expected that, due to the presence of MFDs on modern bridges (and the source of potential distraction that they represent to the watchkeeper’s ability to maintain an effective lookout
through all available means) the time an OOW (n:30) would spend looking out of the window would be far less than that in D1.
In the next scenario (D3), a data collection exercise was conducted onboard a ship in a real-world navigational setting:
Data collection 3 (D3) – This was conducted to validate the simulator- based data collection scenarios. To reveal whether there was an existing ‘natural’ scan pattern in participants’ eye movement when maintaining a lookout for real. However, the target positions and own ship’s course and speed experienced, during the four 4-hour watches utilised, were variable as they were not under the control of the research team.
With data from both ‘real world’ and simulator-based scenarios having been collected a further simulator-based scenario was devised within which a preferred scan pattern had been introduced to allow outcomes to be compared:
Data collection 4 (D4) – For the third simulator-based scenario, partici- pants (n:30) were provided with guidance on how to utilise the ‘Window Wiper Scanning Pattern’ prior to commencing the exercise. This scena- rio was then utilised to assess the impact of introducing a scan pattern to participants within the simulator-based training exercise.
Throughout the various data collection exercises a record was kept of the time in the exercise at which each participant sighted the target vessel. A median value of these was derived for each exercise. The median was utilised instead of the mean as the median is less distorted due to outliers.
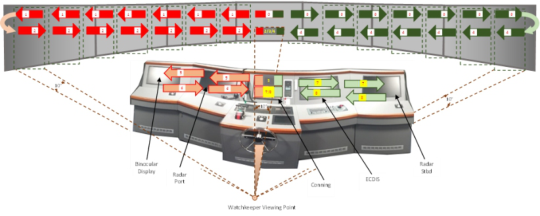
WINDOW WIPER SCANNING TECHNIQUE After a brief presentation on the physiology of the eye and its ability to function in low-light settings, the participants of data collection exercise 3 (D3) were briefed on the ‘window wiper scanning method’ (Figure 4). The watchkeeper commences the scan in the visual field’s central block. Then they move their vision towards the port side of the vessel, focusing for a period of no more than 4 seconds on each 10
block. After reaching the last block on the port side, resume the journey back to the centre block, spending no more than 4 seconds in each 10
block and then the same cycle is repeated for starboard side followed on by MFDs. Once an appropriate amount of time has been spent viewing the instrument panels inside the bridge, the external scan process should be resumed.
The watchkeeper’s eyes may require several seconds to refocus when swi- tching between items on the bridge and outside of the window. Vision should initially be focused on the centre block of the visual field, until the eyes have refocused, before commencing the external scan.
Searching in sectors of 10
and focusing on each sector for no more than 4 seconds means spending a maximum of 168 seconds (2m 48s) to scan back and forth across a 210
window field of view. With 9 MFDs - requiring a 4 seconds scan back and forth each – a maximum of 72 seconds (1m 12s) should be spent scanning inside the bridge This time sharing gives a ratio
Utilising State of the Art Eye Tracking Equipment to Improve Outcomes 395
Figure 4: ‘Windscreen Wiper’ scanning (Khalique and Bury, 2022).
between window screen and MFDs of 2.3:1 which is somewhat higher than that recommended for the aviation industry of 6:1 (CAA, 2013). Neverth- eless, the proposed 4 seconds do not include any additional time that may be required to attend to an identified object or information captured from MFDs that requires attention.
DATA ANALYSIS The BeGaze software version 3.7 (January 2017) supplied by SensoMotric Instruments (SMI) was used to process ETD data that was collected.
Scan path plots were created for all participants using Semantic Gaze Map- ping (Koffskey, 2014). This involved mapping the eyes fixation to a reference image for each stimulus. Gridded Areas of Interest (AOI) in BeGaze were then utilised to export ‘Scan path Strings’ into Microsoft Excel to create ‘scan path sets’ for the thirty individuals who participated in the simulator-based data collection exercises which could then be analysed to compare the differences in each participant’s ocular behaviour whilst maintaining a lookout.
By capturing a participant’s eye movement, the sequence in which they looked at particular areas of the bridge was established. This allowed any search patterns that they adopted to be identified (Blascheck, and Ertl, 2014). However, tracking eye movement alone is not sufficient to fully understand a watchkeeper’s behaviour. Therefore, a combination of related methods was applied to gain a greater degree of insight into each watchkeeper’s behaviour (Gomez, Main, Viviani, 2014; Gotz and Zhou, 2009; Guo et al., 2016; North, 2006). This took the form of the triangulation of data (Cohen, Manion, and Morrison, 2000) from gaze path, duration of fixation and saccades.
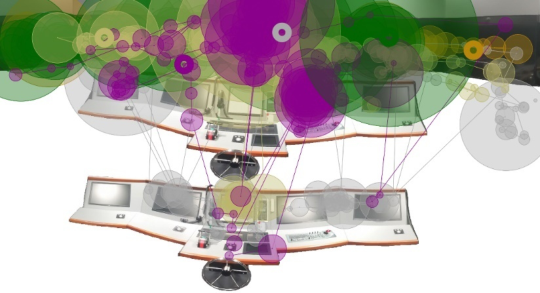
A quantitative and qualitative data analysis approach as also pursued by Sullivan et al. (2011) to analyse the scan patterns of helicopter pilots. In order to analyse the visual scan patterns, the ‘raw’ eye tracking data nee- ded to be simplified (Peysakhovich and Hurter 2018). This was necessary as the heat maps identify the area of a participant’s focus, gaze plots show fixation points as circles with their diameter increasing with the number of fixations in each location. The order of fixations is obtained when the scan path is played back necessitating the need to opt for aggregation of the data gathered in various formats. In essence, neither the heat maps nor gaze plots
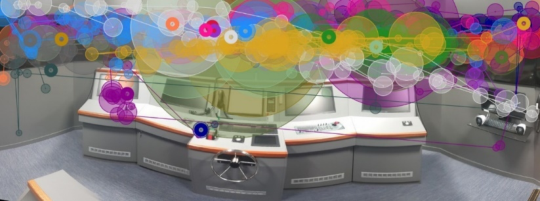
provide an easy-to-understand output due to areas being cluttered with data (Figure 5).
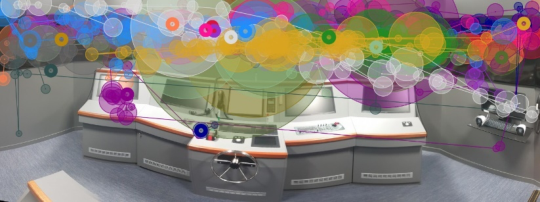
Figure 5: Scan path plot - no equipment, 30 participants.
As a consequence, once the data was assessed by way of the triangulation method, infographics were produced. Analysis of these through the applica- tion of the visual aggregation technique (Peysakhovich and Hurter 2018) was then possible to reduce visual clutter and provide a mathematical basis for scan path comparison. The scan paths for participants gathered in all data collection scenarios were then compared using a similarity map approach (Le Meur and Baccino, 2013).
RESULTS
Through the combined data assessment, processing and subsequent analysis, it was established that participants did not initially apply any pattern to scan the external surrounds of their vessel and internal bridge environment. This was found to be the case across both simulator-based data collection exercises (D1 and D2) and in real-world data collection (D3). More specifically:
Data collection 1 (D1) – Scan paths showed that participants’ gaze moved randomly, jumping from one AOI to another without following any sequence but most of their time was spent looking out of the window (Figure 6).
Figure 6: Scan path plot - no equipment, 30 participants (only 30 seconds shown to avoid cluttering).
Utilising State of the Art Eye Tracking Equipment to Improve Outcomes 397
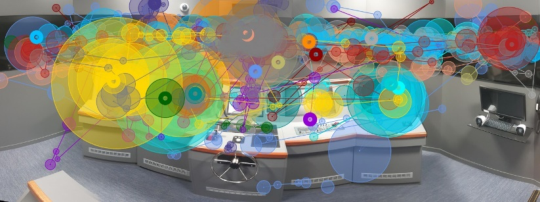
Figure 7: Scan path plot - all equipment, 30 participants (only 30 seconds shown to avoid cluttering).Figure 8: A single individual, real world, representative scan path plot.
Data collection 2 (D2) – Scan paths showed that participants’ gaze moved randomly, jumping from one AOI to another without following any sequ- ence. However, on this occasion most of their time was spent looking at the MFDs (Figure 7).
Data collection 3 (D3) – The scan paths captured on a real ship validated the scan pattern data captured in the simulator. Observed during four 4- hour watches, participants’ gaze moved randomly, jumping from one AOI to another without following any sequence (Figure 8). However, in the real world more time was spent looking at the MFDs than out of the window.
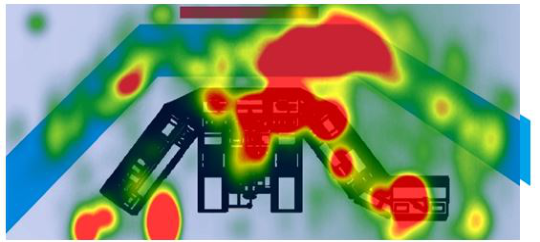
Data collection 4 (D4) – Participants followed the scanning pattern that they had been presented with. As a result, their gaze moved in a more organised fashion from one AOI to the next (Figure 9). Although partici- pants spent more time looking out of the window than at the MFDs, this was performed at a ratio of just over 2:1.
When attempting to spot a vessel with a poor radar return, the sooner the watchkeeper sees it the more time they have to respond. Therefore, the lower time value represents the better outcome from the simulator-based scenarios. In data collection exercise 1 (D1) all the watchkeepers attention was focused on the single, visual task of locating the target vessel. With that being the case, it was not surprising to find that the vessel in question was sighted the quickest, at a mean value of 15 minutes and 37 seconds. In D2, with the added complexity of bridge equipment being introduced, the participant’s attention is split between looking out of the window and looking at the MFDs, as a
Figure 9: Scan path plot - all equipment, 30 participants (only 30 seconds shown to avoid cluttering).
result the mean value of time taken to see the other vessel increased to 22 minutes 42 seconds.
Data collection exercise 3 (D3) was conducted in a non-standardised envi- ronment with target positions, own ship’s course and speed being variable. With these variables not being under the control of the research team it was impossible to collect any meaningful data regarding when a given vessel was spotted. However, D4 was a very different matter. With the task involving both equipment and visual aspects to monitor, the mean value should be similar to that found in D2. This was not the case. After receiving training on the physiology of the human eye, along with guidance on how to utilise the ‘Window Wiper Scanning Pattern’, with the participant’s attention split between the window and the MFDs, but following an organised scan pattern, the mean value in D4 was 17 minutes 52 seconds. A significant improvement on the 22 minutes 41 seconds value found in D2.
CONCLUSION
This paper investigated whether, any trend exists in the visual scanning pat- tern applied by experienced seafarers during night-time watches, whether the MFDs found on modern day ship’s bridges serve as a source of distraction during these watches, and if utilising a recognised scanning method at night improves the watchkeepers efficiency. Utilising state of the art eye tracking equipment for data collection found that watchkeepers have no preferred scanning technique. This was the case in both simulator-based scenarios and real-world situations. However, after the provision of training regarding the structure of the human eye and how to make the most efficient use of it, watchkeepers became more efficient at the task of spotting other vessels.
Watchkeepers should treat their eyes like any other precise instrument that they utilise as part of their work. The physiology of the eye means that it functions differently at night than during the day. With this being the case, a period of adjustment needs to be allowed for before commencing a night watch. It takes up to 30 minutes of exposure to low light conditions for
Utilising State of the Art Eye Tracking Equipment to Improve Outcomes 399
dark adaptation to be fully achieved but less than one second of bright light to lose full adaptation. This should be taken into account on a night-time watch, particularly when inspecting details on a MFD such as the ECDIS. Looking at an MFD in ‘night-time mode’ for as little as 5 minutes will also result in dark adaptation being lost and require a further 30 minutes of low light conditions to re-establish it in full.
It is essential that acceptable luminance levels for the bridge, as well as each MFD, are established by a suitable authority as soon as possible. Until then, whilst maintaining a lookout at night, the basic proposed procedure for window wiper scanning provides a useful mechanism for effectively utilising the watchkeeper’s peripheral vision whilst at the same time protecting their night-vision. As a result, watchkeepers are recommended to utilise the win- dow wiper scanning technique to make optimal use of the eye’s physiology and optimise their eyes dark adaptation to ensure that their ‘night vision’ is best preserved.
FUNDING This research was funded by Maritime Research and Innovation, United Kingdom (MarRI-UK).
ACKNOWLEDGMENT
Mr Kamil Kaminski, LJMU Senior IT Technician who supported the simula- tions, data capture and data analysis throughout the project.
AUTHOR CONTRIBUTIONS Research, data collection, data analysis, writing. Abdul Khalique Research, data collection, data analysis, review and editing. Alan Bury Review and editing. Eddie Blanco-Davis
REFERENCES
AOA (2012). American Optometric Association: The Eye and Night Vision. [Online https://www.aoa.org/x5352.xml] [Accessed 26/12/2022]. Blascheck, T., Ertl, T. (2014). Towards analyzing eye tracking data for evaluating
interactive visualization systems. In Proceedings of the BELIV Workshop: Beyond Time and Errors – Novel Evaluation Methods for Visualization, pp. 70–77. Boyce, P. R. (2003) Human Factors in Lighting. Taylor & Francis, London. BV (2016). Bureau Veritas – Rule Note NR 633. SYS-NEQ-OSV. [Online https://er ules.veristar.com/dy/data/bv/pdf/633-NR_2016-03.pdf] [Accessed 30/12/22]. CAA (2013) Safety Sense Leaflet No 13 - ‘Collision Avoidance’. UK Civil Aviation
Authority. CHIRP (2017) Perception, Decision Making and Fatigue at Sea. CHIRP Maritime, Bishops Printers, Portsmouth. Cohen, L., Manion, L. and Morrison, K. (2000). Research Methods in Education.
5th Edition, Routledge Falmer, London. Fernandez-Torres, M. Á. (2019) Hierarchical Representations for Spatio-Temporal Visual Attention Modeling and Understanding. Universidad Carlos III de Madrid.
Gomez, M., Main, P. Viviani, P. (2014) Sensitivity to evidence in Gaussian Bayesian networks using mutual information. Information Science. Vol. 275, pp. 115–126. Gotz, D., Zhou, M. (2009). Characterizing users’ visual analytic activity for insight
provenance. Information Visualization. Vol. 8(1), pp. 42–55. Guo, H., Gomez, S. R., Ziemkiewicz, C. Laidlaw, D. H. (2016) A case study using visualization interaction logs and insight metrics to understand how analysts arrive at insights. IEEE Transactions on Visualization and Computer Graphics, Vol. 22(1), pp. 51–60. Holmqvist, K., Nyström, M., Andersson, R., Dewhurst, R., Jarodzka, H., & Van de
Weijer, J. (2011). Eye tracking: A comprehensive guide to methods and measures. OUP Oxford. IHO (2014). Specifications for Chart Content and Display Aspects of ECDIS – Publication S-52. International Hydrographic Organization. IMO (1995a). Performance Standards for Electronic Chart Display and Information
Systems (ECDIS). Resolution MSC 817(19). London, United Kingdom. IMO (1995b). Performance Standards for Automatic Radar Plotting Aids (ARPAs).
Resolution MSC 823(19). London, United Kingdom. IMO (1996). Adoption of New and Amended Performance Standards (Includes IBS).
Resolution MSC 64(67). London, United Kingdom. IMO (2000). MSC/Circ.982 - Guidelines on Ergonomic Criteria for Bridge Equipment and Layout. IMO, London. IMO (2004). Adoption of the Revised Performance Standards for Radar Equipment.
Resolution MSC.192(79). London, United Kingdom. IMO (2006). Adoption of The Revised Performance Standards for Electronic Chart Display and Information Systems (ECDIS). Resolution MSC 232(82). London, United Kingdom. IMO (2017) The International Code on Standards of Training, Certification and
Watchkeeping [STCW] A-VIII/2 Part 3–1, Paragraph 19. International Maritime Organization, London. IMO (2017a). ECDIS – Guidance for Good Practice. MSC.1/Circ.1503. London, United Kingdom. Jackson, G. R., Owsley, C. McGwin, G. Jr. (1999) Aging and dark adaptation. Vision
Res. Vol. 39 (23): pp. 3975–3982. Khalique, A., Blanco-Davis, E. Bury, A. (2023) The Maritime Six Pack – Lookout Awareness of Distractions through Creation of a Distraction Evaluation Ratio. Submitted on 29th March 2023 to Journal of Navigation, awaiting peer review/publication. Khalique, A., Bury, A. (2022). Scanning: from screen to scene: Using the ‘wind-
screen wiper’ technique to maintain a proper lookout by sight. Featured Article, Seaways: The International Journal of the Nautical Institute, November 2022 [Online] Available at: https://www.nautinst.org/resources-page/scanning-from-sc reen-to-scene.html [Accessed: 31st December 2022]. Koffskey, C. M. (2014). Using eye-tracking to investigate strategy and performance of expert and novice control room operators (Thesis). Louisiana State University and Agricultural and Mechanical College. Kolb, H., Fernandez, E., Nelson, R. (1995). The Organization of the Retina and
Visual System. Salt Lake City (UT): University of Utah Health Sciences Center; [Online https://www.ncbi.nlm.nih.gov/books/NBK11525/] [Accessed 29/12/22]. Lamb, T. D., Pugh, Jr. E. N. (2004). Dark adaptation and the retinoid cycle of vision.
Progress in Retinal and Eye Research, Volume 23(3), pp. 307–380. Le Meur, O., Baccino, T. (2013). Methods for comparing scan paths and saliency maps: strengths and weaknesses. Behavioural Research, Vol. 45, pp. 251–266.
Utilising State of the Art Eye Tracking Equipment to Improve Outcomes 401
MAIB (2004) Bridge Watchkeeping Safety Study. Southampton: Marine Accident Investigation Branch. Nave, C. R. (2016) Hyper Physics: Light and Vision. [Online Available at: ht
tps://hyperphysics.phy-astr.gsu.edu/hbase/vision/visioncon.html [Accessed: 27th December 2022] Nigalye, A. K., Hess, K., Pundlik, S. J., Jeffrey, B. G., Cukras, C. A., Husain, D. (2022) Dark Adaptation and Its Role in Age-Related Macular Degeneration. Journal of Clinical Medicine. Vol. 11(5), 1358. North, C. (2006). Toward measuring visualization insight. IEEE Transactions on
Computer Graphics and Applications, Vol. 26(3), pp. 6–9. Peysakhovich V, Hurter C. (2018). Scan path visualization and comparison using visual aggregation techniques. Journal of Eye Movement Research. Vol. 10(5):9. Salmon, T. O., Pol, C. V. D., Rash, C. E. (2009) Helmet mounted Displays: Ch. 7 -
Visual Function. [Online Available at: https://usaarl.health.mil/assets/docs/hmds /Section-14-Chapter-7-Visual-Function.pdf] [Accessed: 31st December 2022]. Skvarekova, I., Scullery, F. (2019). Objective Measurement of Pilot’s Attention Using Eye Track Technology during IFR Flights. Transportation Research Procedia. Vol. 40, pp. 1555–1562. Sullivan, J., Yang, J. H., Day, M., & Kennedy, Q. (2011) Training Simulation for
Helicopter Navigation by Characterizing Visual Scan Patterns. Aviation, Space, and Environmental Medicine, Vol. 82(9), pp. 871–878. Williams, D. E. (2020). Human Factors in Air Transport Understanding Behavior and Performance in Aviation. Springer International Publishing. Wynn, T., Howarth, P., Kunze, B. (2012) Night-time Lookout Duty: The Role of
Ambient Light Levels and Dark Adaptation. Journal of Navigation. Vol. 65, pp. 589–602.
Read this individual research paper free through the original publisher, or explore the full digital proceedings book.
ISBN 978-1-958651-87-2
Explore this ISBN in the AHFE Bookstore ↗Listed in the July 2026 bookstore catalogue; search by ISBN to confirm current availability · Digital book purchase optional