Minh.Tuan Nguyễn-Thiên, Minh.Anh Nguyễn-Đức, Kenneth Y.T. Lim (2023). Designing for the investigation of microclimate stressors and physiological and neurological responses from the perspective of maker culture. In: Human Interaction & Emerging Technologies (IHIET 2023): Artificial Intelligence & Future Applications. AHFE Open Access, vol. 111, pp. 356–365. https://doi.org/10.54941/ahfe1004042
The 2021 United Nations Climate Change Conference (COP26) resulted in the Glasgow Climate Pact. Initial work in the study reported in this paper investigated relationships between environment and physiological measurements using smartwatches, and self-designed bespoke environmental modules which are wearable around the waist. Data from this initial phase was analysed with a Random Forest regression model. The next phase of this project involves neurophysiological measurement, specifically electroencephalography (EEG). EEG was introduced to the model to explore how the changes in environmental or biometric measurements correlate with changes in neurophysiological measurements. In this latter phase, EEG data is viewed as an independent data type that is distinct from environmental and other physiological data. The headset model used to record EEG data is again a bespoke hand-made design, comprising a combination of biosensing board and electrodes from OpenBCI and widely available items like adhesive tapes and staples. A subsequent step involved validation of this DIY EEG headset data against research grade equipment, of which the analysis of different features of EEG data have shown to be of statistically comparable trends. For data collection, all data recorded is stored in Google Drive; Python is used to synchronize, pre-process data and train regression models. The first headset prototype was assembled in mid-October 2021, and was tested and developed in early November. From mid-November to late January 2022, the authors wore the devices for one to two hours per day to collect data. For EEG data, eight channels were recorded, basic filters (bandpass and notch) and REST re-referencing are applied. In this project, EEG time-series are used as input in regression models with other data types as output. Two regression models were trained then compared, the first being convolutional neural network with pre-built architecture and the other being a Random Forest model with features extracted from EEG time-series. Inferences are made from the models using open-source interpreters, with an eventual aim to infer how one's local environment might impact one's emotions and health. The results suggest that sound level, carbon dioxide concentration, and dust concentration feature more importantly in the regression models trained on collected datasets. These factors were continually associated with high feature importance scores in the EEG data signal and in both the objective scores recorded from the electronic instruments and the more subjective self-report forms. Furthermore, it was found that visual stimulus and problem processing, in terms of information, touch, and spatial relationships, are the most influential factors affecting the participants' physiological well-being in this research. Most recently, one aspect that is currently being investigated is electrodermal activity (EDA). EDA is marker of sympathetic network activity (Zangróniz et al., 2017). As such, it is an indication of human stress and emotion arousal, (Rahma et al., 2022). It is hoped that analyses of EDA data will further strengthen the emerging model describing the intersections between local microclimate and physiological and neurological stress. Early validation experiments comparing DIY EDA devices against research-grade Empactica E4 sets have shown promising results.
Designing for the Investigation of Microclimate Stressors 357
INTRODUCTION
This paper reports a trajectory of work in which a multidisciplinary approach was adopted at the intersection of environment, human physical health and mental well-being. In view of sustainability, affordability and citizen science, Do-It-Yourself (DIY) EEG sensors were designed and built from a citizen sci- ence approach to collect brainwave data daily. DIY EDA wristbands were also built to collect Electrodermal activity (EDA) data. Overall, there were four types of data collected, namely, biometric, environmental, EEG and EDA data. All these data types were continuously collected from July 2021 to March 2023.
Among other prior studies, our inspiration came from Palme and Salvati (2021), who concluded that modified urban microclimates had a profound impact on the comfort of the inhabitants. Therefore, given our situation and perspective, this study aimed to explore the relationships between local environmental stressors and physiological responses from the perspective of citizen science. With a view to democratizing the collection and usage of such data for the investigation of these relationships, the authors were also devoted to optimising the extent to which the quality of self-collected data would be comparable to that from industrial grade sensors. It is hoped that with this approach, the potential contributions of our work can be a demon- stration of the utility and viability of low-cost, self-designed, wearable units for measuring microclimate, EEG and EDA. The relatively low cost of these wearables has positive implications for the affordance of the scalability and— consequently—on crowd-sourced citizen science in this as yet under-reported field of the relationships between microclimate and well-being.
METHODOLOGY
Microclimate Data Collection A portable, small device was self-designed and built using low-cost sensors and readily available materials. The compact device is capable of measuring: Noise level, Infrared radiation through light intensity, The amount of dust, Carbon dioxide concentration, Temperature, Relative humidity, Air pressure. Since the size of the device is relatively small, it is worn around the waist by participants during data collection.
Other than the types of microclimate data above, the device would also ping the nearest publicly accessible weather station, provided by the Singa- pore Meteorological Service, for wind direction and wind speed prevailing at that time. It is programmed such that the device would automatically log its measurements onto a designated cloud-based spreadsheet every five minutes.
Health (Biometric Data) and Mental State Data Collection Biometric data were collected using Huawei Honor Band 6 smartwatches and Fitbit Sense smartwatches. Specifically, heart rate, oxygen saturation, skin temperature at the wrist and root mean square of successive differences between successive beat-to-beat intervals were measured and used by the smartwatches to calculate stress score and heart rate variability.
Encephalographic (EEG) Data Collection With citizen science weighing heavily in our methodology, the costs derived from the experimentation and data collection should be minimal. Therefore, a DIY EEG headset frame was self-designed and built and customized to each participant using common household items, namely sponges and tapes. In addition to the built frame of the headset, IDUN Dryodes were used as sensors to measure and collect EEG data.
For more specific information on our collection of EEG data, refer to our past work in 2022.
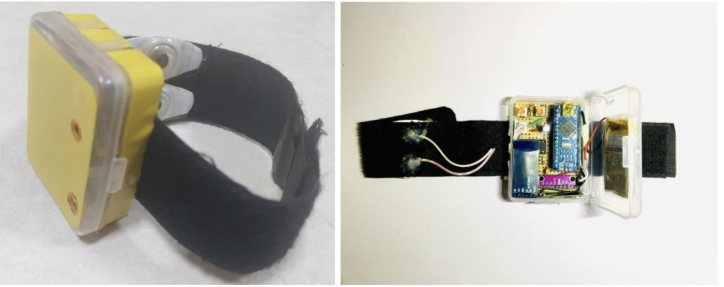
Collecting Electrodermal Activity (EDA) Data In this study, DIY EDA sensors were designed and built from a citizen science approach. The circuit was designed based on the hardware description as detailed in Zangróniz, et al., (2017). The input voltage is 3.3V from Arduino Nano which is the microcontroller used for the circuit. The sampling rate of the device is 10 Hz, and can go up to 25 Hz, depending on the experimental requirements. The DIY EDA device was designed to be worn on the wrist of the user, has a battery which lasts around ten hours and a bluetooth module allowing data to be transferred to computers or mobile devices.
For operational amplifiers, the LM324 unit with low noise of 35 nV/rtHz was used instead of AD8603. An external analog-to-digital converter ADS1115 with 16 bits resolution was also used. The electronic components were housed in a plastic container measuring 6.5 cm by 5 cm by 2.5 cm, as depicted in Figure 1.
The following are some relevant specifications of the DIY EDA electrodes:
ECG electrodes: Ag/AgCl coated with KCl-gel
Diameter: 0.80 cm
Area: 0.50 cm2
Current: 1.50 µA
Current to skin: 2.99 µA/cm2, below the 10 µA/cm2 recommendation.
Voltage to skin: around 0.30V for well-hydrated skin, below the 0.5 V recommendation.
Figure 1: Assembled EDA wristband.
Designing for the Investigation of Microclimate Stressors 359
Two ends of the plastic box were connected to two strips of velcro, allow- ing the user to fasten the device on their wrist. Reusable ECG electrodes were used as electrodes for the unit, they were positioned such that they made contact with the bottom left of the users’ wrist.
EDA data from the DIY wristband are to be validated against the research- grade Empatica E4. To compare the EDA data between the DIY devices and the Empatica E4, different stimuli were introduced during experimental ses- sions in which the DIY device was worn on the left wrist while the Empatica E4 was worn on the right wrist. ANOVA and F-tests were used along with visual inspections of the different features and components extracted from raw EDA signals to confirm the congruence between DIY EDA and Empatica EDA data.
Pre-Processing and Feature Extraction of Collected Data Python standard libraries such as Numpy, Sklearn, and Pandas were used to process data. z-score method for outlier detection was used to remove out- lier data. Firstly, a linear correlation was drawn between the environmental and biometric factors. Next, a random forest regression model was trained on the data to find the non-linear connections between the environmental factors and biometric factors. Shapley Summary Plot was subsequently used to interpret results of the random forest regression model.
For EEG data, raw EEG time series preprocessing went through the follow- ing steps: applying bandpass and bandstop filters on the time series, applying the reference electrode standardization technique (REST) or average refer- ence, and finally using independent component analysis to filter out artifacts in the feature extraction model. The EEG time series were cut into smaller windows (bins) and each of these is used to predict the immediate output sample before (or after) it. In the feature extraction model, five bands of spectral information of 0.5 – 4 Hz, 4 - 7 Hz, 7 - 12 Hz, 12 - 30 Hz, and 30 - 100 Hz were used. Different features were extracted from the EEG time series, for example Hjorth parameters, activity and complexity, were used for the random forest regression model.
In another aspect, EDA consists of a tonic and phasic component, repre- sented by skin conductance level (SCL) and skin conductance response (SCR), and is closely associated with the stress response and emotional response of humans, and can be measured in a non-intrusive manner (Rahma et al., 2022). Open access EDA processing Python libraries, such as pyEDA, EDA Explorer and PyEEG, were used to extract relevant tonic and phasic features of EDA data. EDA data of both the DIY sensor and the Empactica E4 were first resampled to a 4 Hz sampling rate. Each set of resampled data was then passed through a 32nd order Butterworth low-pass filter with a cutoff frequency of 1.5 Hz to remove artefacts, and subsequently normalised and smoothed with a moving average.
For the time domain, the non-specific skin conductance responses (NS.SCR) - the number of spontaneous rapid increases in skin conductance that surpass a threshold between 0.01 and 0.05 microSiemens - was calcu- lated. These metrics are calculated using methods of convex optimization for EDA (cvxEDA).
For the frequency domain, features relative to EDASymp, TVSymp (spec- tral powers in specific frequency bands) according to Posada-Quintero et al. (2016a, 2016b) and their normalised versions were focused on as they were found to be highly sensitive to orthostatic, cognitive, and physical stress according to Posada-Quintero et al., (2020).
In terms of time-frequency spectral analysis, the derivative of phasic component of EDA (dPhEDA), time-varying index of sympathetic activ- ity (TVSymp) and modified time-varying index of sympathetic activity (MTVSymp) were calculated.
ANOVA and F-tests were used along with visual inspections of the different features and components extracted from raw EDA signals to confirm the congruence between DIY EDA and Empatica EDA data.
Environmental Experiment Procedures and Data Analysis Process After EDA data from the DIY wristband had been validated against the research-grade Empatica E4, the DIY wristband was used in an environmen- tal experiment. A period of two hours was cut into eight 15-minute windows. Different combinations of microclimatic factors were controlled in each of the windows. Throughout the experiment, a DIY wristband was worn on the left wrist, while the subjects were presented with challenging programming tasks to maintain a high level of stress. EDA data from these windows (subse- quently referred to as ‘events’ in this paper) were compared with each other using the one-way F-test (ANOVA test) to verify whether there were signifi- cant differences among the EDA data groups. If the null hypothesis was later rejected, this would indicate that the DIY EDA wristband was indeed able to capture changes in electrodermal activity due to changes in the surrounding environment.
Using the FLIRT library (Föll et al., 2021), 21 different features of EDA data collected for each event were calculated. For both phasic and tonic com- ponents: energy, entropy, iqr, iqr_5_95, kurtosis, lineintegral, max, mean, min, n_above_mean, n_below_mean, n_sign_changes, pct_5, pct_95, peaks, perm_entropy, ptp, rms, skewness, std, sum, svd_entropy for each were calculated. A one way F-test was then applied on each feature for differ- ent combinations of events. All of the p-values of features, both of phasic and tonic components, were then added up and averaged to assess whether there are any strong correlations, similarities or differences between different events.
Two types of machine learning models were also trained to classify the data for each respective event. The first machine learning model was trained to classify data into events using NSSCR data. NSSCR data were divided into 60-second windows, with a 52.5 seconds window overlap, and one clas- sification input window included 40 consecutive NSSCR windows with a train-test split ratio of 5:5. Thus, each input window required about six min- utes of data. The second machine learning classification model used TVSymp data, where the classification model input were 20-second TVSymp windows with train-test split ratio of 3:7. The train-test split ratios were chosen as
Designing for the Investigation of Microclimate Stressors 361
the machine learning models were not designed to obtain accurate classifica- tions of the data, but rather to investigate whether there were closely related events (as suggested by the incorrectly classified data of the machine learn- ing model). This also allowed for further investigation on whether there was any relationship between the environment (as suggested through continu- ally changing the environmental condition in the experiment) and emotional arousal.
For DIY EEG headset data validation, the experimental procedure con- sisted of a total of 9 events, during which EEG data from the participants were collected. Each of these “events” was designed to have varied environ- mental conditions. The participants were each designated a room, and within an hour, requested to complete a geographically themed written task. The same procedure was used for both DIY EEG headset and subsequently, an ANT Neuro EEG headset. During the time intervals between the subsequent “events”, a ten-point Likert scale to judge how participants felt mentally and physically was addressed to them. The two streams of data collected were to be synchronised and compared for validation. After that, DIY EEG headset data was classified into segments with machine learning models to determine whether the changes in environmental conditions affected the EEG signals, for the primary reason of the research.
RESULTS AND DISCUSSION
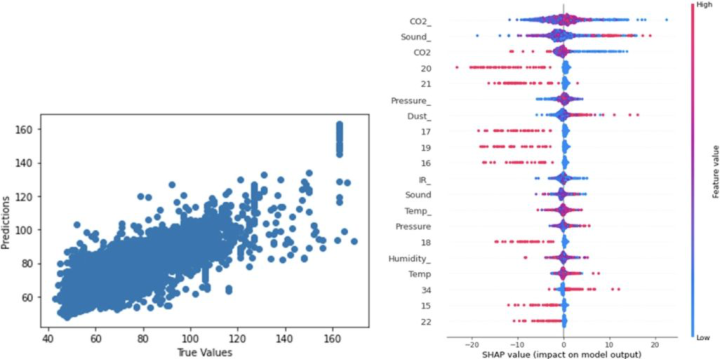
Biometric Data and Microclimatic Data Models In Figure 2, the variable ‘heart rate’ is most strongly associated with (in descending order) the variable ‘carbon dioxide concentration’, having fea- ture importance of 0.15, followed by the variable ‘sound’, having feature importance of 0.14, and by the three variables which co-equally affect heart rate, each having feature importance of 0.08, namely ‘dust concentration’, ‘air pressure’, and ‘ambient temperature’. Using the Shapley summary plot, it can be observed that lower carbon dioxide concentration relates to lower heart rate. As for sound, louder sound in the surrounding microclimate relates to higher the heart rate level. Similarly, higher pressure and dust concentra- tion is related to higher heart rate level, while the heart rate value decreases when the ambient temperature increases. Another interesting observation is that the heart rate dropped from 5 pm onward.
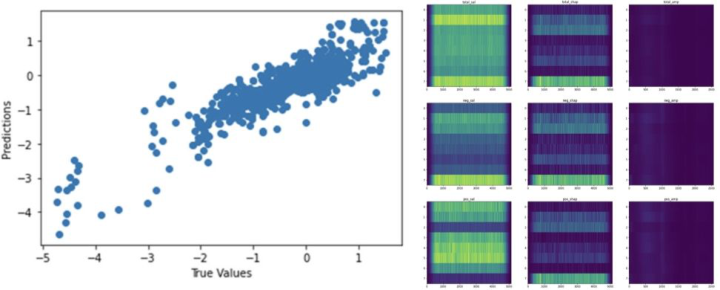
EEG Data and Microclimatic Data Models From Table 1 and Figure 3, the most relevant and significant channels are channels which suggest high cognitive functions, namely Fp2, O2, C3, and T6. The fluctuation in channel C3 positively affects the prediction, while the fluctuation in channel T5 negatively affects the prediction. In the amplitude gradient, there is a high gradient at around 4.6 Hz, 24 Hz, and 49 Hz, which are in the theta, beta, and gamma bands respectively. This indicates that conscious focus, improved memory, and problem solving are again strongly associated with body temperature.
Sound Visible light Infrared Rad Ultra-violet Temp Rel hum Pressure CO2 conc Dust conc Wind Time
Table 1. Goodness of fit from random forest regression analysis.
Designing for the Investigation of Microclimate Stressors 363
Figure 2: Predicted values against true values of heart rate (left) & Shapley summary plot of microclimatic factors and heart rate (right).Figure 3: Predicted values against true values of CNN model of EEG—body tempera- ture (R2 score = 0.75) (left) & figures for EEG—body temperature CNN model results (right).
Electrodermal Activity Data and Microclimatic Data Models
Table 2 shows the results of the classification machine learning models using TVSymp data. Considering the procedure, the change in fan state (greatly affecting room ventilation and temperature) seemed to have a strong link with TVSymp. The door state (weaker effects on ventilation and room tempera- ture) also had a noticeable impact on the Random Forest model prediction. However, the light state had little impact on the classification model. Taken together, these observations suggest links between room temperature and ventilation on cognitive stress.
However, there are still limitations to this research. It has not taken into account the non-linear effects of each factor that can simultaneously affect the change of one another at a particular point in time. This research only con- sidered in singularity the effect of one type of data on another (Environment - biometric, environment - EEG. environment - EDA, EEG - biometric). Thus,
this acts as a fundamental gauge in understanding the complex relationships and interactions among these entities. Secondly, there is a limitation in terms of the variety of participants and age groups. Furthermore, the amount of data collected was relatively small and can be improved for future research.
Table 2. Result of classification machine learning models using TVSymp data.
Table available in the original PDF paper.
Therefore, there are rooms for potential future work. It can take the form of either scaling up or translation to investigate other microclimatic variables (such as the role of infrared radiation on well-being) and socio-demographic contexts, such as, for example, investigating the productivity and attentive- ness of students in the classroom settings, so as to make schools’ classrooms a more conducive place for students to study (Cruz-Garza et al., 2021).
CONCLUSION
The study reported in this paper set out to investigate the associative rela- tionships between microclimate, physiological responses, brain activities and EDA. The investigation was approached under the perspective of citizen science. Therefore, it was about conceptualizing, designing, and working around with what the authors had. Analysis of the datasets was informed by contemporary understandings of data science and machine learning. As such, it is to be expected that there would be trade-offs between accuracy and cost. It is hoped that this paper can contribute to more studies and research that would exemplify affordable ways in which one could study the relationships between the environment and one’s own emotions.
One limitation of this approach is that despite solving the problem of affordability for high-end sensors, the DIY sensors themselves are still prone to error by spontaneous movements of participants. This leads to the amplitude of data collected to be relatively higher or lower than the true data.
Despite the amplitude of siemens of EDA data collected being different from DIY data from Empatica E4 data, their trends were still congruent across the events of the testing procedure. When the data was normalised, F-tests, ANOVA tests and various other means of comparison show that the DIY EDA data was still accurate and even comparable to the research-grade equipment.
Designing for the Investigation of Microclimate Stressors 365
Our results suggest that sound level, carbon dioxide concentration, and dust concentration feature more importantly in the regression models trained on our datasets. These findings are congruent with preceding studies, and we see a primary contribution of our work as the demonstration that—in an age of anthropogenic climate change—broader cohorts of students, researchers, and the general public have potential access to tools, methods, and means of analyses that were once deemed only within the reach of a privileged few due to reasons of cost, fragility, and complexity.
REFERENCES
Cruz-Garza, J.; Darfler, M.; Rounds, J.; Gao, E.; Kalantari, S. (2021). EEG-based Investigation of the Impact of Classroom Design on Cognitive Performance of Students. arXiv: 2102.03629. Dziembowska, I., Izdebski, P., Rasmus, A., Brudny, J., Grzelczak, M., Cysewski, P.
(2016). Effects of Heart Rate Variability Biofeedback on EEG Alpha Asymme- try and Anxiety Symptoms in Male Athletes: A Pilot Study. Appl. Psychophysiol. Biofeedback 2016, 41, 141–150. Föll, S., Maritsch, M., Spinola, F., Mishra, V., Barata, F., Kowatsch, T., Fleisch, E., Wortmann, F. (2021). FLIRT: A feature generation toolkit for wearable data, Computer Methods and Programs in Biomedicine, Volume 212, 106461, ISSN 0169–2607, https://doi.org/10.1016/j.cmpb.2021.106461. Hou, X., Liu, Y., Sourina, O., Tan, Y. R., Wang, L., Müller-Wittig, W. (2015). “EEG
Based Stress Monitoring”. In Proceedings of the 2015 IEEE International Confer- ence on Systems, Man, and Cybernetics, Hong Kong, China; pp. 3110–3115. Lim KYT, Nguyen Duc MA, Nguyen Thien MT, Yuvaraj R, Fogarty JS. Investigating the Effects of Microclimate on Physiological Stress and Brain Func- tion with Data Science and Wearables. Sustainability. 2022; 14(17):10769. https://doi.org/10.3390/su141710769 Palme, M., Salvati, A. (2021). Urban Microclimate Modelling for Comfort and
Energy Studies, 1st ed.; Springer, Cham: Switzerland. Posada-Quintero, H. F., & Chon, K. H. (2020). Innovations in Electrodermal Activity Data Collection and Signal Processing: A Systematic Review. Sensors, 20(2), 479. MDPI AG. Retrieved from https://dx.doi.org/10.3390/s20020479 Posada-Quintero, H. F., Florian, J. P., Orjuela-Cañón, Á. D., & Chon, K. H. (2016).
Highly sensitive index of sympathetic activity based on time-frequency spectral analysis of electrodermal activity. American journal of physiology. Regulatory, integrative and comparative physiology, 311(3), R582–R591. https://doi.org/10. 1152/ajpregu.00180.2016 Posada-Quintero, H. F., Florian, J. P., Orjuela-Cañón, A. D., Aljama-Corrales, T., Charleston-Villalobos, S., & Chon, K. H. (2016). Power Spectral Density Analysis of Electrodermal Activity for Sympathetic Function Assessment. Annals of biomedical engineering, 44(10), 3124–3135. https://doi.org/10.1007/s10439- 016-1606-6 Rahma, O. N., Putra, A. P., Rahmatillah, A., Putri, Y. S. K. A., Fajriaty, N. D., Ain, K.,
Chai, R. (2022). Electrodermal Activity for Measuring Cognitive and Emotional Stress Level. J Med Signals Sens. 12(2): 155–162. doi: 10.4103/jmss. JMSS_78_20. PMID: 35755979; PMCID: PMC9215837. Zangróniz, R., Martínez-Rodrigo, A., Pastor, J. M., López, M. T., Fernández- Caballero, A. (2017). Electrodermal Activity Sensor for Classification of Calm/Distress Condition. Sensors (Basel). 17(10):2324. doi: 10.3390/s17102324. PMID: 29023403; PMCID: PMC5677183.
Read this individual research paper free through the original publisher, or explore the full digital proceedings book.
ISBN 978-1-958651-87-2
Explore this ISBN in the AHFE Bookstore ↗Listed in the July 2026 bookstore catalogue; search by ISBN to confirm current availability · Digital book purchase optional