Chieh-Ju Huang, Julio Kolopitawondal (2023). User Experience Design and Evaluation on Mobile Investment Application User Interface Prototype. In: Usability and User Experience. AHFE Open Access, vol. 110, pp. 200–208. https://doi.org/10.54941/ahfe1003192
The present study aimed to investigate the usability of Ajaib, a mobile investment application in Indonesia, through the conduct of user experience research and usability testing. The previous study utilizing User Experience Questionnaires (UEQ) indicated that the original application fell short in the areas of efficiency, dependability, and novelty. Furthermore, the usability testing results revealed a low success rate, specifically in regards to "Access Learning." In order to address these issues, a high-fidelity user interface design was created based on the results of the previous study. The new design prototype was then evaluated through usability testing, with records and results being recorded through a usability test platform. 21 participants, who were considered beginner users, completed 15 tasks, with task durations and mistakes being recorded. The results of the UEQ on the new design revealed improvements in all scale, with a notable shift from neutral to positive evaluations for the category of novelty. Furthermore, the new design prototype was found to have effectively addressed the problem of completing the "Access Learning" task from the previous user interface. However, participants struggled to complete the "Selling Stock" task without errors. Future studies will involve revising the next version prototype based on the results of the usability testing and UEQ
The FinTech sector has gained significant momentum since 2014 (Iman, 2019), as it promises to increase efficiency and modernize the financial sector (Iman, 2019; Vives, 2017). FinTech companies are able to innovate more than traditional services, which has led to the development of various FinTech- based financial products such as mobile banking services, funding, payments, insurance, cryptocurrencies, and investment (Iman, 2018). As a result, many Indonesians have begun to adopt FinTech for online investment services. Since the advent of online investment services, investors have been able to conduct transactions on a computer or mobile device, choose investments based on their investment goals, and access increasingly extensive infor- mation regarding investments through social media and online resources,
User Experience Design and Evaluation on Mobile Investment Application 201
making them more convenient, efficient, and flexible in recent years (Ismail et al., 2018; Seralurin & Yendra, 2019).
A report by Indonesia Central Securities Depository (KSEI) in 2020 noted that the number of investors on the capital market had risen sharply from 2.48 million in 2019 (Dewi & Rahadi, 2020) to 3.88 million in 2020, repre- senting a 54.90% millennial investor population (Depositry, 2020). With the increase in investors, there is also an increase in companies offering online investment services. Previously, investments were done through securities with the help of brokers. However, it can be done through gadgets nowa- days, hence many companies try to improve their application to fulfill user needs for online investments (Wonglimpiyarat, 2018). Many popular appli- cations have offered investors online investing services, such as IPOT, Mirae, and Ajaib. These applications offered users a simple and convenient way of registering with lots of features to make investment easier and more effi- cient. However, many investors lack a proper understanding of how the capital market works and end up investing without proper knowledge follo- wing advertisements and public figures (Farida & Azizah, 2021; Vianiryzki & Niwanputri, 2021). With more than US$1 billion valuation, the Ajaib application is becoming the seventh unicorn in Indonesia, offering financial investment services over the internet (Wibisono, 2021). Ajaib has provided financial services for users to invest online, such as Stocks and Mutual Funds. Users can access Ajaib through Android, iOS, and the website. A growing number of new users, investment transactions, and users’ activities on the application are the significant factors that keep the Ajaib application busi- ness going. Ajaib application must maintain the quality of its UX to retain users and consider the Ajaib application their primary investment application to avoid losing its potential revenue stream.
The focus of user experience research is on the quality and related elements, especially the evaluation of the usability (Bargas-Avila & Hornbæk, 2011).
The process of high-quality user experience design can be helpful and use- ful to users, clients, and designers from the cooperation relationship (Hartson & Pyla, 2012). According to Schrepp et al. (2017), the User Experience Que- stionnaire (UEQ) is one of several methods for measuring UX, and its purpose is to provide a fast and direct way of evaluating UX. Abdillah (2020) studied how UEQ can measure the UX of Fintech applications, indicating that it can also be used to measure the UX of investment applications. According to ISO 9241-11, usability refers to how effectively, efficiently, and satisfactorily a product, service, or system can be used to achieve specific goals by specified users within a specific context (Iso, 2018). In other words, the application should satisfy the needs of the users, be easy to use, and be user-friendly.
The initial research that has been done by the researcher on the previous study that indicated the result of UEQ shows the “Novelty” score is 0.777, which is a low score and classified as a Neutral evaluation. As a result, the application lacks interest among users and needs improvements in terms of creativity and innovation. Even though other scales were rated as positive, the scores were still relatively low. As a result of the benchmark results deri- ved from the UEQ means, two scales, “Perspicuity”, and “Dependability”, was rated as “below average.” Compared to the data set from the UEQ,
202 Huang and Kolopitawondal
which affected the “Perspicuity” scale due to the ease of use issue, while “Dependability” was impacted by the inability of to users be in control of the application (Kolopitawondal & Huang, 2021).
With the issue that has been addressed in the previous study, this study aims to enhance the Ajaib application’s User Experience (UX) and interface. This will be achieved by evaluating a previous study version of the applica- tion, identifying areas for improvement, and designing a new design based on these findings. Based on the results of this study, changes will be made to the initial version of the Ajaib application to improve its overall design and user experience.
METHODS
There are two approaches used in this study: UEQ to measure the user expe- rience of the Ajaib mobile application, and Usability Testing to identify the user’s pain points with the design result. Also, interviews are to obtain deeper insights into current application user experiences.
Participants Participants in this study were active users of the beginner users of Ajaib application. There were (n) participants who received the questionnaire. October 1, 2022, marked the beginning of the distribution of questionnai- res and the authors collected the questionnaires peer by peer. 21 participants were recruited for this study, and the data were analyzed. Participants’ wil- lingness to fill out the questionnaire determines the data collection process. The valid data are further grouped based on gender, age, and which are active users on the Ajaib application. It is found that female participants in the survey are the most frequent, at 52%, followed by male participants at 48%. Next are participants in the 17 to 29 age group, accounting for 71% of the total study sample, followed by participants in the 30 to 39 age group, accounting for 29%.
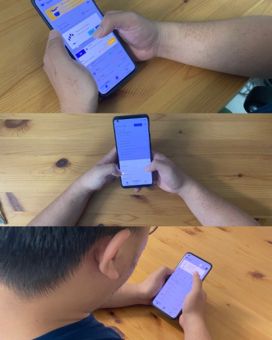
Procedures It was explained to participants that they had been selected as representative participants, and there was no right or wrong answer, rather they could do and respond as they wished. They were instructed to play around with the prototype for 10 minutes using the smartphone devices provided to them.
In Lindgaard and Dudek (2003) opinion, 10 minutes for them to learn about the product is enough time to get to know themselves and not so long that they become bored. Next, the experimenter opened the Maze application on the laptop and set up Usability Testing. As the participant performed the tasks, the experimenter observed them without interrupting or asking questions. To further explore each participant’s experiences with the tasks, unstructured interviews were conducted. Lastly, participants were asked to complete the UEQ upon completing all study tasks to provide an overall assessment. The test took place individually, and participants were compensated for their participation in the session, which lasted up to 10 minutes.
User Experience Design and Evaluation on Mobile Investment Application 203
Figure 1: Participants playing around with final prototype.
RESULT AND DISCUSSION
Based on Table 1, a summary of the UEQ means to value and variance for each scale can be found. It can be seen in Table 1, that all of the scales have positive results. Compared to the previous result, where “Stimulation” recei- ved the highest score, the new design shows that “Perspicuity” received the highest score with a value of 1.83. However, in the new design result still shows that the lowest score is “Novelty”, with both scores of 1.23.
Upon analyzing the six scales of the new design, the participants gave the application an “Attractiveness” score of 1.73, indicating an increase in their overall liking of the product compared to the Previous Design. This suggests that the changes made to the interface were more attractive to the partici- pants. This result can assist the product team in considering the impact of the changes implemented in this study on the participants’ overall impression of the XYZ application and help them to continue making improvements to enhance the UX. The redesign and addition of user interface elements in the new design condition significantly impacted the product’s attractiveness, as evidenced by the increase in the “Attractiveness” scale.
The “Perspicuity” score of 1.83 for the application suggests that it was intuitively easy to use, an improvement compared to the Previous Design. This was the most significant increase among the variables analyzed. The improvements made to the new design were beneficial to the participants,
making it effortless for them to perform their investment activities. This is also reflected in the high agreement among the participants that the new design was easy to use, contributing to its higher score on the “Perspicuity” scale.
According to the New design, “Efficiency” is measured by a score of 1.65, indicating how effectively participants can complete their tasks without exer- ting excessive effort. It is worth noting that even though the participants were using a prototype application that had not yet been fully coded, their “Effici- ency” increased when the application responded quickly to their actions. In order to improve the experience that the participants have when using the application, the engineers and product team at Ajaib need to optimize the speed at which the application responds to their actions. The ability of par- ticipants to complete the tasks more efficiently in the new design condition compared to the Previous Design further supports the conclusion that the redesign of the user interfaces positively impacted the product’s usability and efficiency.
The “Dependability” scale was receiving a score of 1.72 in the new design condition. This represents an improvement of 0.68 from the Previous Design, indicating that participants found it easier to locate relevant information within the interface without navigating between different sections. Overall, the findings suggest that the new design allows for a more seamless and empo- wering interaction for the participants. Among the New design conditions, most scores showed an increase, likely because the interface was simple and effective. In particular, the main page and the buy and sell pages for mutual funds and stocks provided all the necessary information without requiring participants to navigate between screens. As a result of this simplicity and accessibility of information, the scale scores improved overall.
The “Stimulation” scale received a score of 1.69 in the new design condi- tion, representing an increase of 0.49 compared to the Previous Design. This finding indicates that the new design successfully motivated participants to use the application. The results suggest that the interface and design of the new design were able to engage and motivate participants, particularly in the learning section. The ease of access to this information contributed to the increased motivation to use the application for learning and investing.
As a result of the evaluation, the “Novelty” scale received a positive score in the new design condition, representing a significant improvement from the Previous Design, in which “Novelty” received a score of 1.23. This fin- ding indicates that the participants found the product more innovative and attention-catching in the new design condition. The improvement may be attributed to incorporating features such as coach marks and animations, which provided a more creative and interactive experience for the partici- pants. Overall, these results suggest that the new design successfully enhanced the “Novelty” and creativity of the product, leading to a positive evaluation on the “Novelty” scale.
We tested the usability of the new design on 21 participants. A total of 15 tasks were measured. Based on our test results, the following are the “Effe- ctiveness,”and “Efficiency,”of data processing. The data in Table 1 highlights the overall success rates of the various tasks among the participants. The
User Experience Design and Evaluation on Mobile Investment Application 205
majority of tasks were completed by all participants, indicating that the new design effectively increased the “Effectiveness”of users while interacting with the application. However, there was one notable exception in Task 10 (Selling Stocks), where it can be seen that were unable to complete the task succes- sfully, either failing or giving up during the process. This suggests that some new design areas could be further improved to enhance user “Effectiveness”. According to the new design Usability results, there had been a decrease in success percentages compared to previous results. It is important to note that indirect success is still considered to be a success, even though the user com- pleted the task on a different path than the researcher predicted and planned. Therefore, the results of direct success and indirect success were combined since both are still considered success metrics.
The data in Table 1 highlights the overall success rates of the various tasks among the participants. The majority of tasks were completed by all partici- pants, indicating that the new design effectively increased the “Effectiveness” of users while interacting with the application. While the data presented in Table 2 provides an analysis of the “Efficiency” of the new design, as measured through the completion times of various tasks.
Upon examining the results, it is evident that Task 11 (Buying Mutual Funds) had the highest average completion time among all tasks tested. How- ever, it is worth noting that the difference in completion time between Task 11
Table 2. Total participant’s tasks successful and failed on a new design.
Table available in the original PDF paper.
Task Direct Success Indirect Success Total Success Failed
Selling Mutual Fund Check Profile 100% 0% 100% 0% Access Help Center 90.48% 9.52% 100% 0% Log Out 100% 0% 100% 0%
206 Huang and Kolopitawondal
Table 3. Task completion time of new design.
Table available in the original PDF paper.
Task Total Tim New design(s) Average Time(s) Log In 385.277 18.2 Access Learning Section 76.72 3.7 Access Community Section. 51.16 2.4 Access News Section. 59.79 2.8 Access Group Chat Section. 223.16 10.6 Search Investment Instrument. 436.9 20.8 Buying Stock. 371.98 17.7 Check Transaction 131.45 6.3 Check Portfolio 166.28 7.9 Selling Stock 425.54 23.6 Buying Mutual Fund. 572.08 27.2 Selling Mutual Fund 494.1 23.5 Check Profile 59.13 2.8 Access Help Center 150.23 7.2 Log Out 135.44 6.4
and Task 12 (Selling Mutual Funds) was not particularly significant, sugge- sting that participants were able to complete both tasks at a relatively similar speed. Overall, the results of the study suggest that the new design allows for relatively efficient task completion by participants. As shown by the results, Task 10 (Selling Stocks) was the second-highest completion time among all tasks tested, coming in just behind Task 11 (Buying Mutual Funds). Howe- ver, upon closer examination, it is apparent that the difference in completion time between Task 10 and Task 7 (Buying Stocks) was not particularly signi- ficant. While Task 7 did have a slightly faster average completion time, the difference was not substantial. These findings suggest that the “Efficiency” of Task 7 and Task 10 were similar, with Task 7 exhibiting slightly faster task completion on average. Additionally, it is worth noting that Task 6 (Sea- rching for an Instrument) demonstrated relatively efficient task completion, with a relatively low average completion time. This suggests that the new design successfully facilitated participants’ ability to locate the desired instru- ment quickly. Overall, most tasks displayed low average completion times, indicating that the new design improved UX in terms of “Efficiency”.
The present study presents a new design for Ajaib applications that incor- porates general features of investment and supporting features that contribute to a positive UX. This design aims to make an investment application that is simple and easy to use, especially for Ajaib applications with a lot of information.
CONCLUSION
Therefore, the development of a New Design was undertaken in order to address the issues that had been reported concerning the UX. The evaluation of this New Design showed that there has been a significant improvement in the overall score and result of the UX. In particular, the UEQ results
User Experience Design and Evaluation on Mobile Investment Application 207
demonstrated that all 6 scales involved in the assessment had seen an incre- ase. One of the most notable improvements was in the category of “Novelty”, which measures the creativity and innovation of the design. The score for this category increased from previous design to the new design, indicating that participants found the updated version to be more innovative and unique. Another area where the new design excelled was in the category of “Perspi- cuity”, which assesses the ease with which participants can become familiar with and learn how to use the product. The high score achieved in this cate- gory suggests that the New Design was very intuitive and straightforward to use.
Usability metrics for “Effectiveness” was achieved by 100% for almost all task which was measured using the task completion rate, except task 10 (Sel- ling Stocks) several users got confused with the flow of the features while “Efficiency” is achieved showing all of the tasks has been significantly decre- ased in terms of the average time of task completion in other words with the new design user were able to finish the task faster. Mobile investment applications need to prioritize the UX in order to attract potential users, espe- cially for tasks related to investing activities. A positive UX can encourage users to continue using the application and recommend it to others. Based on the results of this study, changes will be made to the initial version of the Ajaib application to improve its overall design and UX. In future research, to further enrich the data and enhance the validity of findings and recommen- dations, it is recommended that future research engages more participants. In this way, the UX could be better understood and conclusions drawn that are more robust and reliable could be drawn.
REFERENCES
Abdillah, L. A. (2020). FinTech E-Commerce payment application user experience analysis during COVID-19 pandemic. arXiv preprint arXiv:2012.07750. Bargas-Avila, J. A., & Hornbæk, K. (2011). Old Wine in New Bottles or Novel
Challenges? A Critical Analysis of Empirical Studies of User Experience. CHI’11, Vancouver, BC, Canada. Depositry, I. C. S. (2020). Digital Innovation to Maintain Growth amidst Challenges. https://www.ksei.co.id/files/uploads/annual_reports/report_file/en-us/18_ annual_repot_2020_20210713155604.pdf Dewi, E., & Rahadi, R. (2020). A Conceptual Study of Technology Adoption of
Online Mutual Fund Investment Platform. European Journal of Business and Management Research, 5. https://doi.org/10.24018/ejbmr.2020.5.3.334 Farida, S., & Azizah, N. (2021). CONGRUENTTRIANGULATION OF ONLINE TRADING USER BEHAVIOR: EDUCATIONAL EFFORTS FOR INDONESIAN YOUTH INVESTORS. Hartson, R., & Pyla, P. (2012). The UX Book: Process and Guidelines for Ensuring
a Quality User Experience. Morgan Kaufmann. Iman, N. (2018). Assessing the dynamics of fintech in Indonesia. Investment Management and Financial Innovations, 15(4), 296–303. Iman, N. (2019). Traditional banks against fintech startups: A field investigation of
a regional bank in Indonesia. Banks and Bank systems, 14(3), 20–33.
208 Huang and Kolopitawondal
Ismail, S., Nair, R., Sham, R., & Wahab, S. (2018). Impacts of online social media on investment decision in Malaysia. Indian Journal of Public Health Research and Development, 9, 1241. https://doi.org/10.5958/0976-5506.2018.01627.3 Iso, I. (2018). 9241–11 (2018) Ergonomics of human-system interaction—part 11:
usability: definitions and concepts. International Organization for Standardiza- tion. https://www.iso.org/obp/ui/#iso:std:iso, 9241(11). Kolopitawondal, J., & Huang, C. (2022, March 11-13). Computer systems and human-computer interaction [Evaluation of User Experience on Mobile Inve- stment Application: Take Example of “Ajaib” in Indonesia]. The 29th Ergo- nomics Society of Taiwan Annual Meeting and Conference (Taiwan), Tainan (pp. 147–154). Human Factors Engineering Society of the Republic of China. Lindgaard, G., & Dudek, C. (2003). What is this evasive beast we call user
satisfaction? Interacting with computers, 15(3), 429–452. Schrepp, M., Hinderks, A., & Thomaschewski, J. (2017). Construction of a Benchmark for the User Experience Questionnaire (UEQ). International Journal of Interactive Multimedia and Artificial Intelligence, 4, 40–44. https://doi.org/10. 9781/ijimai.2017.445 Seralurin, Y., & Yendra. (2019). International Journal of Social Sciences and Huma-
nities The Intensity of Stock Selection: A Case of Young Papuan Investors. Journal of Humanities and Social Sciences, 3, 171–178. https://doi.org/10.29332/ijssh.v3n 1.262 Vianiryzki, A. F., & Niwanputri, G. S. (2021). A User-Centered Approach to Design a Financial Asset Investment Mobile Application for Building Investing Eagerness. 2021 8th International Conference on Advanced Informatics: Concepts, Theory and Applications (ICAICTA), Vives, X. (2017). The impact of FinTech on banking. European Economy(2), 97–105. Wibisono, A. (2021). Online Stock Brokerage Ajaib Becomes Indone- sia’s Fastest Unicorn. Forbes. Retrieved 19 March 2022 from https: //www.forbes.com/sites/ardianwibisono/2021/10/04/online-stock-brokerage -ajaib-becomes-indonesias-fastest-unicorn/?sh=4da1e7c63236 Wonglimpiyarat, J. (2018). Challenges and dynamics of FinTech crowd funding:
An innovation system approach. The Journal of High Technology Management Research, 29(1), 98–108. https://doi.org/https://doi.org/10.1016/j.hitech.2018. 04.009
LISTED IN THE AHFE DIGITAL BOOKSTORE CATALOGUE
Explore the complete digital volume
Usability and User Experience
Read this individual research paper free through the original publisher, or explore the full digital proceedings book.
ISBN 978-1-958651-86-5
Explore this ISBN in the AHFE Bookstore ↗Listed in the July 2026 bookstore catalogue; search by ISBN to confirm current availability · Digital book purchase optional