Danie Hoffman, Hoffie Cruywagen (2023). Does size matter? Findings on the Green building cost premium in South Africa for 2009 - 2018. In: Sustainable Construction in the Era of the Fourth Industrial Revolution. AHFE Open Access, vol. 107, pp. 1–9. https://doi.org/10.54941/ahfe1003086
Since the Green Building Council South Africa (GBCSA) was established in 2007, the frequent perception that green building has a significant and unaffordable cost premium challenged the progress of green building. Various studies confirmed that this opinion exists worldwide. In response, the GBCSA, the Association of South African Quantity Surveyors (ASAQS) and the University of Pretoria (UP) started a joint study in 2014 to provide accurate data on the actual cost of South African green buildings. The study findings are based on the cost data of all new office buildings awarded a Green Star certification by the GBCSA using the Green Star Office v1/v1.1 rating tool. A total of 170 new office buildings fit this profile. The study findings were published in industry booklets in 2016, 2019 and 2022. In addition to reporting on the cost premium of green building, the aim of the study was also to consider prominent building features driving green building costs to develop a deeper understanding of the nature of green building cost. These building features include the certification level, the size, the base building cost, the certification date, the tenant mix and the vertical façade ratio of the buildings. The study found an average green building cost premium (GBCP) of only 3,96% in 2019, reducing to 3,63% in 2022. The study also found that the construction area of the study population’s buildings had a consistent negative correlation with their green building cost premium. This study will describe a more detailed relationship between building size and green building cost premium. The information will add value to the green building industry and all the relevant stakeholders, such as property owners and developers, the GBCSA, the ASAQS and the quantity surveying profession. The findings can also be compared internationally to serve the wider green building industry.
Global warming and climate change are serious environmental challen- ges of our time (UNEP, 2007; Birne et al., 2009; Onarheim and Arthun, 2017). Current species extinction rates are 1000 - 10,000 times the natu- ral extinction rate, driven by human lifestyle without regard for non-human species (Kopnina, 2014; IUCN, 2014). Addressing global warming towards more sustainable goals requires global action (Kumar and Geneletti, 2015; Preston et al., 2011). The consequences of years of indiscriminate use of resources are unpredictable and mostly negative (Suzuki and Dressel, 2004).
Hes and Du Plessis (2015) warned that minor adjustments to a funda- mentally flawed system of growth and development would not solve our problems. The most severe environmental challenges originate from urban regions (Reith and Orova, 2014), fuelled by the accelerating global urbani- zation of people, technological development and modern lifestyles (United Nations, 2011; Hedge and Dorsey, 2012).
The built environment contributes significantly to global warming, with 40% of global energy use and 30% of greenhouse gas emissions linked to buildings (Kriss, 2014; Pekka, 2009; GBCSA, 2016; WGBC, 2016; Morgan Stanley, 2016; Kruse, 2004). Similar research findings are true of South Africa (CIDB, 2009; Milne, 2012).
The built environment responded by founding the WGBC in 1999. The nine founding members have now expanded to eighty member countries. The WGBC support the global green building initiative, coordinates green rating certification systems, and provides industry benchmarking standards (WGBC, 2020). The GBCSA was established in 2007, and the Green Star SA rating tools were launched in 2008 (GBCSA 2014; GBCSA, 2019).
Many challenges confront the green building industry, the highest barrier being the perceived capital premium of green developments (Kats, 2003; Lockwood, 2008; Kats, 2010; Milne, 2012, WGBC, 2013; Coetzee and Brent, 2015; Morgan Stanley, 2016).
THE MERIT FOR THE STUDY By 2014, no reliable cost data existed on the cost premium of South African green buildings. The GBCSA, the ASAQS and the UP started a joint study describing South African green building cost. The study evaluated the cost of Green Star-rated office buildings certified until the end of December 2018 (Hoffman, 2023).
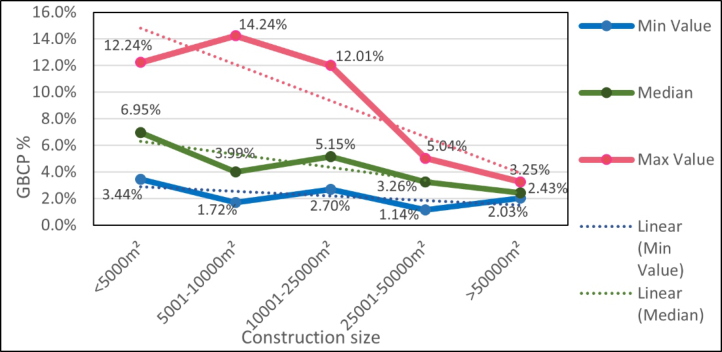
The study found a GBCP of 3,96% with a spread of 1,14 % - 14,24%. Figure 1 details a prominent study finding of the significant negative cor- relation between construction size and GBCP (r = −0,906)(Green Building
Figure 1: Construction size of buildings vs the GBCP (Source: Green building, 2019).
Does Size Matter? Findings on the Green Building Cost Premium 3
in South Africa, 2019). This follow-up study further explores the relation- ship between construction size and GBCP. A more detailed understanding of green building cost will lessen the uncertainty and risk for decision-makers regarding green building.
METHODOLOGY
The study findings are based on the cost data of all new office buildings awarded a Green Star certification by the GBCSA using the Green Star Office v1/v1.1 rating tool. A total of 170 new office buildings fit this profile. The quantity surveyor on each building was requested to forward a detailed, Excel-based financial transparency report, enabling the study to collect the cost data required.
The study employed several generic building features linked to green building costs to further understand green building cost premiums. These building features include the Green Star certification level (4, 5 or 6 Star), construction area, tenant mix, the base building cost (R/m2), the façade : con- struction area ratio, and the certification date of buildings.
The base building cost of all the buildings escalated to December 2018, varied between R9 028/m2 and R28 983/m2. The original study applied five base building cost categories to evaluate the relationship between base building cost and GBCP. This follow-up study is further exploring the relati- onship between construction size and GBCP. The findings of the relationship between the GBCP and the construction area are used as the basis or point of departure. The findings of every one of the other building features are combined with the basic finding to pursue a deeper understanding of the relationship between the GBCP and the construction size of green office buildings.
The study used the data and statistical analysis tools forming part of the Excel software.
FINDINGS Construction Size and Green Star Rating
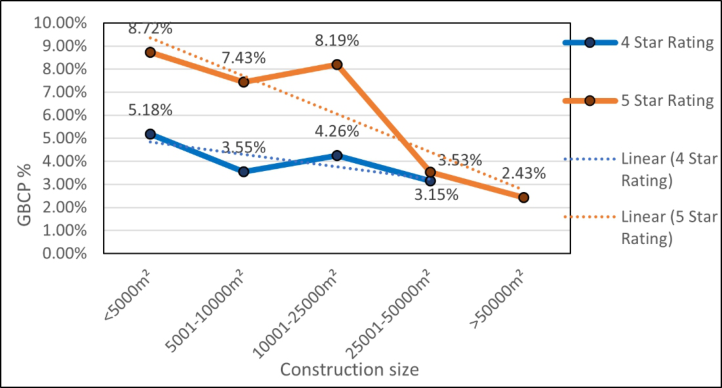
The 4 and 5 Star buildings displayed a similar negative correlation betw- een construction size and GBCP. The negative correlation was much more significant for buildings larger than 25,000m2. 5 Star buildings smaller than 25,000m2 also had a much higher GBCP than 4 Star buildings of similar size. There were no 4 Star buildings of more than 50,000m2, while the small number of 6 Star buildings prevented a meaningful analysis across five size categories.
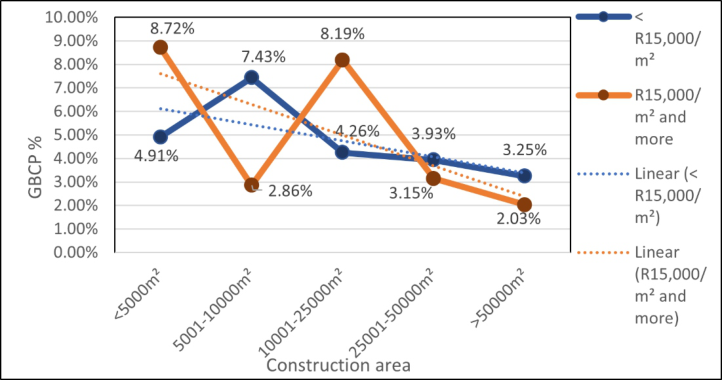
Construction Size and Base Building Cost The original study’s five base building cost categories had to be reduced to two even-sized categories of base building cost to ensure enough case stu- dies in each of the five construction size categories, namely, buildings costing < or > more than R15 000/m2. Both data sets displayed a relatively weak negative correlation between base building cost and GBCP (r = −0,7023
4 Hoffman and Cruywagen
and −0,6513 respectively)(see Figure 3). The resulting coefficient of deter- mination for buildings with a base building cost of > R15,000/m2 was only 0,4242. The data on base building cost confirmed that for buildings smal- ler than 25,000m2, the base building cost displayed very little meaningful relationship between construction size and GBCP. For buildings larger than 25,000m2, the data confirmed the negative correlation between construction size and GBCP.
Construction Size and Façade Ratio Many research studies agree that a smaller façade area supports an energy- efficient building (Pacheco, Ordónez and Martínez, 2012; Aksoy and Inalli, 2006). The original study, therefore, considered the effect of the façade : con- struction area ratio of buildings on the GBCP. The study calculated the façade
Figure 2: Construction size and certification level vs the GBCP (Source: Authors, 2023).Figure 3: Construction size and base building cost vs the GBCP (Source: Authors, 2023).
Does Size Matter? Findings on the Green Building Cost Premium 5 : construction area ratio of all buildings with a minimum ratio of 0,19m2/m2
and a maximum ratio of 0,84m2/m2. The original study’s five façade ratio categories had to be reduced to two even-sized categories of façade ratio to ensure enough case studies in each of the five construction size categories, namely buildings with a façade ratio < or > than 0,44m2/m2.
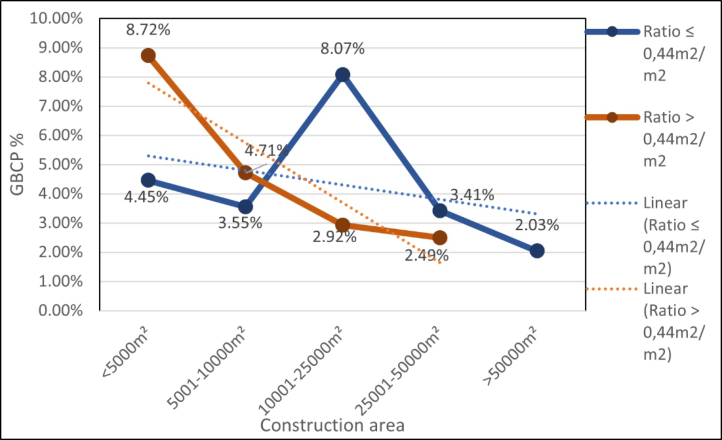
Figure 4 confirmed that within the building size categories, buildings with a façade ratio of > 0,44m2/m2 confirmed the strong negative correlation betw- een construction size and GBCP (r = −0,7928 and r2 = 0,6286). Buildings with a façade ratio of < 0,44m2/m2 displayed a weak negative correlation (r = −0,4974 and r2 = 0,2474). For buildings smaller than 10,000m2, a façade ratio of > 0,44m2/m2 resulted in a higher GBCP than a façade ratio of < 0,44m2/m2. However, the opposite was true for buildings larger than 10,000m2, and a façade ratio of > 0,44m2/m2 resulted in a lower GBCP.
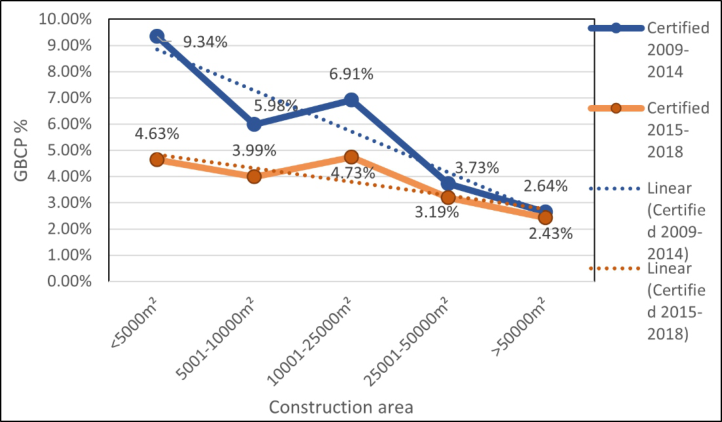
Construction Size and Certification Date The buildings were divided into two groups – those certified up to and those certified later than 2014 to evaluate the effect of the certification date on the relationship between building size and GBCP. The original study found a strong negative correlation between the certification date and the GBCP (Green building, 2019). In agreement with that finding, the follow-up study found that both certification date groups confirmed the strong negative cor- relation between building size and GBCP (r = −0,9106 and r2 = 0,8291 for buildings 2009–2014 vs r = −0,9082 and r2 = 0,8278 for buildings 2015- 2018)(see Figure 5). For buildings smaller than 25,000m2, the buildings certified up to 2014 presented a significantly higher GBCP.
Construction Size and Tenant Mix The original study made a very distinct finding regarding the relation- ship between tenant mix and the GBCP of buildings. Most buildings certifiedduring the initial years were single-tenant, typically with a higher
Figure 4: Construction size and Façade ratio vs the GBCP (Source: Authors, 2023).
6 Hoffman and Cruywagen
Figure 5: Construction size and certification date vs the GBCP (Source: Authors, 2023).
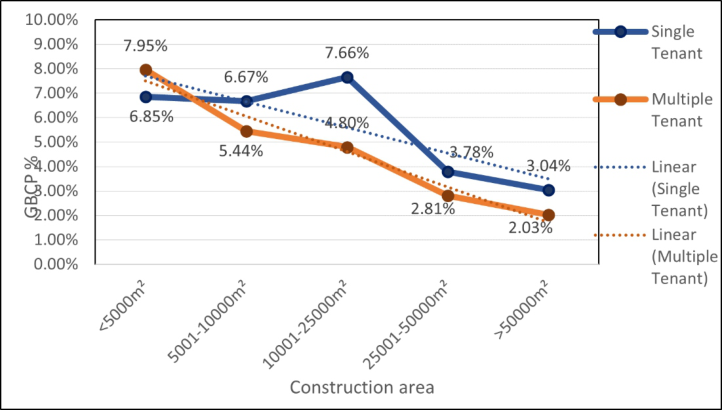
base building cost and GBCP than the few multi-tenanted green buildings. The average GBCP for single-tenanted buildings certified not later than 2014 was 8,13% compared to 3,55% for multi-tenanted buildings. However, for buildings certified later than 2014, the GBCP of single-tenanted buildings of 3,53% were very similar to the 3,30% of multi-tenanted buildings. The follow-up study found that single and multi-tenanted buildings confirmed the strong negative correlation between construction size and GBCP (r = −0,8996 and r2 = 0,8093 for single-tenanted buildings vs r = −0,9276 and r2 = 0,8604 for multi-tenanted buildings)(see Figure 6). For
Figure 6: Construction size and tenant mix vs the GBCP (Source: Authors, 2023).
Does Size Matter? Findings on the Green Building Cost Premium 7 all buildings larger than 5,000m2, single-tenanted buildings presented with a higher GBCP.
CONCLUSION
The study findings explored and expanded on some of the original study’s findings. The first finding was that for all buildings smaller than 25,000m2, 4 Star buildings presented lower GBCP than 5 Star buildings. Both 4 and 5 Star buildings confirmed the negative correlation between building size and GBCP.
The second finding confirmed that for buildings smaller than 25,000m2, the base building cost had no constant, meaningful relationship with the GBCP. For buildings larger than 25,000m2, the data on base building cost confirmed the negative correlation between construction size and GBCP. These larger categories of buildings with a base building cost exceeding R15,000/m2 also presented with lower GBCP than buildings with a base building cost lower than R15,000/m2.
In the third instance, buildings with a façade ratio of > 0,44m2/m2 confir- med the strong negative correlation between construction size and GBCP. Buildings with a façade ratio of > 0,44m2/m2 presented a lower GBCP for buildings less than 10,000m2 and a higher GBCP for buildings larger than 10,000m2.
Regarding the certification date, the follow-up study found that both cer- tification date groups confirmed the strong negative correlation between building size and GBCP. For buildings smaller than 25,000m2, the buil- dings certified up to 2014 presented a significantly higher GBCP than those certified after 2014.
For both single and multi-tenanted buildings, the study confirmed the strong negative correlation between construction size and GBCP. For all buil- dings larger than 5,000m2, single-tenanted buildings presented with a higher GBCP.
A deeper understanding of the dynamics of green building cost will assist property owners and property consultants to embrace the critically important shift towards a more sustainable industry with greater purpose and resolve.
RECOMMENDATIONS This study’s findings broadly supported the original study’s findings on the relationships between GBCP and the building features mentioned in the study. The follow-up study also confirmed that combining the findings on the con- struction size of buildings with that of the other building features, on some occasions, revealed more insight into the data and the expected GBCP of certified green buildings.
Based on the study findings, a recommendation is to also consider a follow- up study on the original study’s conclusion that the data shows signs of the growing maturity of the green building industry.
A number of the findings of this study confirmed the dynamic nature of data on green building costs. The study, therefore, recommends that the
8 Hoffman and Cruywagen
study of the relationships of the green building cost of certified buildings be continued. Consideration should also be given to expanding such studies to include existing building performance certifications, retail, industrial and public sector buildings.
ACKNOWLEDGMENT
The authors would like to acknowledge the support of the ASAQS and the GBCSA in securing the study data.
REFERENCES
Aksoy, U. T. and Inalli, M. 2006. Impacts of some building passive design parameters on heating demand for a cold region. Building and Environment 2006 (41) pp. 1742–1754. Elsevier Pty. Birne, P., Boyle, A., & Redgewell, C. 2009. International Law and the Environment.
Oxford University Press, New York. Coetzee, D. and Brent, A. 2015. Perceptions of professional practitioners and property developers relating to the cost of green buildings in South Africa. Journal of the South African Institution of Civil Engineering, Vol. 57, No. 4, December 2015, pp. 12–19. Construction Industry Development Board (CIDB), 2009. “Greenhouse gas emission
reduction: potentials from Buildings.” Construction Industry Development Board (CIDB) discussion document. [Online] Available from: http://www.cidb.org.za/pu blications/Documents/ [Accessed: 25 February 2019]. GREEN BUILDING COUNCIL OF SOUTH AFRICA. 2014. Green Building Council of South Africa [Online]. Available from: https://old.gbcsa.org.za/about/visio n.php [Accessed 30 October 2014. GREEN BUILDING COUNCIL OF SOUTH AFRICA. 2016. Evidence of Global
Warming. [Online] Available from: https://www.gbcsa.org.za/about/about-green- building/ [Accessed 28 April 2016]. GREEN BUILDING COUNCIL OF SOUTH AFRICA. 2019a. [Online]. Available from: https://gbcsa.org.za/about-gbcsa/. [Accessed 23 February 2019]. Green Building in South Africa – Guide to Costs & Trends 2019 Edition. 2019.
ISBN978-1-919921-29-7. Published by the Green Building Council of South Africa, the Association of South African Quantity Surveyors and the University of Pretoria. Hedge, A. and Dorsey, J. A. 2012. Green buildings need good ergonomics. Ergonomics 2012, pp. 1–15. Taylor & Francis, London. Hes, H. and Du Plessis, C. 2015. Designing for Hope: Pathways to regenerative
sustainability. Routledge. New York. Hoffman, D. J. 2023. Towards Estimating the cost premium of Green Star certified office buildings in South Africa. Unpublished PhD-thesis. University of Pretoria. 2023. International Union for Conservation of Nature (IUCN), 2014. About the biodi-
versity crisis. [Online] Available from: https://www.iucn.org/what/biodiversity. [Accessed on 2 April 2014]. Kats, G., 2010. Greening our build world: Cost, benefits and strategies. California: Island Press. Kats, G. H. 2003. Green building costs and financial benefits document. Massachu-
setts Technology Collaborative. USA. Kopnina, H. 2014. Education for sustainable development as if environment really mattered. Environmental Development Volume 12 (2014) pp. 37–46 Elsevier.
Does Size Matter? Findings on the Green Building Cost Premium 9
Kriss, J., 2014. What is green buildings? [Online] Available at: https://www.usgbc.or g/articles/what-green-building [Accessed 31 May 2016]. Kruse, C., 2004. IIGCC Briefing Note: Climate Change and the Construction Sector.
UNEP, Paris. Kumar, P, and Geneletti, D. 2015. How are climate change concerns addressed by spatial plans? An evaluation framework and an application to Indian cities. Land Use Policy 42 (2015). Elsevier Ltd. Lockwood, C. 2008. The dollars and sense of green retrofits. Deloitte Development
LLC, United States. Milne, N., 2012. The Rands and Sense of Green Building: Building the business case for green commercial buildings in South Africa. South Africa. Blacksheepstudios. Morgan Stanley Institute for Sustainable Investing. 2016. Bricks, Mortar and Carbon
How Sustainable Buildings Drive Real Estate Value. Morgan Stanley & Co. LLC. New York. Onarheim, I. H. & Arthun, M. 2017. Towards an ice-free Barents Sea. Geophysical Research Letters, 44(16), pp. 8387–8395. Pacheco, R., Ordóñez, J. and Martinez, G. 2012. Energy-efficient design of building:
A Review. Renewable and Sustainable Energy Reviews 16 (2012) pp. 3559–3573. Elsevier Pty. Pekka, H. E. A., 2009. Buildings and Climate Change, Paris: United Nations Environmental Programme. Preston, B. L., Westaway, R. M., and Yuen, E. J. 2011. Climate adaptation planning in
practice: An evaluation of adaptation plans from three developed nations. Global. Change 16, pp. 407–438. Reith, A. and Orova, M. 2014. Do green neighbourhood ratings cover sustainability?
Ecological Indicators 48 (2014). pp. 660–673. Elsevier Pty. Suzuki, D. and Dressel, H. 2004. From Naked Ape to Super species: Humanity and the Global Eco Crisis. Greystone Books / David Suzuki Foundation. ISBN 155365031X. United Nations Environmental Programme. 2007. Buildings and Climate Change:
Status Challengers and Opportunities. [Online]. Available from: http://wedocs.u nep.org/handle/20.500.11822/7783 [Accessed 8 March 2019]. United Nations. 2011. World Urbanization Prospects. The 2011 Revision. USA. WGBC. 2016. WGBC history [Online]. Available from: https://www.worldgbc.org/i ndex.php/worldgbc/history/ [Accessed 01 October 2016]. WGBC. 2020. (World Green Building Council). 2020. Homepage. [Online]. Availa-
ble at: <https://www.worldgbc.org/member-directory> [Accessed: 22 June 2020]. World Green Building Council. 2013. The Business Case for Green Building: A Review of the Costs and Benefits for Developers, Investors and Occupants. [Online]. Available from: https://www.worldgbc.org/news-media/business-case- green-building-review-costs-and-benefits-developers-investors-and-occupants. [Accessed 23 March 2019.
LISTED IN THE AHFE DIGITAL BOOKSTORE CATALOGUE
Explore the complete digital volume
Sustainable Construction in the Era of the Fourth Industrial Revolution
Read this individual research paper free through the original publisher, or explore the full digital proceedings book.
ISBN 978-1-958651-83-4
Explore this ISBN in the AHFE Bookstore ↗Listed in the July 2026 bookstore catalogue; search by ISBN to confirm current availability · Digital book purchase optional