Houran Zeng, Lijuan Zhao, Jing Zhang, Xiaoke Li, Wei Xu (2023). An Analysis of User's perceptual preferences in Virtual Reality Home Interface Design. In: Human Factors in Virtual Environments and Game Design. AHFE Open Access, vol. 96, pp. 112–122. https://doi.org/10.54941/ahfe1003873
1 College of Furnishings and Industrial Design, Nanjing Forestry University, No.159, Longpan Road, Xuanwu District, Nanjing, China ↗
2 Dehua TB New Decoration Material Co., Ltd, Huzhou 313200, China ↗
3 College of Furnishings and Industrial Design, Nanjing Forestry University, No.159 Longpan Road, Xuanwu District, Nanjing, China; Dehua TB New Decoration Material Co., Ltd, Huzhou 313200, China ↗
The home interface of Virtual Reality (VR) human-computer interaction system determines the consumer's first impression of VR, and it is also the core interface for users to perceive and understand the functional distribution and composition of the entire VR system. However, the current VR home interface design ignores the importance of users' perceptual needs and preferences. This paper attempts to study the relationship between perceptual preferences and design elements in the VR home interfaces by Kansei Engineering. Through the semantic evaluation of the home interface of thirty mainstream HMDs, we analyzed and found that the layout, icon style and the number of cards are the factors that affect perceptual preferences the most. Subsequently, we conducted an experiment on the relationship between these interface design elements and perceptual preferences. Based on the experiment results, it is validated that these interface design elements have varying effects on perception: the icon style has the greatest impact on “future” perception, the interface layout has the greatest impact on “comfort” perception, and the number of cards has the greatest impact on “immersion” perception.
With the rise of the metaverse, research on the user experience of human-computer interaction interface in Virtual Reality (VR) has attracted widespread attention. Compared with traditional display methods, the big- gest difference of VR is that it breaks the limitation of screen boundaries and brings an immersive perspective for users to experience the virtual world as if they were living in the real world. In the VR interactive system, the VR home interface is the beginning of the user’s experience of VR human-computer interaction. It is also the core interface for users to perceive and understand the function distributional and composition of the entire VR system. When the user puts on the VR HMD and turns on the system, the home interface determines the consumer’s first impression of VR, which is very important for users to maintain their enthusiasm for continue using VR. However, the
An Analysis of User’s Perceptual Preferences in Virtual Reality Home Interface Design 113
current VR home interface design ignores the importance of users’ perceptual needs and preferences, and there are even some conflicts between the visual presentation forms of the home interface and the user’s perception, which not only reduces the attraction of the VR system but also negatively affects user experience. Therefore, we propose that it is very important to have a VR home interface that matches the users’ emotions and perceptions in order to obtain a good user experience.
Among all the senses, vision is the most important part of perception, pro- viding more than 50% of perception (Cuban, 2003; Shabiralyani et al. 2015; Humphreys, 2021). People’s perception of an object could make them feel emotional, which is regarded as a subjective process (Lee et al. 2002) and is called “Kansei”in oriental culture. In the field of design research, the idea that incorporating users’ perceptual preferences into design can better improve the user experience is not new. Kansei engineering (KE) is a scientific approach to understand the user’s perception of objects by measuring the semantics and integrating human sensibility into the design, to better optimize the design to meet various user needs such as user-friendliness, manufacturability, and ecological considerations (Nagamachi, 2004). Nowadays, KE is not only used to direct the design of industrial products but also widely used in the field of Human-Computer Interaction (HCI). Many scholars have made valuable research to explore the relationship between design and emotion, especially interface design. For example, an interface that matches the user’s emotions and perceptions can keep the user from getting frustrated when adapting to the interface, and in some cases evokes positive emotions in the user (Hou et al. 2011). Kim et al. (2003) identified quantitative relationships between key design factors and generic dimensions of secondary emotions in web- site homepage design through Kansei Engineering so that they could develop homepages that target emotions more effectively. Fu et al. (2020) organi- zed design elements in VR scene design and provided evaluation methods for evaluating the design process. In the past, the focus of VR research and development has been almost concentrated on scene and interaction design (Cai et al. 2017; Barbieri et al. 2018; Radianti et al. 2020), and the impacts of Kansei Engineering on VR home interface has not been verified in detail. It is important to introduce KE into VR home interface design to establish the correspondence between interface design elements and semantic words to better guide the design. Meanwhile, quantifying the relationship between perceptual preferences and design elements in VR home interface is also an important part of the user experience research. In this paper, we investiga- ted the design elements of the VR home interface from the perspective of the designer’s intention and the users’ expectations, and proposed a map- ping relationship between the visual presentation form of the elements of the VR home interface and the user’s perception based on the experiment results.
Semantic Evaluation This study adopted Kansei Engineering Type 1 (KEPack) (Nagamachi, 1995) and users are required to use a series of adjectives (Kansei Words) to describe
their unique feelings about the VR home interface (Schütte et al., 2004). Firstly, we collected the Kansei Words via consulting e-commerce platform evaluation, real machine experience, user interviews, etc. Forty-six Kansei Words describing VR home interfaces have been sorted out and summari- zed. Then, we collected and sorted out thirty home interface samples of the mainstream VR HMDs. Five designers with 3 years of UI design experie- nce and VR experience were invited to use KJ method to eliminate words with high similarity or inapplicable to evaluate the interface. Fifteen Kansei Words suitable for the evaluation of the VR home interface were then filte- red out: “three-dimensional (3D)”, “future”, “dreamy”, “novel”, “florid”, “immersive”, “focused”, “cozy”, “attractive”, “soft”, “succinct”, “warm”, “dynamic”, “tired”, “broad”.
Thirty Participants with experience of using VR were recruited in the Kansei Words scoring. They were asked to watch a 1-minute video about the VR home interface samples and then measure the impression of the VRhome interface on a 9 points Likert scale, where one point represents “very disagree” and nine points represent “very agree”.
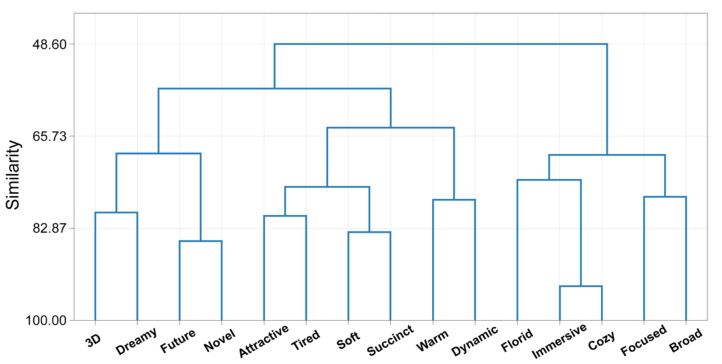
After obtaining the scores of Kansei words, cluster analysis (Tanoue et al. 1997; Nagamachi, 2004) was applied to reveal the connections between the words and allow for the selection of representatives for each cluster (see Figure 1). The dendrogram reported that those Kansei Words can be divided into three clusters. The first cluster includes “three dimensional”, “dreamy”, “future”and “novel”, which point to the character of a new thing, namely “future”. The second cluster includes “attractive”, “tired”, “soft”, “succinct”, “warm” and “dynamic”, which mainly describe the user’s feeling of comfortability, namely “comfortable”. The third cluster includes “florid”, “immersive”, “cozy”, “focused” and “broad”, which point to the user’s visual perception and concentration when using VR HMD, namely “immer- sive”. Based on the results, the three most representative Kansei Words were
Figure 1: The dendrogram from cluster analysis, which describe the correlation between kansei words visually.
An Analysis of User’s Perceptual Preferences in Virtual Reality Home Interface Design 115
obtained: “future”, “comfortable” and “immersive”). However, the relation- ship between users’ perceptual preferences and design elements in VR home interfaces needs to be further investigated.
The content of a typical VR home interface contains a series of card portals with different icons to represent the various system functions and information. Based on the relevant research, typically interface elements that have a great impact on user perception include layout (Altaboli and Lin, 2011; Deng and Wang, 2020), icons (Reinecke et al. 2013; Burmistrov et al. 2015), background (Gong et al., 2017; Kim et al.,2019; Nissen and Riedi, 2021), and the number of interface elements (Jin Tao et al. 2021). During the design process, the different layout forms, icon styles, number of cards, card background color, and the 3D background in the VR home interface seem to give different emotional impressions to users. Whether these diffe- rent design elements in VR home interfaces have different effects on users’ perceptual preferences remains to be further explored through experiments. Considering that it is difficult to standardize the 3D background in VR, which may affect users’ visual perception (Figueroa et al., 2017), this study will not analyze this element. Therefore, we conducted an experiment focused on the relationship between users’ perceptual preferences and the four VR interface design elements: layout form, icon style, number of cards, and card background color.
EXPERIMENT Participants
Twenty-six participants (11 males and 15 females) from Nanjing Forestry University participated in the experiment and received a payment (5 RMB) for their participation. They had normal vision or corrected-to-normal vision, no color blindness, and no cognitive or behavioral disorders. All participants had experience of using VR HMD.
Design and Materials This experiment used a 3 (layout form) × 2 (icon style) × 3 (number of inter- face cards) × 2 (card background color) full factorial design (see Table 1). The layout form consisted of the three most typical types of VR home inter- face: stretch, grid, and gallery, labeled as A1, A2, A3, and A4 respectively. In stretched type, the cards with contents are displayed from left to right. In grid type, the cards are displayed in equally spaced arrays on a grid of equal size. In gallery type, the cards are displayed from top to bottom, the top cards are larger and the bottom cards are smaller. The icon style con- sisted of two types: 2D flat icons and 3D neumoriphism icons, labeled as B1 and B2 respectively. The 3D neumoriphism icons were downloaded from the open-source website (https://3dicons.co) and redesigned through Blen- der and Photoshop. To avoid the interference of semantic differences, the semantics of the different icons in the two styles are identical. The number of cards consisted of three levels: 6 cards, 9–10 cards, and 15–16 cards as the number level of the card to adapt to different interface layouts, labeled as
Table 1. Examples of the ten sub-factors design types (A1, A2, …, D2) for the four VR interface design elements.
Table available in the original PDF paper.
C1, C2, and C3 respectively. The card background color consisted of two types chosen from Google (https://developers.google.com/vr/design/sticker- sheet): light mode (Hex value is #EEEEEE) and dark mode (Hex value is #212121), labeled as D1 and D2 respectively. To eliminate the interference of other colors to the participant’s perception, all the material colors were black, white, or gray. The environment color of VR was medium gray (Hex value is #818181).
The experiment program, with a total of thirty-six VR home interface samples, was developed by Unity 3D and ran on Meta Quest 2. The screen resolution of the HMD was 1832 × 1920 pixels per eye, while the FOV was 97
and the refresh rate was 90 Hz.
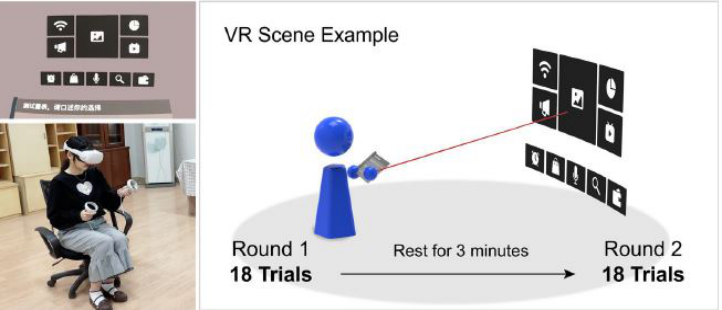
Procedure Participants were instructed to wear a Meta Quest 2 VR HMD in a seated position for the experiment and adjust the pupil distance of the VR HMD to ensure the VR picture was clear and visible (see Figure 2).
Thirty-six VR home interface samples were randomly divided into two rounds with 18 trials in each round. There was a 3-minutes break between the two rounds to prevent visual fatigue. In the experiment, subjects were required to view each VR home interface sample and then rate the degree of association between the current interface and the three representative Kansei
An Analysis of User’s Perceptual Preferences in Virtual Reality Home Interface Design 117
Figure 2: An example of thirty-six VR home interface samples, experimental scenario and experimental procedure.
Words based on their subjective perceptions through a 5-point Likert scale on their virtual left hand. Before the formal experiment, subjects were required to complete a 3-rounds pre-experiment to familiarize themselves with the experimental procedures and task procedures. The entire experiment lasted approximately 20 minutes.
RESULTS
All the sub-factors design types in thirty-six VR home interface samples were coded based on Quantitative Theory I (Tanoue et al. 1997; Chen et al. 2009; Jiang et al. 2021), and the sub-factors design types of the four VR interface elements were marked as “1”or “0”according to their design type “Adopted” or “Not Adopted”respectively. For example, if sub-factors design types of the layout form in sample 1 adopted “flat design”, not “grid type” or “gallery type”, then the code of “flat design” was labeled as “1”, and both the code of “grid type” and “gallery type” were labeled as “0”.
Given that the more the number of candidate prediction variables, the more the number of noise variables will be included in the model. The corre- lation between candidate prediction variables will affect the frequency of real prediction variables entering the model. To avoid the problem of multicolli- nearity between the ten sub-factors design types (A1, A2, …, D2), a one-way analysis of variance (ANOVA) on the three Kansei Words with the ten inde- pendent variables was conducted. Meanwhile, related scholars point out that using a lenient p-value would keep the really important predictor variables in the model (Steyerberg et al. 2001; Babyak, 2004), we moderately adjusted the p-value of significance to 0.3 ( * represents p < 0.3). Table 2 shows the p-value results of one-way analysis of variance on the three Kansei Words with the ten independent variables.
Subsequently, we analyzed the relationship between perceptual preferences and the four VR interface design elements by building the multiple regression model (1) (Matsubara and Nagamachi, 1997; Schütte et al. 2004). Significant sub-factor design types (A1, A2, …, D2) were taken as independent variables.
Table 2. The results of one-way ANOVA of the ten sub-factors design types.
The means of perceptual preference were taken as the dependent variable Y, and the weight coefficients of the independent variable (bA1, bA2, …, bD2) were taken as the regression coefficient.
The results of the multiple regression analysis for three representative Kansei Words are shown in Table 3. The multiple collinearity test of the model shows that VIF is less than 5, such that there was no collinearity problem and no correlation between interface elements.
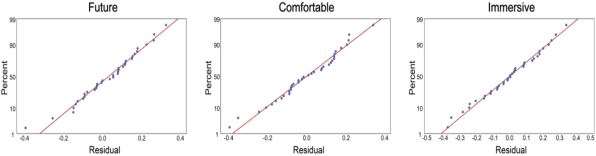
The regression models (2) (3) (4) are as follows The regression result shows that the R2 of “future”, “comfortable” and “immersive” models were 74.71%, 79.50% and 73.13% respectively. Figure 3 shows that the residu- als were normally distributed, indicating that the regression models were reasonable.
An Analysis of User’s Perceptual Preferences in Virtual Reality Home Interface Design 119
Figure 3: Normal probability plot of three representative kansei words.
DISCUSSION
It has long been known that user perception and experience in VR interactive systems are important, but most research has focused on the spatial properties of VR interfaces. As the core interface for users to perceive and understand the function distribution and composition of the entire VR system, the VR home interface determines the most important first impression of VR for consumers. Here, our results demonstrate that the different layout forms, icon styles, number of cards, card background color in the VR home interface do give different emotional impressions to users.
In the collection of Kansei Words, three representative Kansei words were selected “future”, “comfortable”and “immersive”according to user interface studies and cluster analysis. Based on these, we summarized the characte- ristics of the VR home interface and extracted the visual coding rules of the typical elements, conducting an experiment to further explore the dif- ferent effects of these different design elements of the VR home interface on users’ perceptual preferences. Specifically, the icon style, layout form, and card background color of the VR home interface influenced the “future” perception, while the change in the number of cards was not related to this perception. On the “comfort” perception, the number of cards, icon style, and layout form influenced users’ preferences, while card background color had no effect on them. On the “immersive” perception, the number of cards, layout form, and card background color played important roles, while icon style did not affect this perception. Based on the regression coefficients, we found evidence that “future” perception was most influenced by the icon style, i.e., 2D flat design icons make users feel very futuristic, but light color card background and grid type layout are negative for “future” perception. Conversely, the “comfort” perception was most influenced by the interface layout, i.e., the crowding grid type makes users feel narrow. The “immersion” perception was most influenced by the number of cards, i.e., fewer cards (6 cards) in the VR home interface were good for giving users immersion, while too many cards (15-16 cards) hindered the comfort and immersion. One explanation for the difference in the effects of the number of cards in the VR home interface is the complexity, as high-complexity stimuli are har- der to process, remember, and reproduce than low-complexity stimuli when their familiarity is consistent (Zhang et al., 2020). In other words, the more cards there were in the VR home interface, the more information the interface contains, the higher the complexity of the interface becomes, and the user’s perception was affected accordingly.
In addition, this experiment provided evidence that layout form has the most extensive impact on users’ perception, which means that the layout form of the VR home interface plays a leading role in the user’s perception. In the discussion section with the participants at the end of the experiment, we learned that about 70% of the participants disliked the grid type layout because they found these crowding cards with the same size to be more com- mon and difficult to get them excited. Therefore, if designers want users to become energized when starting their VR experience, they should avoid using the grid type layout in the VR home interface.
CONCLUSION
In summary, the contributions of our research are reporting experience and insight into the problems encountered in how to enhance the users’ perceptual experience by optimizing the design elements of the VR home interface. The current study provides evidence that the layout, icon style, and the number of cards in the VR home interface component were the most important ele- ments that affect the users’ potential perception, and these interface design elements have varying effects on user perception preferences: the icon style has the greatest impact on “future” perception, the interface layout has the greatest impact on “comfort” perception, and the number of cards has the greatest impact on “immersion” perception. Moreover, the results support the argument that incorporating users’ perceptual preferences by Kansei eva- luation into the design elements in the VR home interface can better improve the user experience to meet different users’ needs. Therefore, VR designers can diversify these design elements and sub-factors in the VR home interface according to different user emotional needs when designing. The research results can provide some reference for the design of the VR home interfaces in line with users’ perceptual needs and help improve the efficiency of VR home interface design.
ACKNOWLEDGMENT
This paper is supported by the National Nature Science Foundation of China Grant No. 72201128 and the Industry-University Cooperation Collaborative Education Program of the Chinese Ministry of Education No. 202102298009.
REFERENCES
Altaboli, A. and Lin, Y. (2011). Investigating effects of screen layout elements on interface and screen design aesthetics. Advances in Human-Computer Intera- ction, 2011, pp. 1–10. Babyak, M. A. (2004). What you see may not be what you get: a brief, non-
technical introduction to overfitting in regression-type models. Psychosomatic Medicine, 66(3), pp. 411–421. Barbieri, L., Bruno, F. and Muzzupappa, M. (2018). User-centered design of a virtual reality exhibit for archaeological museums. International Journal on Interactive Design and Manufacturing (IJIDeM), 12(2), pp. 561–571.
An Analysis of User’s Perceptual Preferences in Virtual Reality Home Interface Design 121
Burmistrov, I., Zlokazova, T., Izmalkova, A. and Leonova, A. (2015). Flat design vs traditional design: Comparative experimental study. In Human-Computer Interaction–INTERACT 2015: 15th IFIP TC 13 International Conference, Bam- berg, Germany, September 14-18, 2015, Proceedings, Part II 15 (pp. 106–114). Springer International Publishing. Cai, Y., Chiew, R., Nay, Z. T., Indhumathi, C. and Huang, L. (2017). Design and deve-
lopment of VR learning environments for children with ASD. Interactive Learning Environments, 25(8), pp. 1098–1109. Chen, C. F., Yeh, C. H. and Lin, Y. C., 2009. A kansei engineering approach to eco-product form design. Proc. of IASDR09. Cuban, L. (2003). Oversold and underused. In Oversold and Underused. Harvard
University Press. Deng, L. and Wang, G. (2020). Quantitative evaluation of visual aesthetics of human-machine interaction interface layout. Computational Intelligence and Neuroscience, 2020. Figueroa, J. C. M., Arellano, R. A. B. and Calinisan, J. M. E. (2018). A compa-
rative study of virtual reality and 2D display methods in visual search in real scenes. In Advances in Human Factors in Simulation and Modeling: Proceedings of the AHFE 2017 International Conference on Human Factors in Simulation and Modeling, July 17–21, 2017, The Westin Bonaventure Hotel, Los Angeles, California, USA 8 (pp. 366–377). Springer International Publishing. Fu, Q., Lv, J., Tang, S. and Xie, Q. (2020). Optimal design of virtual reality visualization interface based on Kansei engineering image space research. Sym- metry, 12(10), 1722. Gong, R., Wang, Q., Hai, Y.and Shao, X.(2017). Investigation on factors to influence
color emotion and color preference responses. Optik, 136, pp. 71–78. Hou, K. C., Ho, C. H. and Lu, Y. N. (2011), October. Balance between Beauty and Usability in Kansei Interface for Smartphone. In IASDR 2011 4th International Congress of International Association of Societies of Design Research (pp. 1–6). Humphreys, G. W. and Bruce, V. (2021). Visual cognition: Computational, experi-
mental, and neuropsychological perspectives. Psychology Press. Jiang, T., Yang, C., Zhou, L. and Xue, C. (2021). Using Kansei Engineering to Analyze Consumers’ Product Attribute Preferences. In Advances in Ergonomics in Design: Proceedings of the AHFE 2021 Virtual Conference on Ergonomics in Design, July 25-29, 2021, USA (pp. 990-997). Springer International Publishing. Jin, T., MING, C. Y., ZHOU, S. F. and HE, J. M. (2021). Impact mechanism of icon
layout on visual search performance. Journal of Northeastern University (Natural Science), 42(11), pp. 1579–1584. Kim, J., Lee, J. and Choi, D. (2003). Designing emotionally evocative homepages: an empirical study of the quantitative relations between design factors and emo- tional dimensions. International Journal of Human-Computer Studies, 59(6), pp. 899–940. Kim, K., Erickson, A., Lambert, A., Bruder, G. and Welch, G. (2019, October). Effects
of dark mode on visual fatigue and acuity in optical see-through head-mounted displays. In Symposium on spatial user interaction (pp. 1–9). Lee, S., Harada, A. and Stappers, P. J. (2002). Pleasure with products: Design based on Kansei. Pleasure with products: Beyond usability, 219, p. 229. Matsubara, Y. and Nagamachi, M. (1997). Hybrid Kansei engineering system and
design support. International Journal of Industrial Ergonomics, 19(2), pp. 81–92.
Nagamachi, M. (1995). Kansei engineering: a new ergonomic consumer-oriented technology for product development. International Journal of industrial ergono- mics, 15(1), pp. 3–11. Nagamachi, M. (2004). Kansei engineering. In Handbook of human factors and
ergonomics methods (pp. 794–799). CRC Press. Nissen, A. and Riedl, R. (2021). Design mode, color, and button shape: a pilot study on the neural effects of website perception. In Information Systems and Neuro- science: NeuroIS Retreat 2021 (pp. 192–203). Springer International Publishing. Radianti, J., Majchrzak, T. A., Fromm, J. and Wohlgenannt, I. (2020). A systema-
tic review of immersive virtual reality applications for higher education: Design elements, lessons learned, and research agenda. Computers & Education, 147, p. 103778. Reinecke, K., Yeh, T., Miratrix, L., Mardiko, R., Zhao, Y., Liu, J. and Gajos, K. Z.
(2013, April). Predicting users’ first impressions of website aesthetics with a quan- tification of perceived visual complexity and colorfulness. In Proceedings of the SIGCHI conference on human factors in computing systems (pp. 2049–2058). Schütte*, S. T., Eklund, J., Axelsson, J. R. and Nagamachi, M. (2004). Concepts, methods and tools in Kansei engineering. Theoretical issues in ergonomics science, 5(3), pp. 214–231. Shabiralyani, G., Hasan, K. S., Hamad, N. and Iqbal, N. (2015). Impact of Visual
Aids in Enhancing the Learning Process Case Research: District Dera Ghazi Khan. Journal of education and practice, 6(19), pp. 226–233. Steyerberg, E. W., Eijkemans, M. J., Harrell Jr, F. E. and Habbema, J. D. F. (2001). Prognostic modeling with logistic regression analysis: in search of a sensible strategy in small data sets. Medical Decision Making, 21(1), pp. 45–56. Tanoue, C., Ishizaka, K. and Nagamachi, M. (1997). Kansei Engineering: A
study on perception of vehicle interior image. International journal of industrial ergonomics, 19(2), pp. 115–128. Zhang, J., Liu, X. L., So, M. and Reder, L. M. (2020). Familiarity acts as a reduction in objective complexity. Memory & Cognition, 48, pp. 1376–1387.
LISTED IN THE AHFE DIGITAL BOOKSTORE CATALOGUE
Explore the complete digital volume
Human Factors in Virtual Environments and Game Design
Read this individual research paper free through the original publisher, or explore the full digital proceedings book.
ISBN 978-1-958651-72-8
Explore this ISBN in the AHFE Bookstore ↗Listed in the July 2026 bookstore catalogue; search by ISBN to confirm current availability · Digital book purchase optional