Mashrura Musharraf, Jennifer Smith, Brian Veitch, Faisal Khan (2023). Mining Students' Digital Footprints to Enhance Simulator Training. In: Human Factors in Transportation. AHFE Open Access, vol. 95, pp. 686–697. https://doi.org/10.54941/ahfe1003854
Offshore emergencies are dynamic in nature and personnel on board are challenged with stress, uncertainty, and complexity. The lack of knowledge about how these factors affect peoples’ egress performance in emergencies undermines organizations’ ability to manage safety. A solid understanding of the impact of these factors on egress performance can help design better training programs. This paper investigates the effect of three factors: hazard proximity (to reflect stress), information quality (to reflect uncertainty), and situation familiarity (to reflect complexity) on seven different performance criteria of emergency egress. The performance criteria include mustering in time, maintaining a safe pace, keeping fire doors closed, avoiding interaction with hazards, reporting at the correct muster location, selecting appropriate personal protective (PP) gear, and selecting an efficient egress route. The investigation is driven by digital footprints of individuals performing in a training simulator under the influence of these factors. Besides measuring the impact of the factors, the data is also used to mine correlation among the performance criteria themselves (i.e. if a participant selects an efficient egress route, does that mean s/he will muster in time as well?). Finally, the data were analyzed to investigate if task performance can be modelled as a function of the factors that were identified to have a significant impact. Plotting the relationship between a performance criteria (outcome variables) and the significant factors (predictors) helps visualize the plausibility of a predictive model. In cases where predictive models were deemed plausible, binary logistic regression models were used as all performance criteria were categorical and dichotomous. The models predicted the probability of success in the performance criteria under the pressure of an emergency. The predictions are an indication of the degree of emergency preparedness of participants subsequent to training. A high probability of success in each criterion increases confidence in the training program. A low probability of success in one or more criteria highlights the gap in the training. The corresponding logistic regression model can provide direction on how the gap can be addressed.
Mining Students’ Digital Footprints to Enhance Simulator Training 687
INTRODUCTION
In the offshore oil and gas industry, facilities tend to be remote and external emergency response is not immediate (Flin, Slaven, & Stewart, 1996). During emergencies, the crisis must be dealt with initially by the installation’s own personnel and hence the success depends on the performance of the personnel on board. Emergency conditions are generally very dynamic in nature and personnel on board are challenged with high risk, time pressure, the com- plexity of the situation, uncertainty, stress, and responsibility for lives (Flin & Slaven, 1995). The ability of individuals to handle offshore emergencies depends on the impact these factors have on their performance.
This paper investigates the impact of three factors – hazard proximity (to reflect stress), information quality (to reflect uncertainty), and situation fami- liarity (to reflect complexity) – on 7 different performance criteria of offshore emergency egress (Groth & Mosleh, 2012). The performance criteria, defi- ned by subject matter experts (Smith & Veitch, 2019), include: mustering in time, maintaining a safe pace, keeping fire doors closed, avoiding interaction with hazards, reporting at the correct muster location, selecting appropriate personal protective (PP) gear, and selecting an efficient egress route. As data needed to measure the impact of the factors on human performance during an emergency are not readily available, they were collected by conducting an experiment in an offshore emergency preparedness training simulator called AVERT.
AVERT replicates an offshore petroleum facility in which users can learn knowledge and skills regarding emergency safety procedures. AVERT allows designing training programs that virtually introduce users to the platform layout, alarm types, potential hazards, and appropriate emergency responses. Though the primary purpose of AVERT is offshore emergency preparedness training, for the purpose of this paper AVERT was used as a research lab, where participants were exposed to a range of emergency scenarios with var- ying levels of the 3 factors, and their performance was measured with respect to the 7 different criteria.
The human performance data collected in AVERT have been analyzed in this paper for three purposes. First, the data were analyzed to quantify the impact of the 3 factors on the 7 different performance criteria. An understan- ding of the impact of the factors on human performance would help design better training programs and enhance organization’s ability to manage safety (Musharraf et al., 2019).
Next, the data were analyzed to see if the performance criteria themselves are correlated (if success or failure in one criterion can be used as an indicator of success or failure in other criteria). For correlated criteria, failure in one criterion can help early diagnosis of potential failure in the other(s) (Larusson & White, 2014). This could pave the path for adaptive training resulting in shorter training time. The findings can also guide designing assessment materials that test the learning objectives independently if required.
Finally, data were analyzed to investigate if performance in each criterion can be modelled as a function of the factors that were identified to have a significant impact on it. In cases where predictive models were deemed
plausible, binary logistic regression models were used. The logistic regression models of performance criteria were used to predict participants’ likelihood of success in future emergency situations. The probability of success servers as a measure of the trainees’ emergency preparedness level subsequent to training. A high probability of success in each criterion increases confidence in the training program. A low probability of success in one or more criteria highlights the gap in the training.
EXPERIMENTAL DESIGN AND DATA COLLECTION The data used in this paper were originally collected during an experimental study presented in Musharraf et al. (2019). 38 participants took part in the study. Samples of convenience method was followed for participant recrui- tment (Ritter et al., 2013). The participants were naïve concerning any detail of the experimental design, they were not employed in the offshore oil and gas industry, and they were not familiar with the offshore platform. Prior to the experimental study, participants were trained to competence in basic off- shore emergency preparedness. The training was provided in AVERT using a simulation based mastery learning approach (Smith & Veitch, 2019). At the end of the training, all participants were able to demonstrate the skills required to successfully egress during an emergency situation. It was expected that all participants will be highly reliable under the pressure of emergency situations.
During the study, the participants were presented with a range of simulated emergency scenarios. In all scenarios, participants were required to egress following all safety procedures, and muster at their designated muster station or lifeboat station, depending on the context. A total of 8 scenarios were created in AVERT by varying 3 factors at 2 different levels. The 3 factors were situation familiarity, hazard proximity, and information quality.
Situation familiarity refers to participants’ familiarity with the starting location of a given context. This factor was varied at two levels. In half of the scenarios, the participant started in a highly familiar location (their cabin). In the other half, the participant started in a less familiar location (bridge). Hazard proximity refers to how close the participants were to a hazard. This factor was also varied at 2 levels. In half of the scenarios, the egress routes were free of hazards. In the other half, some of the egress routes were blo- cked by a hazard. The third factor, information quality, refers to the quality of public address (PA) announcements during an emergency. In half of the scenarios, the PA announcements had all relevant information for the parti- cipant to make an informed decision on how to muster. In the other half, the PA announcement provided less complete information about the situation.
The study investigated the impact of the above factors on 7 criteria. The participants’ performance in AVERT were assessed based on the following criteria: mustering in time, maintaining a safe pace, keeping fire doors closed, avoiding interaction with hazards, reporting at the correct muster location, selecting appropriate personal protective (PP) gear, and selecting an effici- ent egress route. Performance metrics evident to each criterion were tracked during each scenario.
Mining Students’ Digital Footprints to Enhance Simulator Training 689
METHODOLOGY
Three approaches were explored to investigate the influence of factors on performance criteria, mine for correlations between the performance crite- ria, and model the performance criteria as a function of the factors. This section describes the methods used for each approach and provide examples to explain the analysis.
Measuring Impact of Factors on Performance Criteria To identify plausible impact of the different factors on each performance cri- teria, balloon plots were drawn. The plots help to visualize the contingency tables. Figure 1(a) shows an example balloon plot representing the impact of situation familiarity on the performance criteria selecting an efficient egress route. The plot shows, in general, the percentage of participants selecting the efficient route was higher compared to the percentage of participants selecting an inefficient route.
The plot indicates that high situation familiarity (starting at the cabin) is positively correlated with efficient route selection. Low familiarity with the situation (starting at the bridge) increases the chances of participants sele- cting an inefficient route. To investigate the significance of the correlation, Pearson’s chi-squared test (with simulated p-value) was conducted. The signi- ficance level was set to 5%. The result shows a χ2 value of 110.06 with a p-value of 0.001 which provides evidence to a strong correlation between situation familiarity and route selection. The impact of all 3 factors on all 7 performance criteria were studied. Section 4.1 presents the results.
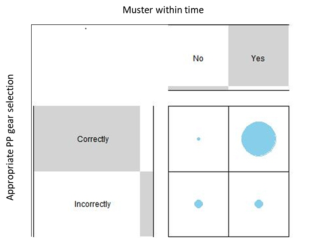
Mining Correlation Between Performance Criteria Correlation between the task performance criteria was investigated to deter- mine if success/failure in one criterion can be used as an indication of success/failure in other criteria as well. Balloon plots were drawn to visualize if there is a pattern in the data that shows a possible correlation. Figure 1(b) shows an example plot depicting the relationship between appropriate PP gear selection and mustering within time.
Figure 1: (a) Balloon plot showing the relationship between situation familiarity and route selection (b) Balloon plot showing the relationship between appropriate PP gear selection and successfully mustering within time.
Figure 1(b) indicates a positive relationship between appropriate PP gear selection and successfully mustering within time. The significance of the rela- tionship was tested using Pearson’s chi-squared test with a significance level of 5%. The test results in a χ2 value of 120.39 and a p-value of 0.001 pro- viding evidence of a strong correlation between the performance criterion appropriate PP gear selection and mustering within time.
The relationship between each pair of task performance criteria was investigated using the same approach. The results are presented in Section 4.2.
Modelling Performance Criteria as a Function of the Factors Once significant influencing factors were identified for each task performa- nce criterion, the relationship was plotted to see if a predictive model is plausible. For cases where a predictive model was deemed plausible, the per- formance criteria (outcome variables) were modelled as a function of the significant factors (predictors) using logistic regression. Logistic regression is widely used for the analysis and prediction of categorical and dichoto- mous outcomes which was the case for all the performance criteria (Peng, Lee, & Ingersoll, 2002). Compared to ordinary least squares regression or linear discriminant functions, the statistical assumptions in logistic regression is less strict, leading to its wide use in educational research (Azcona, Hsiao, & Smeaton, 2019; Dey & Astin, 1993; Kovacic, 2010; Peng, So, Stage, & St. John, 2002).
Even though participants performed in multiple scenarios, the order of per- formance was randomized, and no feedback on performance was provided. The learning effect between scenarios was considered minimal and it was assumed that the performance in one scenario did not affect another. This makes the observations independent and logistic regression a viable model.
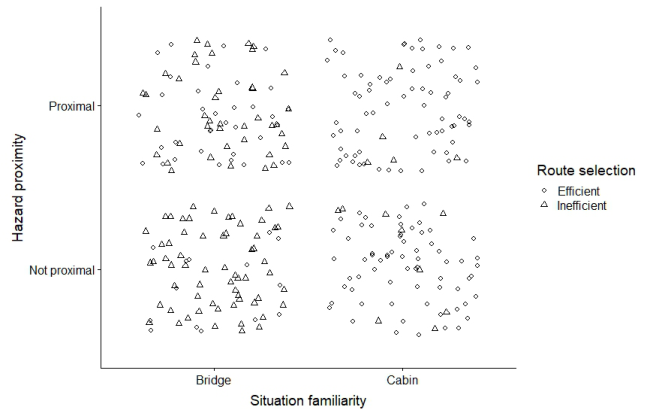
The logistic regression model of the performance criterion route sele- ction will be discussed here as an example. Section 3.1 discussed how situ- ation familiarity was a significant influencing factor for efficient route selection. Besides situation familiarity, hazard proximity was also found to have a significant impact on efficient route selection. The relationship between route selection and the factors situation familiarity and hazard pro- ximity is shown in Figure 2. Figure 2 indicates situation familiarity to be a useful predictor (i.e. route selection can easily be classified as efficient or inefficient based on situation familiarity). Hazard proximity shows some potential to be a predictor (i.e., the number of efficient route selection is ove- rall higher when a hazard is proximal) but does not appear to be as strong as situation familiarity.
According to the relationship shown in Figure 2, a predictive model seemed plausible. Two predictor logistic regression was used to model route sele- ction as a function of situation familiarity and hazard proximity. Before per- forming the regression, data (38 participants performing 8 scenarios = 304 observations) were randomly partitioned into training and testing data sets. 80% of the total data (244 observations) were used to train the model, and 20% (60 observations) were used for testing.
Mining Students’ Digital Footprints to Enhance Simulator Training 691
Figure 2: Relationship between the performance criteria route selection (outcome variable) and the factors situation familiarity and hazard proximity (predictors). A small amount of random variation is added to the location of each point to handle overplotting caused by discreteness.
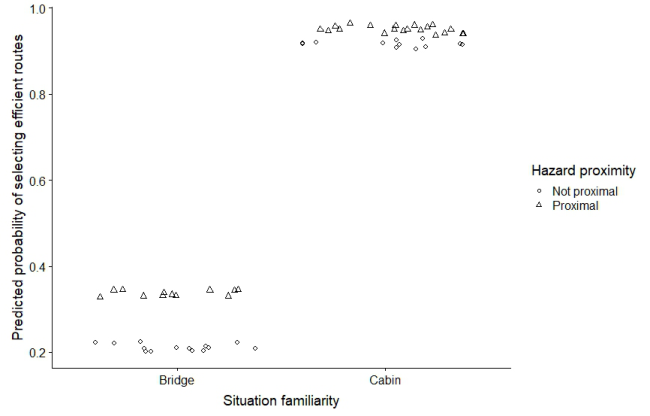
Equation 1 shows the logistic regression model of route selection. As shown in equation 1, the log of the odds of efficient route selection was found to be positively correlated to both situation familiarity and hazard proximity. If a participant is familiar with the situation (Situation famili- arity = Cabin) and a hazard is proximal (Hazard proximity = Proximal), s/he is more likely to select the efficient egress route. When starting from the cabin, participants are 22 (=e3.10494) times more likely to select an efficient route compared to when starting from the bridge. Similarly, when a hazard is proximal, participants are 3 (=e1.1665) times more likely to select an effi- cient route compared to when there is no proximal hazard. Figure 3 shows a graphical representation of the logistic regression model.
The plausibility of a predictive model was checked for all task performance criteria and a logistic regression model was developed accordingly. Section 4.3 presents and discusses the results.
Evaluations of the Logistic Regression Model Each of the developed logistic regression models was evaluated before use. Evaluation of the logistic regression model of route selection will be discussed here as an example.
To validate the predicted probabilities of the regression model, a compari- son between observed and predicted frequencies for route selection was done
Figure 3: Predicted probability of efficient route selection with respect to situation familiarity and hazard proximity (a small amount of random variation is added to the location of each point to handle overplotting caused by discreteness).Table 1. The observed and predicted frequencies for route selection using logistic regression model with the cut-off of 0.8.
using the testing data set (60 observations). Table 1 summarizes the results of the comparison. The cut-off point was set to 0.8, stating any probability higher than 80% will be classified as an efficient route selection.
As shown in Table 1, the overall prediction accuracy for the logistic regres- sion model is 80%, which is a significant improvement over the chance level. The prediction for inefficient route selection was more accurate (specifi- city 96%) compared to the prediction of efficient route selection (sensitivity 70%). In only one instance a participant was incorrectly predicted to take the efficient route while in reality s/he took the inefficient route (false- positive rate 3.7%). The false-negative was comparatively higher (33%) resulting from the fact that 11 actual efficient route selections were incorre- ctly predicted as inefficient route selection. Both the high specificity and low false-positive rate are beneficial from a training curriculum design perspe- ctive. This ensures that participants who are likely to make mistakes would be diagnosed early and can be paired up with appropriate training measures.
Mining Students’ Digital Footprints to Enhance Simulator Training 693
RESULTS AND DISCUSSIONS Impact of Factors on Performance Criteria
The impact of all 3 factors on all 7 performance criteria was investigated using the approach described in Section 3.1. Table 2 presents the p-values found while investigating the correlation between the factors and the task performance criteria.
As shown in Table 2, for the task performance criteria – maintaining a safe pace, avoiding interaction with hazard, and reporting at the correct muster location – no strong correlation was found with any of the factors. Irrespe- ctive of the status of the factors, participants were able to perform well in these criteria with very few exceptions (1% failure in maintaining safe pace and avoiding interaction with hazard, 4% failure in reporting at the correct muster location). Multiple performance criteria including mustering in time, keeping fire doors closed, selecting appropriate PP gear, and selecting effici- ent routes were found to have strong correlations with situation familiarity. Besides situation familiarity, the performance criteria selecting efficient rou- tes was also found to be strongly correlated with hazard proximity. None of the task performance criteria were found to be correlated to information quality.
Correlation Between Different Performance Criteria As described in Section 3.2, the correlation between different performa- nce criteria was investigated to see if success/failure in one criterion can be used as an indication of success/failure in other criteria. Selecting efficient route was found to be significantly correlated with mustering in time (p-value 0.0004998), avoiding interaction with hazard (p-value 0.02149), reporting at the correct muster location (p-value 0.0004998), and selecting appropriate PP gear (p-value 0.0004998). As correlation does not imply causation, the replay videos of participants’ performance were viewed to understand if there is a plausible cause-effect relationship. The videos helped to understand the nature of different tasks and revealed that selecting the efficient route by defi- nition caused the participant to muster in time (as efficient means shortest),
Table 2. p-values from Pearson’s chi-squared test. The values are representative of the correlation between the factors and the performance criteria.
Table available in the original PDF paper.
Factors Performance criteria Situation familiarity Hazard proximity Information quality
Mustering in time 0.002 1.000 1.000 Maintaining safe pace 0.618 0.614 1.000 Keeping fire doors closed 0.016 1.000 1.000 Avoiding interaction with hazard 0.631 0.112 0.632 Reporting at the correct muster location 0.082 0.566 0.577 Selecting appropriate PP gear 0.001 0.718 0.710 Selecting an efficient egress route 0.001 0.007 0.149
helped them avoid any possible interaction with hazard (as efficient means safe), got them to the correct muster location (as efficient means getting to the designated destination), and allowed them to collect appropriate PP gear (as efficient means an optimal path to the gear).
Mustering in time was found to be significantly correlated with reporting at the correct muster location and collecting appropriate PP gear. Again, the replay videos helped to investigate if there is a cause-effect relationship. The participants who ran out of time could not finish the scenario, and hence did not report at the correct muster location. The participants who struggled to find the PP gear spent a significant amount of time on the task resulting in failure to muster in time.
Results of the correlation and causation analysis are valuable for the development of emergency preparedness training curriculum. For correla- ted criteria, failure in one criterion can help early diagnosis of potential failure in the other(s). This could pave the path for adaptive training. The findings can also guide the design of assessment materials that test the learning objectives independently. For example, as the results show, the par- ticipants who ran out of time not only failed in the criterion mustering in time but also failed in reporting at the correct muster location. In reality though, as they never finished the scenario, a conclusion cannot be drawn on whether or not they knew the correct muster location and the muster procedure.
Modelling Performance Criteria as a Function of the Factors Once significant influencing factors were identified for each task perfor- mance criteria, the relationship was plotted to see if a predictive model is plausible. For cases where a predictive model was deemed plausible, the performance criteria (outcome variables) were modeled as a function of the significant factors (predictors).
Section 3.3 discusses modeling the performance criteria efficient route selection as a function of the predictors situation familiarity and hazard pro- ximity. The same process was followed for performance criteria mustering in time, keeping fire doors closed, and selecting appropriate PP gear all of which were identified to be influenced by one factor only: situation familia- rity. The remaining performance criteria were not found to be influenced by any of the factors and so cannot be modeled as a function of the factors.
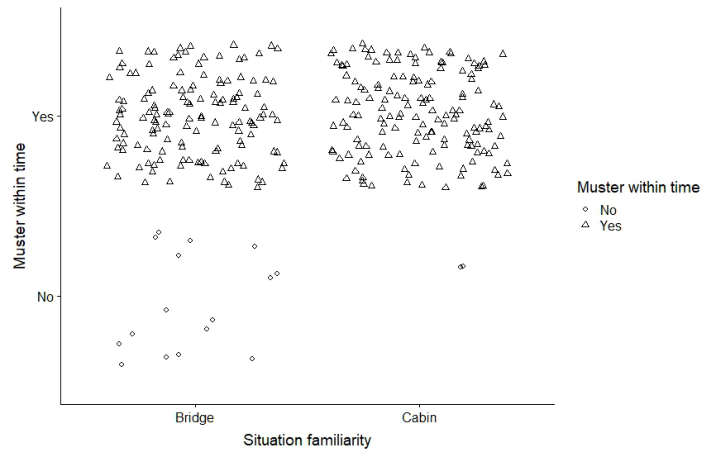
The relationship between the performance criteria mustering in time, kee- ping fire doors closed, selecting appropriate PP gear, and the predictor situation familiarity were plotted to investigate if a predictive model is plau- sible. The relationship between the performance criterion mustering in time and the factor situation familiarity is shown in Figure 4. It shows that the number of instances where participants failed to muster within time was higher when they started in the bridge compared to when they started in their cabin. However, as Figure 4 illustrates, it is impossible to classify the data points into success versus failure solely based on situation familiarity. The findings were the same for keeping fire doors closed and selecting appropriate PP gear.
Mining Students’ Digital Footprints to Enhance Simulator Training 695
Figure 4: Relationship between the performance criterion mustering within time and the factor situation familiarity.
Based on the plots, a predictive model for the performance criteria muste- ring in time, keeping fire doors closed, and selecting appropriate PP gear was deemed implausible.
CONCLUSION
This paper uses digital footprints of individuals to a) measure the impact of hazard proximity (to reflect stress), information quality (to reflect uncer- tainty), and situation familiarity (to reflect complexity) on selected per- formance criteria during emergency egress, b) mine correlation among the performance criteria, and c) model the performance criteria as a function of significant factors, if plausible.
Results show that among the 3 different factors situation familiarity had the strongest influence on a range of performance criteria including muste- ring in time, keeping fire doors closed, selecting appropriate PP gear, and selecting efficient routes. Hazard proximity only had an influence on the criterion efficient route selection. However, the assumption that the Hazard proximity factor adequately reflects stress in emergency egress a limitation of this work. Information quality did not have an evident influence on any of the performance criteria. A solid understanding of the impact of these factors on people’s performance in emergencies can inform the design of trai- ning programs that are more focused on the influential factors and in turn ensure personnel safety during emergencies.
The correlation mining revealed that an efficient route selection was highly correlated with mustering in time, avoiding interaction with hazard, reporting at the correct muster location, and selecting appropriate PP gear. Mustering
in time was also found to be correlated to reporting at the correct muster location and collecting appropriate PP gear. For these correlated criteria, fai- lure in one criterion can be used as an indicator for potential failure in the others. Such early diagnosis can help pave the path for adaptive training and assessment.
Among the 7 performance criteria, only route selection could be model- led as a function of the factors situation familiarity and hazard proximity. A binary logistic regression model was used for this purpose. The developed logistic regression model enabled the prediction of trainee success in sele- cting efficient routes in future emergency situations with 80% accuracy. Such early diagnosis would allow to pair up the trainees with appropriate training measures.
Overall, the use of students’ digital footprints and logistic regression models to understand the influence of factors on simulation training perfor- mance have broader applications in educational research and are not limited to the context of offshore emergency egress as demonstrated in this paper.
ACKNOWLEDGEMENT
This project was supported in part by collaborative research funding from the National Research Council of Canada’s Artificial Intelligence for Logistics Program.
REFERENCES
Azcona, D., Hsiao, I. H., & Smeaton, A. F. (2019). Detecting students-at-risk in computer programming classes with learning analytics from students’ digital footprints. User Modeling and User-Adapted Interaction, 1–30. Dey, E. L., & Astin, A. W. (1993). Statistical alternatives for studying college student
retention: A comparative analysis of logit, probit, and linear regression. Research in Higher Education, 34(5), 569–581. Flin, R. H., & Slaven, G. M. (1995). Identifying the Right Stuff: Selecting and Training On-Scene Emergency Commanders. Journal of Contingencies and Crisis Management, 3(2), 113–123. Flin, R., Slaven, G., & Stewart, K. (1996). Emergency decision making in the offshore
oil and gas industry. Human Factors, 38(2), 262–277. Groth, K. M., & Mosleh, A. (2012). A data-informed PIF hierarchy for model-based human reliability analysis. Reliability Engineering and System Safety, 108, 154– 174. Kovacic, Z. (2010). Early Prediction of Student Success: Mining Students Enrolment
Data. Proceedings of the 2010 InSITE Conference, 647–665. Larusson, J. A., & White, B. (2014). Learning analytics: From research to practice.
Learning Analytics: From Research to Practice. Springer. Musharraf, M., Moyle, A., Khan, F., & Veitch, B. (2019). Using simulator data to facilitate human reliability analysis. Journal of Offshore Mechanics and Arctic Engineering, 141(2). Peng, C. Y. J., Lee, K. L., & Ingersoll, G. M. (2002). An introduction to logistic
regression analysis and reporting. Journal of Educational Research, 96(1), 3–14.
Mining Students’ Digital Footprints to Enhance Simulator Training 697
Peng, C. Y. J., So, T. S. H., Stage, F. K., & St. John, E. P. (2002). The use and interpretation of logistic regression in higher education journals: 1988–1999. Research in Higher Education, 43(3), 259–293. Ritter, F. E., Kim, J. W., Morgan, J. H., & Carlson, R. A. (2013). Running behavioral
studies with human participants: A practical guide. SAGE Publications. Smith, J., & Veitch, B. (2019). A better way to train personnel to be safe in emergencies. ASCE-ASME Journal of Risk and Uncertainty in Engineering Systems (Special Issue on Human Factors Engineering for Harsh Environments), 5(1), 011003.
LISTED IN THE AHFE DIGITAL BOOKSTORE CATALOGUE
Explore the complete digital volume
Human Factors in Transportation
Read this individual research paper free through the original publisher, or explore the full digital proceedings book.
ISBN 978-1-958651-71-1
Explore this ISBN in the AHFE Bookstore ↗Listed in the July 2026 bookstore catalogue; search by ISBN to confirm current availability · Digital book purchase optional