Cong Liu, Sibghat Asad, Mashrura Musharraf (2026). Explainable decision support for icebreaker assistance estimation. In: Advances in Human Factors of Transportation. AHFE Open Access, vol. 224, pp. 580–590. https://doi.org/10.54941/ahfe1007886
Safe and efficient navigation in ice-covered waters often depends on timely and accurate estimations of the need for icebreaker assistance. Currently, icebreaker assistance needs are assessed by experienced icebreaker captains based on their own judgment, which can be subjective. Data-driven models have been developed to support this non-trivial estimation, which involves several interconnected factors, including traffic restrictions, ice and weather conditions, and vessel characteristics. The existing study has investigated black box models that achieve great decision accuracy. However, black-box models are limited by poor explainability for end users. This gap reduces end-users’ trust and hinders the adoption of intelligent models in ice navigation. Our previous work (Liu et al., 2025) developed a deep learning-based ensemble model for estimating the need for icebreaker assistance and primarily focused on model predictive performance. This study aims to enable the model’s explainability without compromising the predictive accuracy. Employing SHapley Additive exPlanations (SHAP), we investigate how individual features affect the predicted probability of requiring icebreaker assistance relative to the model’s average prediction at both local and global levels. At the local level, SHAP illustrates how different input features contribute to a single prediction, while at the global level, it summarizes the contributions of these features across all predictions. The explainable results are verified using historical data in the Baltic Sea. The findings indicate that the model can achieve high predictive performance while ensuring explainability through SHAP-based explanations. The outcomes of this paper have the potential to support human-comprehensible explanations, which will help in the evaluation of trust in intelligent decision support systems in the near future.
The northern Baltic Sea is covered by ice for around five months every year (Meier et al., 2022). Ice conditions significantly affect ship manoeuvrability and operability, resulting in two navigation modes in the region: icebreaker assistance and independent navigation. When a merchant vessel is unable to navigate through the ice independently, icebreaker assistance is required to break the ice and help the ship to proceed safely through ice-covered waters. Currently, the need for icebreaker assistance is assessed by experienced icebreaker captains, a process that can be subjective due to differences in individual experience and judgment. To provide a unified estimation Received January 30, 2026; Revised April 5, 2026; Accepted April 22, 2026; Available online July 20, 2026
Explainable Decision Support for Icebreaker Assistance Estimation 581 procedure and enhance the intelligence of maritime traffic management, several studies have begun to develop data-driven models to support this task (e.g., Liu et al., 2024; Liu et al., 2025), although the number of such studies remains limited.
Accurate estimation of the need for icebreaker assistance is critical for ensuring both safety and efficiency in maritime traffic management in the Baltic Sea. Because such decisions involve high operational risk and must be effectively interpreted and utilized by human operators, a model supporting this task needs to balance accurate prediction performance and explainability. The self-explanatory models, such as decision trees and logistic regression, can present the feature importance for all data points using model coefficients (Marcílio & Eler, 2020). Liu et al. (2024) adopted logistic regression to identify the factors influencing the need for icebreaker assistance. However, the model does not perform well on the prediction task due to the model’s simplicity and the unbalanced nature of the winter navigation dataset. To further improve data-driven models’ prediction performance, Liu et al. (2025) developed a Neural Oblivious Decision Ensembles (NODE) model, a deep learning-based architecture for predicting the need for icebreaker assistance. The results show that the model achieves strong predictive performance and remains robust to the navigation mode imbalance inherent in winter navigation datasets. Compared with logistic regression, the NODE model improves accuracy by 10.7% and F1 score by 58.8%. However, despite its superior performance, the NODE model operates as a black box and does not provide explanations for its decisions, which limits its explainability and may hinder expert trust. Thus, developing a data-driven model that can both predict the need for icebreaker assistance well and provide the reasoning behind the decisions is desired.
To address this problem, this study extends the NODE model developed in Liu et al. (2025) to incorporate explainability while maintaining predictive performance. By integrating the SHAP (SHapley Additive exPlanations) method, both the model’s overall performance and the reasoning behind individual predictions can be analysed. A comprehensive dataset covering multiple winter seasons in the Baltic Sea is used to assess both the predictive and explanatory performance of the model. This study extends the existing decision-support model used for icebreaker assistance estimation by integrating an explanatory function, an aspect that remains largely unexplored in winter navigation research. This addresses a key limitation of self-explanatory models, which often struggle to balance predictive accuracy with explanation ability. The explainability is enabled through SHAP-based feature attributions, which provide quantitative insights into feature contributions to predictions and a basis for subsequent human-comprehensible interpretation, without imposing constraints on predictive model design.
The organization of this paper is as follows: Section 2 introduces the explainable decision-support model for estimating the need for icebreaker assistance. Section 3 describes the data sources and preparation. Section 4 presents and discusses the predictive and explanatory results, along with directions for future work. Finally, Section 5 concludes the paper.
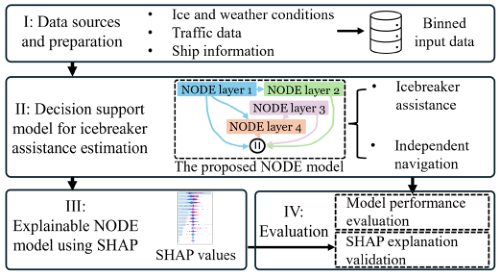
DECISION SUPPORT MODEL INTEGRATED WITH SHAP ALGORITHM This section details the data sources, data preparation, and analytical methods used in the study, with Figure 1 illustrating the overall methodological framework. The first step involves data collection from multiple data sources and subsequent preprocessing. As this study builds on Liu et al. (2025), the data sources remain unchanged. However, this paper aims to enable the explainability of the decision support model. Therefore, the data preparation step is modified relative to the previous work to support post-hoc explanation analysis.
After data preparation, the next step is to introduce the proposed decision support model. In our previous work, a NODE model was developed to automatically estimate when and where icebreaker assistance is needed (Liu et al., 2025). That study demonstrated the robustness of the NODE approach, showing superior performance over state-of-the-art predictive models in terms of accuracy, precision, recall, and F1 score. Building on these results, the current paper adopts the same model architecture and training procedure to retain comparable predictive performance. The methodological contribution of this paper lies in integrating the SHAP-based explainability with the trained NODE model. SHAP values quantify the contribution of each input feature to the model’s output, thereby providing an explanation of its predictions. Finally, both the model performance and the resulting SHAP explanations are evaluated separately.
Figure 1: Methodological framework.
DATA SOURCES AND PREPARATION This study draws on the same data sources as Liu et al. (2025), with only the input and output features summarised here for context. The dataset contains 11 input features, including thickness and concentration of level, ridged, and rafted ice, corresponding geographical locations, wind speed, ship length, ship type, and ship ice class. The output variable is the navigation mode, defined as either icebreaker assistance or independent navigation. Data from the Baltic Sea are used, covering January and February in 2011, 2018, and 2020, representing severe, typical, and mild winter conditions, respectively.
Explainable Decision Support for Icebreaker Assistance Estimation 583 The data preparation process also largely follows the procedure described in Liu et al. (2025), including data cleaning, selection, and labelling. However, an additional data preparation step is introduced to make the model explanations comparable to human judgments. Specifically, continuous features are grouped into expert-defined bins, with the exception of geographical variables, following common operational practices. This discretization represents environmental conditions in coarse ranges that better align with how domain experts assess and interpret real-world situations (Yang & Webb, 2005). For example, ice concentration is discretized into five bins based on the ranges defined in the ice chart, with thresholds at 0.1, 0.3, 0.6, and 0.9 (in tenths) (SMHI, 2023). Similarly, ice thickness is divided into five bins using threshold values of 0.1, 0.2, 0.3, 0.4, and 0.6 m. Wind conditions are discretized using the Beaufort scale, which relates wind speed to observable conditions at sea and on land (Delmar-Morgan, 1959). Vessel length is grouped into three classes (<100 m, 100–150 m, and >150 m) to reflect differences in manoeuvrability and operational scale (Oruc & Altan, 2023).
Data-Driven Model for Estimating Icebreaker Assistance The NODE model is adopted from Liu et al. (2025) to estimate the need for icebreaker assistance, keeping the architecture and training procedure unchanged. Detailed model specifications are not repeated here; only key elements are briefly outlined for context. The estimation of navigation modes is approached as a binary classification problem where the model predicts whether a merchant ship needs to be assisted by an icebreaker or not. It adopts a multi-layer architecture in which differentiable oblivious decision trees are ensembled within each layer. Thus, the model can effectively handle tabular data by combining the structural advantages of tree-based models with the strengths of deep neural networks, such as end-to-end gradient descent optimization and multi-layer representation learning.
SHAP Algorithm To interpret the predictions of the NODE model, SHAP is used. It is selected as a well-established post hoc explanation approach (Lundberg & Lee, 2017), capable of providing both local and global explanations. This enables a comprehensive understanding of individual predictions as well as overall model behaviour (Rathi, 2019).
In this study, an explanation is defined as a quantitative characterisation of how input features influence the model’s predictions, rather than as a directly human-interpretable rationale. SHAP values quantify how individual features increase or decrease the predicted probability of requiring icebreaker assistance relative to a baseline prediction. These feature-level attributions provide a foundation for subsequent human-comprehensible explanations through structured analysis of feature contributions and domain-specific interpretation. The SHAP Explainer is used to explain a model’s prediction by quantifying the contribution of each input feature to the model output.
Local explanations describe how individual features influence a specific prediction, enabling explainability at the instance level. Let ( ) f x denote the trained NODE model, where ( ) 2 , , , d X x x x = … represents the input feature vector with d features. For a given input sample x, SHAP approximates the model output as Eq. (1).
Equation reproduced from the original PDF.
Where ( ) 0 f X φ = [Equation or mathematical symbol available in the original paper PDF][Equation or mathematical symbol available in the original paper PDF][Equation or mathematical symbol available in the original paper PDF][Equation or mathematical symbol available in the original paper PDF][Equation or mathematical symbol available in the original paper PDF] . It serves as a reference point, from which the contributions of individual features are added to obtain the final prediction. Each SHAP value jφ quantifies how the feature j shifts the prediction away from this baseline. Positive values indicate an increase in the predicted probability, while negative values indicate a decrease.
Global explanations are obtained by aggregating local explanations across samples, thereby summarizing feature influence at the model level. It also serves as the basis for subsequent explanation verification via feature permutation, as described in the next section. Global importance for feature j is defined as the mean absolute SHAP value shown in Eq. (2).
[Equation or mathematical symbol available in the original paper PDF][Equation or mathematical symbol available in the original paper PDF] = [Equation or mathematical symbol available in the original paper PDF][Equation or mathematical symbol available in the original paper PDF] j j I φ [Equation or mathematical symbol available in the original paper PDF] (2) where the expectation is taken over all evaluation samples. This aggregation provides a model-level ranking of features according to their overall influence on the predictions.
Model Performance Evaluation The model performance was evaluated primarily in terms of predictive performance, using metrics including accuracy, precision, recall, and F1 score. The detailed description of the performance metrics can be found in Liu et al. (2025). Here, we do not repeat the full evaluation procedure but briefly summarise the process for context. To train and evaluate model performance, the dataset is divided into training, validation, and test sets. Specifically, 10% of the data is randomly selected as the test set to assess the model’s generalization ability, while the remaining 90% is used for model development. Within this subset, 5-fold cross-validation is applied, and performance metrics are averaged across folds to obtain robust estimates. One important point to note is that, while these metrics quantify prediction quality, they do not assess the quality or validity of the model’s explanations.
SHAP Explanation Verification This paper extends Liu et al. (2025) by enabling the model’s explainability using SHAP. To verify whether the features identified by SHAP influence the model’s prediction, we perform a feature-wise permutation analysis (Mi et al., 2021). Here, verification refers to a consistency check in which features identified by SHAP are permuted to examine whether this leads
Explainable Decision Support for Icebreaker Assistance Estimation 585 to measurable changes in model performance. Following the global SHAP feature ranking, selected features are independently permuted by randomly shuffling their values across samples, while all other features and the trained model are kept fixed. This breaks the relationship between the permuted feature and the target variable while preserving the feature’s overall distribution. The resulting changes in model performance metrics, including accuracy, precision, recall, and F1 score, are used to assess the influence of the permuted features, with larger performance degradation indicating stronger model dependence on the permuted feature. This analysis focuses on internal consistency; external validation of explanations against ground truth is beyond the scope of this study.
RESULTS AND DISCUSSIONS SHAP Explanation
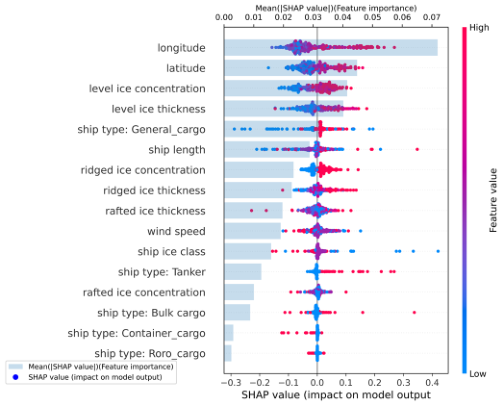
Figure 2 presents the SHAP global explanation and directional effects of the input features on the NODE model predictions. The horizontal bars represent global feature importance, summarising the average magnitude of each feature’s contribution, whereas the beeswarm plot illustrates how individual feature contributions are distributed across the dataset, including both the direction and variability of their effects on model predictions.
The SHAP analysis indicates that spatial features, represented by longitude and latitude, have a strong influence on the model’s predictions. This should not be interpreted as a causal relationship between geographic location and the need for icebreaker assistance. Rather, spatial features act as proxies for a range of persistent and context-dependent factors that are not explicitly modelled, such as typical traffic corridors, regional ice regimes, and established operational practices. While ice and environmental variables describe the instantaneous navigational conditions at a given location, spatial features capture broader contextual regularities across regions and routes. As a result, their contribution reflects predictive associations learned from historical data rather than direct causal effects.
Unlike spatial features, ice variables represent physical characteristics of ice-covered waters that directly affect ships’ manoeuvrability and operability, providing a mechanistically explainable basis for the model’s prediction (Musharraf et al., 2025). Level ice concentration and level ice thickness exhibit strong positive contributions, with higher values consistently shifting model predictions towards a higher probability of assistance. Ridged ice concentration and ridged ice thickness further contribute to this effect, though with slightly lower global importance. The SHAP value distributions indicate that extreme ice conditions, especially thick level ice and harsh ridging, substantially increase the likelihood of requiring icebreaker support. Rafted ice variables show more moderate effects, suggesting a secondary but still meaningful influence on decision-making.
Figure 2: SHAP global feature importance plot.
Ship-related variables exhibit secondary importance compared to spatial and ice-related factors. Ship length shows a modest positive contribution, with larger vessels generally associated with higher predicted probabilities of requiring icebreaker assistance. In contrast, ship ice class shows a consistent negative contribution, indicating that more ice-strengthened vessels reduce the predicted probability. Ship type, represented by categorical indicators such as general cargo, tanker, bulk cargo, container cargo, and Ro-Ro vessels, shows lower global importance overall. However, the SHAP distributions indicate that changes in ship type, particularly for general cargo vessels, can still meaningfully influence predictions under specific conditions.
Wind is a weather-related feature whose SHAP value distribution is relatively modest compared to the above features. This suggests that while wind may influence local ice dynamics and navigation conditions, its impact on the decision to require icebreaker assistance is less dominant than that of ice-related variables and spatial location within the study area.
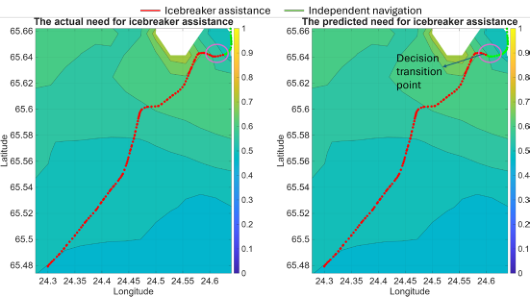
Figure 3: A ship trajectory case with navigation modes.
Explainable Decision Support for Icebreaker Assistance Estimation 587 SHAP local explanations are used to analyze feature contributions at specific decision cases. As shown in Figure 3, the trajectory contains a decision transition (marked by a circle), where the predicted decision changes from independent navigation to icebreaker assistance. Seven points are selected within a fixed spatial window centered at this transition point. These include three points before the transition, the transition point itself, and three points after the transition. The local explanation results are presented in Figure 4 in the following paragraph.
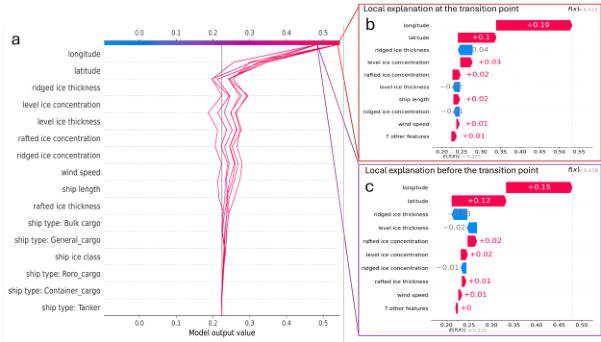
Figure 4 presents local SHAP explanations around a decision transition based on the selected seven cases. In Figure 4(a), each curve represents an individual sample, where feature contributions are accumulated from bottom to top, starting from the baseline ( ) f X [Equation or mathematical symbol available in the original paper PDF][Equation or mathematical symbol available in the original paper PDF][Equation or mathematical symbol available in the original paper PDF][Equation or mathematical symbol available in the original paper PDF][Equation or mathematical symbol available in the original paper PDF] toward the final prediction along the horizontal axis, which denotes the predicted probability of requiring icebreaker assistance. Figure 4(b-c) decomposes the model output immediately before and at the transition point, where the predicted probability increases from 0.479 to 0.533. This change is mainly associated with strengthened spatial contributions reflecting a shift in regional navigation context along the vessel’s trajectory. Ice-related features and wind also consistently show effects at the local level, although their importance ranking slightly differs from that shown in Figure 2. Such differences are expected, as global importance reflects average behaviour, whereas local explanations capture case specific feature interactions.
Figure 4: SHAP local explanations.
SHAP Explanation Verification Based on the performance evaluation metrics, the NODE model achieves strong training performance, with an accuracy of 95.6%, precision of 91.3%, recall of 90.2%, and an F1 score of 90.8%. Similar results on the validation and test sets indicate good generalization and robustness to unseen data. The SHAP-based explanation is verified based on the above performance.
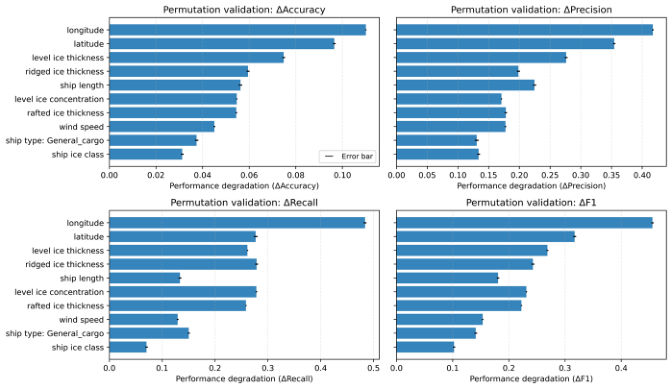
Figure 5 compares the SHAP-based global feature importance with the performance degradation observed under feature-wise permutation. The
bars in Figure 5 indicate the performance degradation resulting from feature- wise permutation, quantified using accuracy, precision, recall, and F1 score.
Figure 5. Permutation-based feature verification.
Ice-related variables, including level ice thickness, level ice concentration, and ridged ice thickness, consistently rank among the most influential features in both analyses, although their relative ordering varies across accuracy, precision, recall, and F1 score. These discrepancies arise because SHAP values represent average contributions to model predictions across all samples, whereas permutation verification measures the sensitivity of performance metrics to feature disruption. Consequently, features that contribute frequently but can be partially compensated by correlated variables may rank higher in SHAP, while features that are critical for maintaining predictive performance in extreme cases (e.g., extreme thick ridged ice) can induce larger performance degradation when permuted, leading to slight reordering in the verification results. In contrast, ship-related variables and wind speed show lower SHAP importance and smaller performance degradation, indicating a secondary influence on the model predictions.
Overall, the permutation analysis verifies that SHAP reliably captures the key features driving the NODE model’s decisions, with only minor differences in relative ranking among features of comparable importance when assessed using performance-based metrics.
Future Work
While SHAP provides both global and local feature importance, the resulting rankings are not necessarily identical, reflecting the distinction between average model behaviour and case-specific decision reasons. Both the global rankings (Figure 2) and the local explanations around decision transitions (Figure 4) show that spatial features and ice-related variables jointly contribute to the model output, with their relative importance varying across contexts.
Explainable Decision Support for Icebreaker Assistance Estimation 589 Spatial features primarily encode contextual and regional information related to navigational conditions, whereas ice-related variables represent physical conditions that directly influence navigation modes. Together, these findings suggest that feature interactions play a critical role in navigation mode prediction. Future work can focus on interaction-aware explainability methods to capture coupled effects among a subset of key features.
Furthermore, human-comprehensible natural language explanations can be developed by converting feature attributions into clear linguistic descriptions that align with human reasoning. Recent studies show that SHAP values can be translated into understandable natural-language statements using rule-based or hybrid approaches, such as fuzzy linguistic IF-THEN rules, to explain how different features influence model decisions (Khalyasmaa et al., 2025). In addition to this, large language model (LLM) based approaches have been shown to convert SHAP explanations into coherent text summaries that highlight the most important contributing factors while maintaining explanation accuracy (Khediri et al., 2024). These methods allow numerical feature contributions to be expressed as short, context-aware verbal explanations, which can improve transparency and user trust in complex decision-support systems. Future work may investigate how these natural- language explanation methods can be adapted to winter navigation, ensuring that the explanations remain clear, operationally relevant, and consistent with the terminology used by icebreaker captains and traffic coordinators.
CONCLUSION
This study integrates SHAP with the NODE model to enable the explainability of data-driven predictions for icebreaker assistance. Compared with previous work, the proposed approach extends model capability by incorporating explainability while maintaining strong predictive performance. Global feature importance offers average insights into how overall estimations are formed, whereas local explanations reveal the underlying reasons for individual predictions in specific scenarios. Differences in feature rankings between global and local explanations are expected and indicate context- dependent decision reasons, suggesting the need for further investigation of coupled effects among a subset of key features. Feature permutation verification confirms that spatial and ice-related variables have significant contributions to decision-making, while ship characteristics and wind features play secondary roles. The quantitative SHAP values derived in this study provide a foundation for developing intuitive and human-comprehensible explanations to support operational decision-making in the future.
ACKNOWLEDGMENT
The work was supported by the Research Council of Finland: Towards human-centred intelligent ships for winter navigation (Decision number: 351491), Marine waterways as a sustainable source of wellbeing, security, and safety (Decision number 365647), and Merenkulun Säätiö (Application number: 20260027).
REFERENCES
Delmar-Morgan, E. L. (1959). The beaufort scale. The Journal of Navigation, 12(1), 100–102. https://www.cambridge.org/core/journals/journal-of-navigation/article/ beaufort-scale/35AA34D1C0DECD00508FC64103242585 Khalyasmaa, A. I., Matrenin, P. V., & Eroshenko, S. A. (2025). Interpretable
Diagnostics with SHAP-Rule: Fuzzy Linguistic Explanations from SHAP Values. Mathematics, 13(20). Khediri, A., Slimi, H., Yahiaoui, A., Derdour, M., Bendjenna, H., & Ghenai, C. E.
(2024). Enhancing machine learning model interpretability in intrusion detection systems through shap explanations and llm-generated descriptions. In 2024 6th International Conference on Pattern Analysis and Intelligent Systems (PAIS). IEEE, 1–6. https://ieeexplore.ieee.org/abstract/document/10541168/ Liu, C., Kulkarni, K., Suominen, M., Kujala, P., & Musharraf, M. (2024). On the data-driven investigation of factors affecting the need for icebreaker assistance in ice-covered waters. Cold Regions Science and Technology, 221(104173). Liu, C., Suominen, M., & Musharraf, M. (2025). An ensemble machine learning
model for predicting the need for icebreaker assistance in ice-covered waters. Engineering Applications of Artificial Intelligence, 158(111489). Lundberg, S. M., & Lee, S. I. (2017). A unified approach to interpreting model predictions. Advances in Neural Information Processing Systems, 30. Marcílio, W. E., & Eler, D. M. (2020). From explanations to feature selection:
Assessing SHAP values as feature selection mechanism. In 33rd SIBGRAPI Conference on Graphics, Patterns and Images (SIBGRAPI). Meier, H., Kniebusch, M., Dieterich, C., Gröger, M., Zorita, E., Elmgren, R., & Zhang, W. (2022). Climate change in the Baltic Sea region: A summary. Earth System Dynamics, 13(1), 457–593. Mi, X., Zou, B., Zou, F., & Hu, J. (2021). Permutation-based identification of
important biomarkers for complex diseases via machine learning models. Nature Communications, 12(1). Musharraf, M., Liu, C., & Smith, J. (2025). Understanding Crew Estimations for Icebreaker Assistance in Ice-Covered Waters. AHFE. Oruc, M. F., & Altan, Y. C. (2023). Risky Maritime Encounter Patterns via Clustering.
Journal of Marine Science and Engineering, 11(5), 950. Rathi, S. (2019). Generating Counterfactual and Contrastive Explanations using SHAP. ArXiv Preprint ArXiv:1906.09293. SMHI. (2023). Ice chart. Swedish Meteorological and Hydrological Institute. Yang, Y., & Webb, G. I. (2005). Discretization for Data Mining. In https://services.
igi-global.com/resolvedoi/resolve.aspx?doi=10.4018/978-1-59140-557-3.ch075. In Encyclopedia of Data Warehousing and Mining (pp. 392–396). IGI Global Scientific Publishing.
LISTED IN THE AHFE DIGITAL BOOKSTORE CATALOGUE
Explore the complete digital volume
Advances in Human Factors of Transportation
Read this individual research paper free through the original publisher, or explore the full digital proceedings book.
ISBN 979-8-950676-00-0
Explore this ISBN in the AHFE Bookstore ↗Listed in the July 2026 bookstore catalogue; search by ISBN to confirm current availability · Digital book purchase optional