Mashrura Musharraf, Cong Liu (2024). The human element in data driven decision making for winter navigation. In: Advances in Human Factors of Transportation. AHFE Open Access, vol. 148, pp. 687–696. https://doi.org/10.54941/ahfe1005261
With the availability of big maritime data and advancements of the computational techniques, such as machine learning and AI, automation of navigational decision-making in ships is on the rise. For low risk and more frequently observed cases, such as local vessels operating in calm sea, abundant data facilitates straightforward automation. The traditional data driven modeling (including black-box models) and associated validation techniques suffice the automation process of these cases as human intervention is rarely needed. However, for high-risk and infrequent scenarios, like winter navigation, data may be scarce, sparse, or imbalanced. Black-box data-driven models and associated validation techniques prove insufficient in these cases, as the expectation is for human to jump in and take control over when needed. This paper explores the role of the human element in various stages of data driven decision-making for winter navigation, encompassing the establishment of a multipurpose winter navigation database, model development, and validation. To illustrate, a case study on ice-breaker assistance operations will be presented.
With the successful demonstration of world’s first fully autonomous ferry in 2018, it is anticipated that ship intelligence will continue to reshape the maritime industry in the coming years. Big maritime data and the advanced data-driven techniques play a major role in shaping that ship intelligence. Together they aim to automate some of the major decision makings such as the navigational decisions made on board.
Automating navigational decisions is straightforward for cases that hap- pen quite frequently and are relatively low risk. For example, the abundance of data for local vessels operating in the calm sea allows training the tradi- tional data driven models (including black-box models) well enough for the vessel to navigate somewhat autonomously in similar situations. Since the data also allows for exhaustive testing of the model, the safe envelope for operation is also quite well known in these cases.
However, for high-risk and infrequent scenarios, like winter navigation, data may be scarce, sparse, and/or imbalanced. Winter navigation is com- plex in nature and often takes place under challenging circumstances that include harsh weather, time constraints, and multiple information sources.
The conditions are dynamic, and it is difficult to predict precisely how the circumstances will evolve. Navigating the ship effectively and safely under such conditions involves identifying important features, recognizing famil- iarity of current situation with some previously encountered situations, and taking into consideration the rules and regulations. Nevertheless, attempts have been made to put together big maritime data for winter navigation in comprehensive databases (Lensu & Goerlandt, 2019). And with the availabil- ity of such data, development and use of data-driven models have attracted significant attention in recent time (Montewka et al., 2019). However, it is understood that both the training and testing of these data-driven models are limited and it is anticipated that human intervention and manual control in critical winter navigation scenarios will still be frequent at least in the near future.
This paper takes a critical look at the various stages of data-driven decision-making for winter navigation (encompassing the establishment of a multipurpose winter navigation database, model development, and valida- tion) and identifies the associated human elements. The human elements here are discussed from two viewpoints – 1) if and how human is involved in the different stages and provides input for it and 2) what should be done at dif- ferent stages so that the end results are understandable, relevant and useful for the human. The major contributions of the paper include 1) verifying if the data-driven models used in the context of winter navigation are purely as objective as they claim to be or do they have subjective element to it and 2) providing suggestions on how to combine the human element (if they are truly prominent in the different stages of data-driven decision making) with the technological element to make the data-driven decision making stronger for winter navigation.
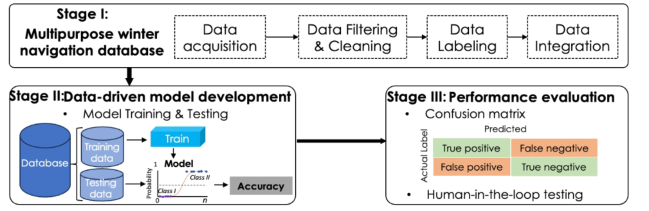
WINTER NAVIGATION: DATA-DRIVEN DECISION MAKING & THE HUMAN ELEMENT This section provides an overview of data-driven decision-making and dis- cusses the human element associated with the different stages of it. Figure 1 presents a schematic diagram of data-driven decision-making. As shown in the figure, there are 3 main stages. The following subsections discuss them in detail.
Figure 1: Schematic diagram of data-driven decision-making in winter navigation.
The Human Element in Data Driven Decision Making for Winter Navigation 689
Establishing Multipurpose Winter Navigation Database The purpose of this stage is to collect and integrate the different data types to create a comprehensive winter navigation database. While most winter navigation decision making involves the usage of some common data such as traffic information, environmental conditions, and ship specifications, data need might vary depending on the particular navigation task at hand. For example, data needed for route optimization in ice-covered water can be very different than data needed for icebreaker assistance identification (Liu et al., 2022; Tran et al., 2023). Understanding the appropriate data requirement essentially necessitates the understanding of the underlying task and identify- ing the salient features and on-the-job adjustments (Musharraf et al., 2022). By providing a transparent picture of the decision-making process, subject matter experts (SMEs), such as experienced seafarers, can significantly con- tribute to meaningful data acquisition and digitalization needed to establish a multipurpose winter navigation database.
After data acquisition from appropriate sources, data filtering and cleaning need to be done to ensure data consistency and compatibility. While there are data-driven techniques such as the interquartile range (IQR) which can automatically detect some of the outliers, there are outliers that can only be detected under the guidance of SMEs who know the practicality of the operating conditions and are aware of the traffic restrictions, regulations, and navigation practices for winter. For example, knowing the minimum ship ice class, minimum ship deadweight, and ship type for certain ice conditions will allow the detection of anomalies in the traffic data and/or the ice data (Banda et al., 2016). Data-driven techniques informed by such practical knowledge would have superior performance in detecting the outliers.
Another important step in pre-processing the data is to label them so that they can be used later for data-driven models such as supervised machine learning. There are two ways to label the research data, manual and auto- matic labelling. Automatic labelling is preferred to manual labelling when the amount of data is large and time-consuming. For example, Liu et al. (2022) uses a multistep clustering method to label different navigation modes during winter navigation (i.e., independent navigation versus icebreaker assistance). However, a standard benchmark to assess the efficacy of these automatic labelling methods is almost non-existent. Hence validation of these methods is often human dependent at the end. For example, Liu et al. (2022) compares the automatic labelling of icebreaker assistance with the manual records put by the icebreaker captains in the IBNET (an operational management sys- tem of winter navigation). This is illustrated in more detail in the case study section.
Once appropriate data is collected, cleaned, filtered and labelled, the final step is to integrate them to a comprehensive winter navigation database. It has to be kept in mind that the data from different sources are of different types and can come at a different rate. For example, traffic data such as the AIS data are from terrestrial stations and typically amounts to billions of messages whereas the ice data come from ice charts and ice forecasting
690 Musharraf and Liu
models and have much lower sampling rate. A careful mapping of the spa- tial and temporal data is also essential for a meaningful integration. Again, while this type of mapping can be done quite automatically be implementing certain algorithms, validation of the outcomes often depends on the expert judgement (e.g., is that kind of traffic realistic for that kind of ice condition).
Data-Driven Model Development Depending on the gathered data, different types of models, such as tra- ditional models (e.g., semi-empirical model, theoretical model, simulation model) or data-driven models, can be developed to support winter naviga- tion decision-making (Lu et al., 2021). Data-driven models have attracted significant attention in recent time as unlike traditional models they possess the capability to capture and comprehend information about complex oper- ational scenarios by learning patterns from large amount of data and usually have superior performance (Montewka et al., 2019). Data-driven models have been developed for different research contexts in winter navigation, including ship performance investigation, navigation patterns identification and analysis, and risk assessment in ice.
The purpose of this section is not to present an exhaustive list of the dif- ferent data-driven models developed in the context of winter navigation. The purpose is rather to provide a few examples and discuss the human element in the model development and validation process.
Some of the data-driven models are developed under direct guidance of the SMEs. An example is the commonly used Bayesian network to evaluate the navigation risk for winter navigation (Li et al., 2017). Here, expert knowl- edge plays a crucial role in building the network of risk events and defining the conditional probability for specific nodes in the network. While this intro- duces subjectivity to the network and the outcomes, it also allows the model to be relatively more transparent and understandable compared to the other black box models such as neural networks.
Then, there are data-driven models that do not necessarily involve the SMEs in the model development process, but they can present results that can be easily interpreted and explained in human terms. For example, Montewka et al. (2015) uses the Naïve Bayes model to predict the likelihood of a ship besetting in ice. Besides a high prediction accuracy, the use of Naïve Bayes enables understanding of the reasoning behind the prediction.
Some examples of more complex and somewhat black box models include the ensemble models, artificial neural network (ANN) model, and convolu- tional neural network (CNN). Kim et al. (2020) and Sun et al. (2022) made attempts to predict ice resistance for ice-going vessels using such black box models. Ansari et al. (2021) employed a CNN-based model to detect ice using ice images. Works such as Raoet al. (2021) applies a range of ensemble models to solve the same problem (i.e., random forest (RF), XGBoost, and LightGBM, to predict ship speed in ice-covered waters) and then chooses the model that provides the best performance.
While the choice of data-driven models for different winter naviga- tion applications is dominated by the performance measured in prediction
The Human Element in Data Driven Decision Making for Winter Navigation 691
accuracy, it has to be kept in mind that the ultimate goal of these models is to assist humans in making decisions that facilitate smooth, safe, and efficient winter navigation. Therefore, a conscious choice must be made between using models that are interpretable and using models that are black boxes. The following subsection discusses the performance evaluation of the different models. Even when the use of black box models is unavoidable, techniques such as Shapley Additive explanations (SHAP), and the local interpretable model-agnostic explanations (LIME) can be used to enhance interpretability by visualizing feature interactions and computing the importance values for all features.
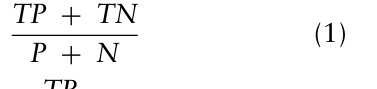
Performance Evaluation With the abundance of data-driven models such as machine learning (ML) algorithms, it is difficult to choose one that best fits the purpose at hand. Having a clear list of the different performance criteria and developing a performance matrix that aligns with the purpose of the ML application is essential for it to be useful. For supervised ML algorithms, prediction accu- racy, precision and recall have been the primary performance criteria in most literature (Sokolova & Lapalme, 2009). These are often calculated using a confusion matrix. The confusion matrix is a table that visualizes the per- formance of a classifier (Fawcett, 2006). As shown in Table 1, the matrix presents how well the classifier can distinguish the different classes. Equations (1)–(4) show how accuracy, precision, recall, and F1-score can be calcu- lated based on the confusion matrix. The higher the values, the better the performance of the classifier.
Actual assistance operation (P) True positive (TP) False negative (FN) Actual independent operation (N) False positive (FP) True negative (TN) Note: P presents positive (Assistance operation); N presents negative (Independent operation).
Accuracy = TP + TN TP + TN + FN + FP = TP + TN
Equation reproduced from the original PDF.
Recall = TP TP + FN = TP Total actual assistance operation (3) F1 −score = 2 ∗Precision ∗Recall Precision + Recall (4)
Besides these most commonly used criteria, the other criteria occasionally used include – the size of the training data and number of features, speed
692 Musharraf and Liu
or training time, linearity, and scalability. However, as discussed in the pre- vious section, given that most of the ML applications in winter navigation is intended to be used by humans at the end (for example in building an intelligent decision support system for seafarers), the traditional performance matrix needs to be extended to include criteria such as explainability, trans- parency, and trustworthiness of the ML models. It is also evident that even with such an extended matrix, there will be further challenges, such as how to effectively measure those criteria, and tackling those challenges will involve human participation (e.g., measuring trust using a validated questionnaire during simulation) (Houweling et al., 2024).
CASE STUDY: ICEBREAKER ASSISTANCE OPERATION This section takes the icebreaker assistance operation in the Baltic Sea as a case study and discusses the human elements in data-driven prediction of icebreaker needs in the Baltic Sea during for a winter period (January 15 to February 15, 2018). The Finnish Swedish winter navigation system is in charge of ship operations in ice-covered waters in the Baltic Sea. Relying on ice services, weather information, and traffic restrictions, icebreaker assis- tance may be needed for merchant vessels traveling to a certain port. To keep ships from getting beset in ice, captains from icebreakers or merchant ves- sels estimate whether assistance service would be needed. There are multiple factors that need to be considered such as ice factors (e.g., ice type, ice con- centration, ice thickness, the movement of ice), ship specifications (e.g., ice class, deadweight), and weather information (e.g., wind speed). Once the IB assistance is confirmed to be needed, icebreaker captains will make decisions on the order in which assistance will be provided to the vessels in need.
The following subsections discusses the database development, model development, and performance evaluation for the icebreaker assistance pre- diction and points out the human element involved in these steps. For this case study, SMEs refer to 4 academics with 10+ years of experience in dif- ferent aspects of winter navigation research and 3 practitioners all of whom were certified nautical officers and had experience of winter navigation in the Baltic Sea and Finnish-Swedish winter navigation system.
Expert Knowledge to Complement the Database The data used for the icebreaker assistance prediction was collected from 3 main sources – Automatic Identification System (AIS), Helsinki Multi- category sea-ice model (HELMI), and IBNet. A clear data requirement for the purpose of assistance prediction was not directly available. Liu et al. (2023) conducted a systematic literature review to make a comprehensive list of fac- tors that can affect the icebreaker assistance. Comparing the list with what was available through the 3 different data sources, some gaps were identi- fied. For example, ship factors such as ship hull information, ice factors such as brash ice and ice floe size, and weather factors such as current and wave were missing in the data sources. SMEs were involved at this point to discuss the feasibility of a data-driven decision-making. It was discussed that some gaps in the data, like considering the sea surface temperature constant for the
The Human Element in Data Driven Decision Making for Winter Navigation 693
study period, would not significantly misguide the findings. However, there were missing data, such as ship hull details, that are expected to have a non- negligible effect on the need for icebreaker assistance, and it was suggested that the limitation the missing data poses on the performance of the data- driven model must be kept into consideration. The discussions also included understanding the possible correlation between the features and investigating if data on one factor can complement the missing data on another. For exam- ple, it was discussed that ice speed exhibits a strong correlation with wind speed and ice compression is primarily driven by the combined forces of wind and ice ridges (Pärn et al., 2007). Thus, the inclusion of the wind speed par- tially mediates the issue of not having direct data on ice compression and dynamic ice.
SMEs were involved in the data filtering and cleaning procedure by pro- viding relevant information on traffic restrictions and navigation practices. The Finnish-Swedish Winter Navigation System proposes traffic restrictions in the Baltic Sea to constrain the vessels. Given that there is a minimum dead- weight and ice class requirement for vessels to qualify for assistance in certain ice conditions (FSICR, 2021; SMHI, 2023), only merchant vessels larger than 1300 DWT and ice class higher than II were considered for the study period. As briefly mentioned in the previous section, to automatically label the dif- ferent navigation modes, the multistep clustering method was used. However, to validate the outcomes, the automatic labels were compared to the records manually put into the IBNet system. In the IBNet system, the name of the serving icebreaker, the starting and ending time of the assistance, the depar- ture and arrival port, and the assistance duration are manually recorded by crews on board of the icebreaker. These manual records are treated as the true labels to assess the efficacy of the automatic labeling. The result showed that the automatic labeling worked with 99.6% accuracy.
The data integration at the end was done fully automatically in this case study and human involvement was not necessary.
Need for Model Explainability and Transparency for Trustworthiness Once the database development was completed, a data-driven model, binary logistic regression, was used for icebreaker assistance prediction. In binary logistic regression, the need for icebreaker assistance is modelled as a func- tion of the various factors (e.g., ship factors, ice factors) available in the database, and the outcome is presented in the form of a regression equa- tion. The equation elucidates what features have a significant effect on the icebreaker assistance need, whether the effect is positive or negative, and provides a measure of the significance of the factors by their correspond- ing coefficients. The analysis indicates that ridge ice concentration has the most significant impact on the need for icebreaker assistance, with a positive coefficient of 1.017. The higher the ridge ice concentration, the higher the probability of the need for icebreaker assistance. The model prediction per- formance was evaluated by Eqs (1)–(4), achieving 80.8% accuracy, 81.0% precision, 80.8% recall, and 80.7% F1-score. However, SMEs were also involved in interpreting and verifying the results ensuring that the findings
694 Musharraf and Liu
of the data-driven model were well aligned with expert empirical knowl- edge. To improve the model prediction performance, different ML models can be employed in the next research phase, such as decision tree classifier, K-Nearest Neighbors model, and ensemble models.
Performance Evaluation Through Human-in-the-Loop Testing As discussed in the previous performance evaluation section, the traditional performance matrix should be extended to include performance criteria such as explainability, transparency, and trustworthiness. A clear picture of how these criteria will be measured is still at the developing stage for the case study, but the plan includes performing a human-in-the-loop experiment using a simulated winter navigation environment (Kulkarni et al., 2022). The data- driven models for the icebreaker assistance prediction will be integrated into a few virtual ships in the simulation. As these ships navigate and make deci- sions, they will be communicated to the SMEs participating in the experiment. Due to the explainability and interpretability, the SMEs can review both the decision outcome and the logic behind it. The SME can then provide feed- back regarding 1) if /how the decisions made are similar or different than their own 2) if/how the logics behind them are similar or different than their own and 3) how the system ranks in critical decision-making in their opinion.
DISCUSSIONS AND CONCLUSION As aimed the paper took a critical look at the data-driven decision making for winter navigation. It was revealed that there was a human element present in all the different stages, such as multipurpose winter navigation database development, model development, and validation. From data acquisition to data integration, human element is critical at every step to either fill in the gaps in the data itself or to guide the process. At model development and validation stages, consideration of human element is also found to be critical to ensure we don’t only build models that are accurate but also ensure that they are understandable, trustworthy, and useful at the end. Understanding the role of human element in data-driven decision-making for winter navi- gation reveals that these models are not as completely free of subjectivity as they claim to be. It also shows that for superior ship intelligence we need to combine both the technological and the human element, at least until winter navigation data increase in large amounts and uncertainties get much lower.
ACKNOWLEDGMENT
This work was supported by the Academy of Finland: Towards human- centered intelligent ships for winter navigation (Decision number: 351491). The authors also thank Finnish Meteorological Institute and the Finnish Transport Infrastructure Agency for providing advice, data, and expert knowledge supporting the interpretation of the result.
The Human Element in Data Driven Decision Making for Winter Navigation 695
REFERENCES
Alabi, R. O., Elmusrati, M., Leivo, I., Almangush, A., & Mäkitie, A. A. (2023).
Machine learning explainability in nasopharyngeal cancer survival using LIME and SHAP. Scientific Reports, 13(1). Ansari, S., Rennie, C. D., Clark, S. P., & Seidou, O. (2021). IceMaskNet: River ice detection and characterization using deep learning algorithms applied to aerial photography. Cold Regions Science and Technology, 189, 103324. https://doi.or g/10.1016/j.coldregions.2021.103324 Fawcett, T. (2006). An introduction to ROC analysis. Pattern Recognition Letters,
27(8), 861–874. FSICR. (2021). Ice Class Regulations and the Application Thereof. Finnish Transport and Communications Agency, 1, 1–65. Houweling, K. P., Mallam, S. C., van de Merwe, K., & Nordby, K. (2024). The
effects of Augmented Reality on operator Situation Awareness and Head-Down Time. Applied Ergonomics, 116, 104213. Kim, J. H., Kim, Y., & Lu, W. (2020). Prediction of ice resistance for ice-going ships in level ice using artificial neural network technique. Ocean Engineering, 217. Kulkarni, K., Kujala, P., Musharraf, M., & Rainio, I. (2022). Simulation Tool for
Winter Navigation Decision Support in the Baltic Sea. Applied Sciences, 12(15), 7568. Lensu, M., & Goerlandt, F. (2019). Big maritime data for the Baltic Sea with a focus on the winter navigation system. Marine Policy, 104, 53–65. Li, F., Montewka, J., Goerlandt, F., & Kujala, P. (2017). A probabilistic model of ship
performance in ice based on full-scale data. 2017 4th International Conference on Transportation Information and Safety, ICTIS 2017 - Proceedings, 752–758. https://doi.org/10.1109/ICTIS.2017.8047852 Linardatos, P., Papastefanopoulos, V., & Kotsiantis, S. (2021). Explainable ai: A review of machine learning interpretability methods. In Entropy (Vol. 23, Issue 1, pp. 1–45). MDPI AG. Liu, C., Kulkarni, K., Musharraf, M., & Kujala, P. (2023). Factor analysis of ice-
breaker assistance operation for ice-going ships in the Baltic Sea. International Conference on Port and Ocean Engineering under Arctic Conditions (POAC). Liu, C., Musharraf, M., Li, F., & Kujala, P. (2022). A data mining method for automatic identification and analysis of icebreaker assistance operation in ice-covered waters. Ocean Engineering, 266(P2), 112914. Lu, L., Kujala, P., & Goerlandt, F. (2021). A method for assessing ship oper-
ability in dynamic ice for independent navigation and escort operations. Ocean Engineering, 225, 108830. Montewka, J., Goerlandt, F., Kujala, P., & Lensu, M. (2015). Towards probabilistic models for the prediction of a ship performance in dynamic ice. Cold Regions Science and Technology, 112, 14–28. Montewka, J., Goerlandt, F., Lensu, M., Kuuliala, L., & Guinness, R. (2019). Toward
a hybrid model of ship performance in ice suitable for route planning purpose. Proceedings of the Institution of Mechanical Engineers, Part O: Journal of Risk and Reliability, 233(1), 18–34. Musharraf, M., Smith, D., Smith, J., & Veitch, B. (2022). Knowledge Elicitation and Digitization Using Fram to Inform Automation. Proceedings of the ASME 2022 41st International Conference on Ocean, Offshore and Arctic Engineering, 1–9. Pärn, O., Haapala, J., Kõuts, T., Elken, J., & Riska, K. (2007). On the relationship
between sea ice deformation and ship damages in the Gulf of Finland in winter 2003. Proc. Estonian Acad. Sci. Eng, 13, 201–214. https://polarview.fimr.fi
696 Musharraf and Liu
Rao, P. S., Kim, E., Smestad, B. B., Asbjørnslett, B. E., & Bhattacharyya, A. (2021).
Predicting vessel speed in the Arctic without knowing ice conditions using AIS data and decision trees. Maritime Transport Research, 2, 100024. SMHI. (2023). Ice chart. Swedish Meteorological and Hydrological Institute. Sokolova, M., & Lapalme, G. (2009). A systematic analysis of performance measures for classification tasks. Information Processing & Management, 45(4), 427–437. https://www.sciencedirect.com/science/article/pii/S0306457309000259 Sun, Q., Zhang, M., Zhou, L., Garme, K., & Burman, M. (2022). A machine learning-based method for prediction of ship per- formance in ice: Part I. ice resistance. Marine Structures, 83. https://doi.org/10.1016/J. MARSTRUC.2022.103181 Tran, T. T., Browne, T., Musharraf, M., & Veitch, B. (2023). Pathfinding and
optimization for vessels in ice: A literature review. Cold Regions Science and Technology, 211, 103876. Valdez Banda, O. A., Goerlandt, F., Kuzmin, V., Kujala, P., & Montewka, J. (2016).
Risk management model of winter navigation operations. Marine Pollution Bulletin, 108(1–2), 242–262.
LISTED IN THE AHFE DIGITAL BOOKSTORE CATALOGUE
Explore the complete digital volume
Advances in Human Factors of Transportation
Read this individual research paper free through the original publisher, or explore the full digital proceedings book.
ISBN 978-1-964867-24-3
Explore this ISBN in the AHFE Bookstore ↗Listed in the July 2026 bookstore catalogue; search by ISBN to confirm current availability · Digital book purchase optional