Dr Özerk Yavuz (2026). Machine Learning and Data Mining Insights into Monthly Housing Price Dynamics in Connecticut, USA. In: Human Factors, Business Management and Society. AHFE Open Access, vol. 215, pp. 35–42. https://doi.org/10.54941/ahfe1007583
In today’s market place housing and housing associated goods and services constitutes important value for consumers. As indicated in the Maslow’s hierarcy of needs figure, sheltering, housing is one of the most basic needs of human beings. Later wants and demands take place, individuals engage in behaviours to afford their housing needs by either renting, buying a house or buying hotel, motel or other housing services. If demand of the consumers meet the available housing options and recently constructed housing projects, rent and selling prices of the housing options may be in a balance meaning a significant increase and decrease in the prices are unlikely to occur. If the demand passes the supply it would be on the spot to wait for increases in the housing market, whereas a lower demand in a normal supply scenario is likely to lower the prices in the marketplace for consumers. In this research average housing prices according to location considering date have been ananlysed using machine learning techniques available in data mining and computer science literature.
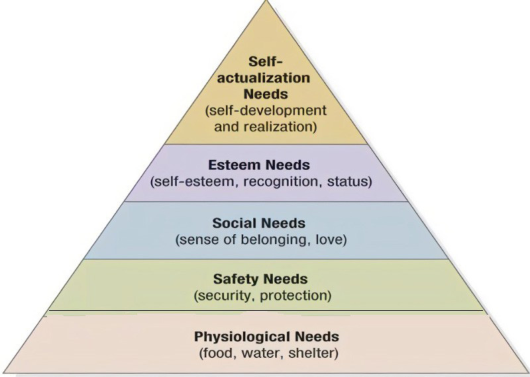
In today’s marketplace housing and housing associated goods and services constitute important value for consumers. As shown in Figure 1, needs can be categorized under physiological needs, safety needs, social needs, esteem needs and self-actualization needs hierarchically according to Maslow. As indicated in the Maslow’s hierarchy of needs figure, sheltering, housing is one of the most basic needs of human beings. Later wants and demands take place, individuals engage in behaviors to afford their housing needs by either renting, buying a house or buying hotel, motel or other housing services (Kotler, 2012; Bögenhold, 2009; Wikipedia, 2025; McLeod, 2007).
Here the basic need that humans want to satisfy shown in the lowest level in the hierarchy of needs of Maslow is the housing or sheltering need. Consumers can satisfy this need with the wants that are available in the marketplace by simply demanding to a property. Since the world population grows, demand for goods and services associated with housing also increase (Kotler, 2012; Bögenhold, 2009; Wikipedia, 2025; McLeod, 2007).
Figure 1: Maslow’s hierarchy of needs (Marketing management, Kotler and Keller, 2006).
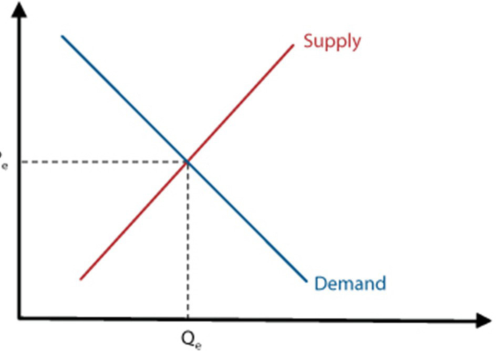
If demand of the consumers meet the available housing options and recently constructed housing projects, rent and selling prices of the housing options may be in a balance meaning a significant increase and decrease in the prices are unlikely to occur. If the demand passes the supply, it would be on the spot to wait for increases in the housing market, whereas a lower demand in a normal supply scenario is likely to lower the prices in the marketplace for consumers. There are also some factors associated with demand for goods and services of housing such as population growth, birth/death ratio, immigration, income, job security, savings, position of the consumer in the life cycle, payment options, credit options and availability as in mortgage (Kotler, 2012; Bögenhold, 2009).
Figure 2: Relationship between demand, supply and price. Economics 2nd ed., revised ed., Andover: Cengage learning, 2011).
As indicated in Forbes’ “Connecticut Housing Market 2024: Trends & House Prices” article, Connecticut, which can be considered as an attractive place for New Yorkers, is known to be a state with low inventory levels with
Machine Learning and Data Mining Insights into Monthly Housing Price 37 high pricing in the marketplace. According to the review, The Hartford West Hartford East Hartford metro area was rated the third most attractive, while the New Haven Milford metro area ranked fifth attractive in the marketplace. Despite the fact that its low supply and high price levels, it is still possible to find options lower than the national average (Kotler, 2012; Bögenhold, 2009; McLeod, 2007/2021; Perkis, 2021; Mankiw & Taylor, 2011; Forbes Advisor, n.d.; Wikipedia, n.d.)
In this research average housing prices according to location considering date have been analyzed using machine learning techniques available in data mining and computer science literature.
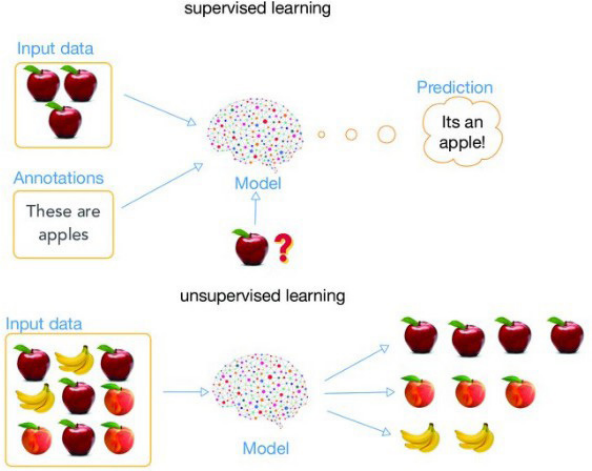
RESEARCH PROCESS In the research process, a structured data mining approach by applying supervised and unsupervised machine learning methodologies used. For the data being analyzed, public, secondary data sources available in www. data.gov web site has been used. Data preparation, analysis and prediction steps have been followed in the process. For the analysis both supervised and unsupervised machine learning algorithms have been applied for the prediction of results. In data mining, supervised machine learning is based on the efforts that require pre training of the model with some percentage of the data set whereas in unsupervised learning this is not a necessity. Algorithms calculate the metrics that are used to formulate and form the cluster without the need of a pre-training with a labelling fashion (Alloghani et al., 2020; Sharma et al., 2022; Yan et al., 2018; Wikipedia, n.d.).
Figure 3: Comparison of Supervised and Unsupervised Machine Learning. Background Augmentation Generative Adversarial Networks (BAGANs): Effective Data Generation Based on GAN-Augmented 3D Synthesizing, Symmetry ((Yan, Ma; Liu, Kang; Guan, Zhibin; Xu, Xinkai; Xu, Qian; Bao, Hong, 2018, 2018).
38 Yavuz In Weka data mining package tool which provides the collection of classification and clustering algorithms that can be used JRip, OneR, Part, ZeroR, J48, Random Forest are some of the classification approaches that can be used in supervised machine learning on the other hand Simple K-Means, Make Density Based Clusterer, Hierarchical Clusterer, Canopy, Farthest First can be counted as some of the clustering algorithms that can be used with the aim of applying unsupervised machine learning (Alloghani et al., 2020; Sharma et al., 2022; Yan et al., 2018; Wikipedia, n.d.).
List of the attributes that have been used in both supervised and unsupervised machine learning is as follows.
Table 1: List of attributes.
Table available in the original PDF paper.
Name of Variable Variable Type Date Nominal
Median Sale Price Numeric Average Sale Price Numeric
County Nominal
FINDINGS In the analysis part of the data set, public secondary data source retrieved from www.data.gov web site imported in Weka data mining package and later both supervised and unsupervised machine learning algorithms have been applied. Later the findings have been assessed in terms of performance metrics provided by the algorithm and the rules generated and discovered. In the application of the algorithms, 34% of the data has been used in the pre-training of the model in supervised machine learning algorithms whereas remaining 66% has been used for model testing. In the analysis, Multilayer perceptron, as shown in table 2 has been the top scorer with its correct classification rate and RMSE.
Table 2: Performance indicators and their assessment.
Random Forest 0.32 0.33 33.29 66.70 Hoeffding Tree 0.28 0.31 35.32 64.67 Multilayer Perceptron 0.27 0.36 36.59 63.40
Decision Table 0.27 N/A 35.36 64.63
Table 3: Rules discovered with machine learning.
Table available in the original PDF paper.
Equation reproduced from the original PDF.
If Average Sale Price > 587299.5 Then Fairfield If Average Sale Price > 220970.99 and Median Sale Price <= 248791.74 Then New Haven
Windham, New Haven, Tolland are the counties with lowest average sale prices Litchfield, Middlesex, Connecticut and Fairfield are the counties with the highest average sale price
Hartford with an average sales price of 313139.9588 median sales price of 258970.6029 is in one cluster Fairfield with an average sales price of 738519.6184 median sales price of 481410.9143 is in another cluster Windham with an average sales price of 239444.9894 in the same cluster, Hartford with an average sales price of 299963.6849 in the same cluster, Fairfield with an average sales price of 742079.5994 in the same cluster and Litchfield with an average sales price of 378967.632 in the same cluster
In the analysis following rules have been discovered, If Average Sale Price <= 220970.99 Then Windham. If Average Sale Price > 587299.5 Then Fairfield. If Average Sale Price > 220970.99 and Median Sale Price <= 248791.74 Then New Haven. Windham, New Haven, Tolland are the counties with lowest average sale prices. Litchfield, Middlesex, Connecticut and Fairfield are the counties with the highest average sale price. Hartford with an average sales price of 313139.9588 median sales price of 258970.6029 is in one cluster, Fairfield with an average sales price of 738519.6184 median sales price of 481410.9143 is in another cluster. Windham with an average sales price of 239444.9894 in the same cluster, Hartford with anaveragesalespriceof299963.6849inthesamecluster,Fairfieldwithanaverage sales price of 742079.5994 in the same cluster and Litchfield with an average sales price of 378967.632 in the same cluster.
According to ChatGPT(OpenAI) “the empirical analysis demonstrates that supervised and unsupervised machine learning techniques are effective in revealing meaningful price patterns within the Connecticut single-family housing market. Among the supervised models evaluated, the Multilayer Perceptron outperformed alternative classifiers, achieving the lowest RMSE and the highest correct classification rate, indicating superior predictive capability for housing price categorization. Rule-based findings further highlight strong county-level price differentiation, with Windham, New Haven, and Tolland consistently identified as lower-priced markets, while Fairfield, Middlesex, and Litchfield emerged as high-priced counties. The derived decision rules show that average and median sale prices serve as robust discriminators across counties, particularly for Fairfield and Windham. Clustering results reinforce these distinctions by grouping counties with similar pricing structures, revealing clear segmentation between high-value and moderate-to-low-value housing markets. Overall, the findings confirm that machine learning–driven data mining approaches can successfully capture spatial price heterogeneity and support data-informed interpretation of regional housing market dynamics” (ChatGPT-OpenAI, 2025).
40 Yavuz According to ChatGPT(OpenAI), “the findings of this study offer several important managerial implications for real estate professionals, policymakers, investors, and housing market stakeholders. First, the clear differentiation of counties based on average and median sale prices provides actionable insights for real estate developers and investors when evaluating location-specific investment strategies. High-priced counties such as Fairfield, Middlesex, and Litchfield present opportunities for premium housing developments and value-added services, whereas lower-priced counties including Windham, New Haven, and Tolland may be more suitable for affordable housing projects, first-time buyer initiatives, or volume-based sales strategies.
Second, the superior performance of the Multilayer Perceptron model highlights the value of advanced machine learning techniques for managerial forecasting and decision support. Housing market analysts and real estate firms can integrate such models into their pricing, valuation, and demand forecasting systems to improve accuracy and reduce uncertainty in volatile market conditions. Data-driven price segmentation can also support more effective marketing communication, enabling managers to tailor promotional messages and pricing strategies to distinct regional clusters. Third, the clustering results reveal natural groupings of counties with similar pricing structures, which can assist policymakers and local authorities in designing region-specific housing policies. Understanding these clusters allows decision-makers to align mortgage incentives, taxation policies, and housing subsidies with local market conditions rather than adopting a one-size-fits- all approach. Additionally, financial institutions may leverage these insights to refine risk assessment models and mortgage approval criteria based on regional price dynamics. Overall, the study demonstrates that data mining and machine learning techniques can serve as powerful managerial tools by transforming large-scale housing data into strategic insights. When embedded into managerial decision-making processes, such analytical approaches can enhance market responsiveness, optimize resource allocation, and support sustainable development within regional housing markets” (ChatGPT- OpenAI, 2025).
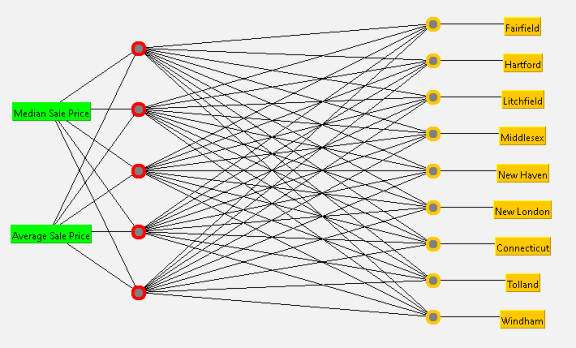
Figure 4: Neural network view of the research model.
CONCLUSION
Housing and housing associated goods and services constitutes important value for consumers. As shown in Figure 1, needs can be categorized under physiological needs, safety needs, social needs, esteem needs and self- actualization needs hierarchically according to Maslow. As indicated in the Maslow’s hierarcy of needs figure, sheltering, housing is one of the most basic needs of human beings. Later wants and demands take place, individuals engage in behaviours to afford their housing needs by either renting, buying a house or buying hotel, motel or other housing services If demand of the consumers meet the available housing options and recently constructed housing projects, rent and selling prices of the housing options may be in a balance meaning a significant increase and decrease in the prices are unlikely to occur. If the demand passes the supply it would be on the spot to wait for increases in the housing market, whereas a lower demand in a normal supply scenario is likely to lower the prices in the marketplace for consumers. There are also some factors associated with demand for goods and services of housing such as population growth, birth/death ratio, immigration, income, job security, savings, position of the consumer in the life cycle, payment options, credit options and availability as in mortgage
In this research average housing prices according to location considering date have been ananlysed using machine learning techniques available in data mining and computer science literature. Analysis results revealed that In the analysis following rules have been discovered, If Average Sale Price is less than and equal to 220970.99 Then Windham. If Average Sale Price > 587299.5 Then Fairfield. If Average Sale Price > 220970.99 and Median Sale Price <= 248791.74 Then New Haven. Hartford with an average sales price of 313139.9588 median sales price of 258970.6029 is in one cluster, Fairfield with an average sales price of 738519.6184 median sales price of 481410.9143 is in another cluster. Windham with an average sales price of 239444.9894 in the same cluster, Hartford with an average sales price of 299963.6849 in the same cluster, Fairfield with an average sales price of 742079.5994 in the same cluster and Litchfield with an average sales price of 378967.632 in the same cluster. Windham, New Haven, Tolland are the counties with lowest average sale prices whereas Litchfield, Middlesex, Connecticut and Fairfield are the counties with the highest average sale price. In the analysis, Multilayer perceptron, has been the top scorer with its correct classification rate and RMSE.
Studies of this type blended with machine learning and data mining can provide several insights to decision makers, leaders and society at large while contributing to a beneficial, deeper understanding for such research phenomena.
REFERENCES
Alloghani, M., Al-Jumeily, D., Mustafina, J., Hussain, A., & Aljaaf, A. (2020). A systematic review on supervised and unsupervised machine learning algorithms for data science. Bögenhold, D. (2009). Maslow’s hierarchy of needs.
forbes.com/advisor/mortgages/real-estate/connecticut-housing-market/ Data mining. (n.d.). Wikipedia. Retrieved from https://en.wikipedia.org/wiki/Data_ mining Kotler, P. (2012). Principles of marketing. Pearson. Kotler, P. (2012). Marketing masnagement. Pearson. Machine learning. (n.d.). Wikipedia. Retrieved from https://en.wikipedia.org/wiki/
Machine_learning Mankiw, N. G., & Taylor, M. P. (2011). Economics (2nd ed., revised). Andover: Cengage Learning. Maslow’s hierarchy of needs. (n.d.). Wikipedia. Retrieved from https://en.wikipedia.
org/wiki/Maslow%27s_hierarchy_of_needs McLeod, S. (2007/2021, December 29). Maslow’s hierarchy of needs. Simply Psychology. Retrieved January 2, 2022, from https://www.simplypsychology.org/ maslow.html OpenAI. (2025). ChatGPT [Large language model]. https://chat.openai.com/ Perkis, D. F. (2021, March). The science of supply and demand. Page One Economics. Sharma, A., Kaur, A., & Semwal, A. (2022). Supervised and unsupervised prediction
application of machine learning. Supply and demand. (n.d.). Wikipedia. Retrieved from https://en.wikipedia.org/wiki/ Supply_and_demand Yan, M., Liu, K., Guan, Z., Xu, X., Xu, Q., & Bao, H. (2018). Background
augmentation generative adversarial networks (BAGANs): Effective data generation based on GAN-augmented 3D synthesizing. Symmetry.
LISTED IN THE AHFE DIGITAL BOOKSTORE CATALOGUE
Explore the complete digital volume
Human Factors, Business Management and Society
Read this individual research paper free through the original publisher, or explore the full digital proceedings book.
ISBN 978-1-964867-91-5
Explore this ISBN in the AHFE Bookstore ↗Listed in the July 2026 bookstore catalogue; search by ISBN to confirm current availability · Digital book purchase optional