Huimin Hu, Jianglan Chen, Wei Li, Ling Luo, Daoqi Su, Yinxia Li, Wenlei Niu, Anna Hao (2023). Construction of evaluation index system for vehicle occupant's riding posture comfort. In: Human Factors in Transportation. AHFE Open Access, vol. 95, pp. 27–35. https://doi.org/10.54941/ahfe1003789
In order to improve the comfort of the occupant's riding posture on the car seat, research was conducted from the perspective of human body posture in two sitting and semi-recumbent situations. Firstly, key angle indicators that affect the occupant's riding posture comfort were selected, and an evaluation index system of the vehicle occupant's posture comfort was constructed. Secondly, according to the index system, a subjective user experience survey of 30 expert users was completed. Finally, the weight coefficient of the evaluation index system was determined by the G1 method, combining the evaluation results. This index system can provide a reference and basis for the evaluation of the comfort of the car seat posture, and can be used to inform the intelligent adaptability of the vehicle layout and seat posture in the future.
The evaluation index system is an organic whole with an internal structure composed of multiple indicators that characterize the characteristics of vari- ous aspects of the evaluation object and their interrelationships, and there must be a certain logical relationship between the indicators (Jiang, 2019). In ergonomics, determining the weight of the evaluation system index is a key issue, and the weight is an intuitive means to reflect the importance of each index in the evaluation system (Lu et al., 2022).
At present, with the improvement of people’s living standards, the focus of attention on car seats has shifted from traditional “functional safety” to “comfortable experience” and other user experience aspects, with higher requirements for the quality of use and the degree of humanized design. With the development of intelligent technology, car seats are no longer limited to satisfying the traditional sitting support function, but also provide intelli- gent adjustment functions in active scenarios such as sitting or semi-lying positions. However, due to the lack of relevant design indicators and design requirements for the comfort of the car seat posture, the overall design level
of the industry is uneven and the user experience is not satisfactory. There- fore, it is essential to study the evaluation index system of vehicle occupant posture comfort.
This paper will take the car seat as the research object, and based on the physiological and psychological symptoms and behavior habits of the target users, study the key index system that affects the comfort of the sitting posture of the car seat. The indicators will be combined to determine the degree of influence on posture comfort, and the weight coefficient of the index will be studied and determined. The research results can provide a reference and basis for the evaluation of the posture comfort of the seat products in the automotive industry and the optimal design of the seat posture in a limited space.
ESTABLISHMENT OF THE INDEX SYSTEM Principles of Index System Construction
The following three principles should be followed when establishing an evaluation index system for occupant riding posture comfort:
1) The principle of comprehensiveness The established index system must be able to comprehensively assess the occupant’s riding posture comfort. It is necessary to consider not only the various posture angles com- posed of various body parts of the human body, but also the human posture under multiple working conditions, and build a comprehensive evaluation index system based on the principle of multi-situation and multi-angle. 2) Principle of Conciseness The index system established must be suffi- ciently refined and clear. The indicator system should not ignore key indicators because it is too simple, resulting in an incomplete indicator system; it should not be too large, mixed with irrelevant indicators, and the impact of irrelevant indicators on the indicator system should be reduced. 3) Indicators established by the principle of operability The system is ope- rable and feasible in practical application. When selecting indicators, it should be considered whether it is convenient to collect and measure, and whether it is feasible in the process of establishing the indicator system. In addition, it is also necessary to ensure that the index system adapts to the future development trend of automobile seats, which requires that the index system should be modifiable, expandable, and perfect.
Index System Construction Method In this paper, the ergonomics evaluation of the human body posture angle of the occupant in the sitting posture of the car seat is carried out, mainly from the two sitting postures and the semi-recumbent posture. According to the comprehensive analysis of human physiological characteristics and literature research results (Andreoni et al., 2002; Park et al., 2000; Wolf
Construction of Evaluation Index System for Vehicle Occupant’s Riding Posture Comfort 29
et al., 2022), neck and shoulder angles, torso angles, hip angles, thigh hori- zontal angles, calf horizontal angles, knee angles, ankle angles, and foot plate angles are the factors that affect the occupant’s riding posture. 8 main indicator factors. According to the characteristics of human physiology and the principle of index system construction, combined with the main posture interaction points between the occupant and the car seat in the sitting and semi-recumbent positions, the evaluation index model and index system for the comfort of the occupant’s riding posture were constructed (see Table 1). Among them, O is the overall goal, Oi (i = 1, 2) is the sub-goal, and Uk is the index layer.
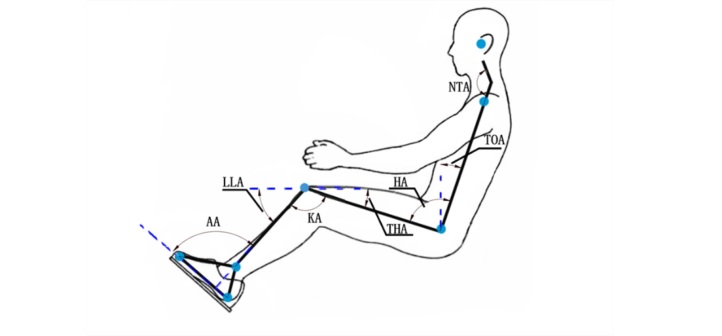
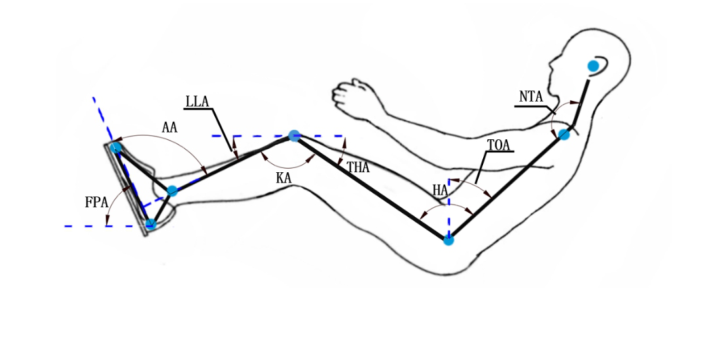
Definition of Key Posture Angles of the Human Body In order to ensure the consistency and reproducibility of posture design and evaluation, combined with posture ergonomics experimental testing practice, this document gives the definition and description of each posture angle, as follows:
1) Neck-torso angle: tragus point The angle between the line connecting the shoulder peak point and the point connecting the shoulder peak point and the greater trochanter point (see the angle NTA in Figure 1 and Figure 2). 2) Torso angle: the angle between the line connecting the acromion point and the greater trochanter point and the vertical line (see the angle TOA in Figure 1 and Figure 2). 3) Thigh angle: the angle between the line connecting the greater trochanter point and the midpoint of the patella and the horizontal line (see the angle THA in Figure 1 and Figure 2).
Table 1. Evaluation index system of automobile occupant riding posture comfort.
Figure 1: Sitting on sagittal attitude angle position.Figure 2: Half-lying posture by sagittal attitude angle position.
4) Hip angle: the sum of the complementary angles of the trunk angle and the horizontal thigh angle (see angle HA in Figure 1 and Figure 2). 5) Lower leg angle: the angle between the line connecting the midpoint of the patella and the point of the lateral malleolus and the horizontal line (see the angle LLA in Figure 1 and Figure 2). 6) Knee angle: the angle between the line connecting the midpoint of the patella and the point of the lateral malleolus and the line connecting the point of the greater trochanter and the midpoint of the patella (see angle KA in Figure 1 and Figure 2). 7) Ankle angle: the angle between the center line of the palm surface (the line connecting the tip of the third toe and the heel point) and the line connecting the midpoint of the patella and the lateral malleolus (see Figure 1 and Figure 2, middle angle AA).
Construction of Evaluation Index System for Vehicle Occupant’s Riding Posture Comfort 31
8) Foot plane angle: the angle between the center line of the sole surface (the line connecting the tip of the third toe and the heel point of the foot) and the horizontal line (see the angle FPA in Figure 2).
THE DETERMINATION OF INDEX WEIGHT COEFFICIENTS G1 Method
Commonly used index weighting methods include the subjective weigh- ting method, objective weighting method, and combined weighting method. Among them, the subjective weighting method includes AHP, the G1 method, and so on. In this paper, the G1 method is used to determine the weight coefficients of each index in the evaluation index system of vehicle occupant posture comfort. The G1 method is an improved method of AHP (Analy- tical Hierarchy Process) analytic hierarchy process proposed by Guo Yajun (Guo. 2002). The basic principle of this method is to sort all the indicators in the same layer according to a certain evaluation criterion, and then quan- titatively assign the importance of the adjacent importance degree indicators according to the established method, and calculate the ranking and assign- ment results according to a certain calculation method. Through calculation, the weight coefficients of all indicators in this level of indicators are obtai- ned, which has the characteristics of high reliability, small error and strong operability. Assuming that the evaluation index set in an index layer is {u1, u2,...,un}, the steps of this method are as follows
1. Determine the ranking of the importance of indicators.
For several evaluation indicators {U1, U2, · · · , Um} at the same level, select the most important indicator according to a certain evaluation crite- rion, which is recorded as U1*, and then select the most important indicator according to the same evaluation criterion from the remaining indicators. The most important indicator is recorded as U2*, and so on, then the evaluation indicators U1, U2,..., Um determine the only importance ranking relationship, that is,
{U∗
1 > U∗ 2 > . . . > U∗ m} (1) For the convenience of writing, formula (1) is recorded as
{U1 > U2 > . . . > Um} (2)
2. Relative importance assignment.
Assuming that the evaluation indicators are U1, U2, ·, UM,the expert’s rati- onal judgment on the ratio of the importance of the evaluation indicators Uk−1 to Uk is ωk−1/ωk is as follows
Equation reproduced from the original PDF.Table 2. Description of rk value assignment.
Table available in the original PDF paper.
rk illustrate 1.0 Indicator Uk-1 is equally important as Indicator Uk Indicator Uk-1 is slightly more important than Indicator Uk 1.4 Indicator Uk-1 is significantly more important than Indicator Uk 1.6 Indicator Uk-1 is strongly more important than Indicator Uk 1.8 Indicator Uk-1 is more important than Indicator Uk extremely important
3. Calculation of weight coefficient
The calculation formula of the weight coefficient ωk is: −1
[Equation or mathematical symbol available in the original paper PDF]
[Equation or mathematical symbol available in the original paper PDF] m X m Y
(4)
ωm =
ri
[Equation or mathematical symbol available in the original paper PDF]1 +
Equation reproduced from the original PDF.
Calculation Result of Weight Coefficient When the number of experts exceeded 16, the weight coefficient of the evaluation target tended to be stable, indicating that the calculated weight coefficient was reliable. Therefore, a total of 30 experts were hired in this survey based on the actual situation. At the same time, 30 user experts were asked to use and experience the car seat, and compare and judge the same problem.
According to the survey results and the calculation of formulas (3) and (4), the weights of all targets in each target set are shown in Table 3. From the
Table 3. The weight of the comfort evaluation index for the passenger’s riding posture.
Table available in the original PDF paper.
First-level indicators
Second-level indicators
Third-level indicators Three-level weight
Comprehensive weight
O1: Sitting posture angle
O: Evaluation index of vehicle occupant sitting posture comfort
Construction of Evaluation Index System for Vehicle Occupant’s Riding Posture Comfort 33
weight value, it can be seen intuitively that whether it is a sitting posture or a semi-lying posture, the angle between the neck and shoulders, the angle of the trunk, and the angle of the hip are the three key indicators that affect comfort.
According to the survey results and the calculation of formulas (3) and (4), the weights of all targets in each target set are shown in Table 3. It can be intuitively seen that the angle between the neck and shoulders, the angle of the trunk, and the angle of the hip are the three key indica- tors that affect comfort, regardless of whether it is a sitting or semi-lying position.
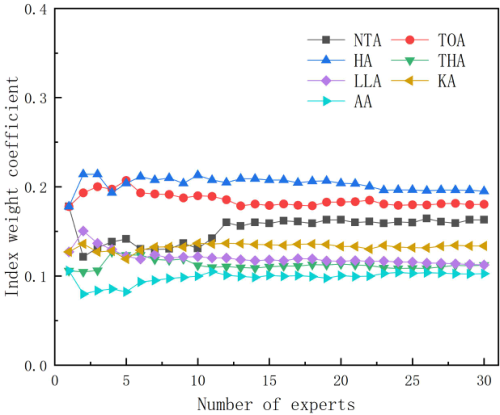
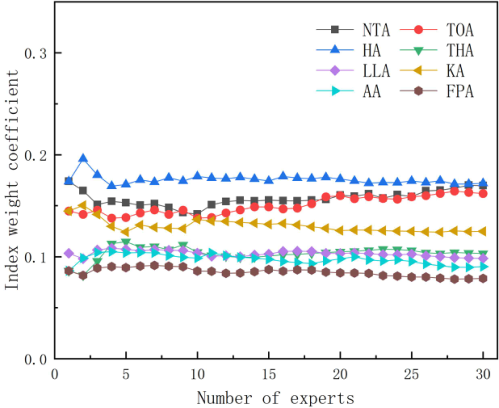
STABILITY ANALYSIS In order to determine the reliability and effectiveness of the calculated target weight coefficients, a detailed analysis of the judgment results of different numbers of expert users was conducted. The change of the weight coef- ficients of each index layer with the increase in the number of experts was obtained. When the number of experts reached a certain number, and the final change trend gradually tended to be stable, with the weight coefficient value of the evaluation target or index fluctuating little, it pro- ved that the weight calculation value of this time was reliable (Li et al, 2006). Representative data selected for this stability analysis are shown in Figure 3. It can be seen from Figure 3 and Figure 4 that when the number of expert users reached 30, the index weight coefficients of the evalua- tion targets tended to be stable, indicating that the evaluation target or index weight coefficients calculated by the G1 method in this paper were reliable.
Figure 3: Comparison of index weight coefficients in O1.Figure 4: Comparison of index weight coefficients in O2.
CONCLUSION
This paper utilizes expert consultation experience and the G1 method to determine the evaluation index and weight coefficient of the comfort of the car occupant’s riding posture. The aim is to understand the impact of the user experience design level of this index on the overall riding posture comfort of the car seat. This research provides a reference and basis for subsequent improvement of car seat angle adjustment parameters, design and evaluation of interior space, and ultimately, the improvement of the comfort of car seat riding posture.
ACKNOWLEDGMENT
The authors would like to acknowledge this. Supported by 2023 Fundamen- tal Research Funds from Central Finance of China (Project Title: Research on Ergonomic Design Requirements of Passenger Seat Based on Posture Comfort).
REFERENCES
Andreoni, G., Santambrogio, G. C., Rabuffetti, M., & Pedotti, A. (2002). Method for the analysis of posture and interface pressure of car drivers. Applied Ergonomics, 33(6), 511–522. Guo Y J. (2002). The theory and method of comprehensive evaluation. Science Press,
41–46 (in Chinese). Jiang R Y. (2019). In-service Quality Indices and Performance Evaluation Indicator. Li Y X, Yuan X G, & Yang C X, et al. (2006). Weight Factors Determination of the Evaluation Indexes of Cockpit Ergonom. Acta Aeronautica et Astronautica Sinica, 3, 370–373 (in Chinese).
Construction of Evaluation Index System for Vehicle Occupant’s Riding Posture Comfort 35
Lu, H., Zhao, Y., Zhou, X., & Wei, Z. (2022). Selection of Agricultural Machinery Based on Improved CRITIC-Entropy Weight and GRA-TOPSIS Method. PROCESSES, 10(2). Park, S. J., Kim, C.-B., Kim, C. J., & Lee, J. W. (2000). Comfortable driving postures
for Koreans. International Journal of Industrial Ergonomics, 26(4), 489–497. System of Engineered Systems: Literature Review. Journal of mechanical engineering, 55(18), 206–214 (in Chinese). Wolf, P., Hennes, N., Rausch, J., & Potthast, W. (2022). The effects of stature,
age, gender, and posture preferences on preferred joint angles after real driving. Applied Ergonomics, 100, 103671.
LISTED IN THE AHFE DIGITAL BOOKSTORE CATALOGUE
Explore the complete digital volume
Human Factors in Transportation
Read this individual research paper free through the original publisher, or explore the full digital proceedings book.
ISBN 978-1-958651-71-1
Explore this ISBN in the AHFE Bookstore ↗Listed in the July 2026 bookstore catalogue; search by ISBN to confirm current availability · Digital book purchase optional