Mac Reynolds, Sofia Scataglini (2023). Effects of Back Postures on Driving Positions as Measured with DHMs. In: Digital Human Modeling and Applied Optimization. AHFE Open Access, vol. 76, pp. 70–80. https://doi.org/10.54941/ahfe1003356
1 Professor emeritus, Departments of Osteopathic Manipulative Medicine and Anthropology, Colleges of Osteopathic Medicine and Social Science, Michigan State University, East Lansing, Michigan, USA ↗
2 Department of Rehabilitation Sciences and Physiotherapy, Faculty of Medicine and Health Sciences, University of Antwerp, Antwerp, Belgium ↗
Drivers use a range of back postures that affect seated positions. Standards in seat design and safety tests assume drivers sit in fully supported back postures which this investigation finds invalid for small females. Twenty-two cars and 20 utility vehicles from Europe, USA, and Asia were measured and evaluated with the ERL Digital Human Models. In these vehicles, the head restraint interferes with upright postures in small females and requires an average neck flexion that is 2.9X greater than optimal for driving positions in these DHMs. Small women’s thighs penetrate the linear elastic region of front of cushion an average of -5.7 ±5.9 mm which would require muscle contractions to compress for holding the heel on the floorboard. Postural adaptations move small women into unsupported backs for driving. Consequently, improvements in vehicle and seat designs for back posture variability are needed for comfort, ergonomics, and safety.
Seated positions of automobile drivers define an intersection of ergonomics and safety. Body size and back posture (Reynolds and Paul, 2018) chal- lenge this intersection because seat positions change with body size and back postures. Automobile design for drivers begins with a large male model, the H-Point Machine (HPM), sitting in vehicle space with a reclined, sligh- tly slumped back posture (Geoffrey, 1961). HPM, the first driver model in design, is the reference design standard in the automotive industry for ergo- nomics, safety, seat adjustments, seat size, and structures (i.e. frame and head restraint).
In this design system, body size affects injury statistics. Women are smaller than men and have a 3X greater risk of whiplash injury than men (Sato, 2019; Sato et al., 2020). Research investigations of driver position and whiplash often remove head restraints so they do not interfere with driver positions in vehicles such as a 2003 Volvo V70 (Jonsson et al., 2008), 2010 Toyota Highlander (Park et al., 2016), and an unidentified 2010 sedan (Park et al., 2018). Consequently, is driver position in the seat a part of gender differences in injury statistics?
Effects of Back Postures on Driving Positions as Measured With DHMs 71
Back postures, representing behaviours and body size, vary with preference (Andreoni et al 2002), anatomy (Milne and Lauder, 1974), and range of torso motions (Brodeur & Reynolds, 1995). In radiographic studies of drivers in production seats, back posture was observed to move head position forward when sitting slumped and rearward when sitting erect (Hey et al., 2017; Nish- ida et al., 2020). Wang & Bulle (2017) concluded that laboratory studies do not represent more than 30% of positions drivers use on the road. They attri- buted this lack of agreement to vision requirements of driving. Thus, does an optimal driving position and seat support of driving back posture confound driver position studies?
The addition of digital human models (DHM) over the past 30 years has developed finite element models of the human body-seat interaction, such as CASIMIR, to define DHM positions in deflected seats (Siefert and Hofmann, 2019) and investigate pressure distribution in the seat for the average male (Alawneh et al., 2022). This approach uses scanned shapes of real drivers where back postures are unknown. DHMs that define back postures can evaluate seat support for driver back postures. The same anatomical lan- dmarks establish a comparable interaction between seat and back posture. These DHMs can standardize limb lengths so that back postures evaluate effects of seat design and head restraint position on driver positions.
METHODS
VEHICLES. Twenty-one Cars and 20 utility vehicles (UV) were identified in Reynolds (2019) with a 2003 Mercedes Benz E320 increases the sample to 22 Cars. The vehicles had 2-way (3 cars, 3 UVs), 4-way (1 car), 6-way (18 Cars, 17 UVs) seat adjustments with tilt steering wheels in all Cars and UVs and telescope in 14 Cars and 10 UVs. For the current analysis, data were transformed from vehicle origin to Accelerator Heel Point.
ERL developed 9 DHMs (Reynolds et al., 2001) from measurements of anatomical landmarks in body sizes representing small females, medium males and large males in the population. Back curvatures were defined as a function of lumbar curvatures in 102 adult subjects (Brodeur and Rey- nolds, 1995), and torsos were scaled to cervicale heights of the 5th female, 50th and 95th male percentiles (Gordon et al., 1989). Pelvic sizes (Rey- nolds, Snow, and Young 1982), position, and orientation are based on laboratory measurements (Brodeur et al., 1996). Fifth female (789 mm), 50th (927 mm) and 95th (1009 mm) male trochanterion height percenti- les were used in regression equations to calculate arm and leg proportions (Cheverud et al., 1990) for linkage dimensions (Dempster et al. (1964). Hands, feet, and head were developed from ANSUR for each body size. Cross sections of deflected tissue shapes were measured in 39 male and 22 females (Brodeur and Reynolds, 2001) and used to create 3D shape of the bodies. Each DHM is identified by 3 letters, e.g., ESF (Erect Small Female), representing back postures (Erect (E), Neutral (N), and Slumped (S)), body sizes (Small (S), Medium (M) and Large (L)), and gender (Female (F) and Male (M)).
72 Reynolds and Scataglini
Seats are measured from the rearmost, downmost seat position in the vehicle with 0
cushion tilt and seatback in its most upright position. A force- /deflection (F/D) machine measured cushion and seatback stiffness using solid 3-dimensional models of the NMM buttocks and chest for force application. Peak measured forces are 540N in the cushion and 200N in the back. Three- dimensional scans of trimmed seat surfaces define shape and the position of 0 N in the F/D seating model. F/D curves of the cushion and seatback are defi- ned by toe (initial minimal force for relatively large deflection), elastic region (linear deflection of seat), and creep (change in deflection after 20 minutes at peak load).
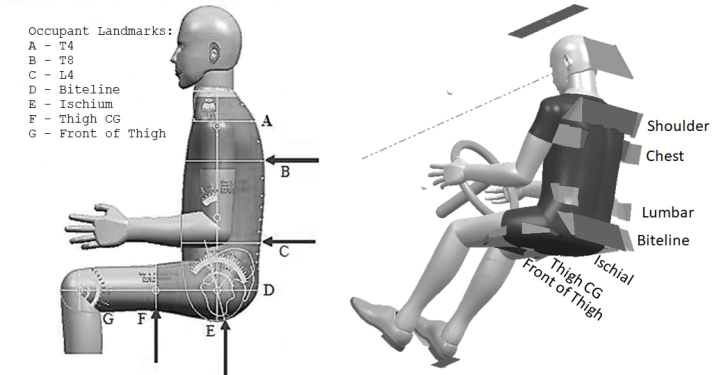
Driving positions use an equilibrium model of seat support for body wei- ght at the same landmarks (Figure 1) in each DHM (Reynolds et al., 2006). Forces are calculated on the seat centerline at ischial tuberosity (E), thigh at center of gravity (F), chest at 8th thoracic vertebra (B), and lumbar at 4th lumbar vertebra (C). Heels share leg weight supported on floorboard (con- tact within ±0.1 mm). X, Z coordinates define position of each patch, and smooth continuous contours for cushion and seatback are constrained with continuity and orientation angles between adjacent patches. Contact with the seat is measured at Front of Thigh (G), Biteline (D), Shoulder (A), and Head Restraint (Opisthocranion). Front of Thigh (FoT) landmark is located on the posterior surface of the thigh at 75% of distance from thigh center of gravity to the back of calf when the knee is flexed 90
. Shoulder contact with patch is measured at the 8th thoracic vertebrae.
A large scale generalized reduced gradient optimization program (Lasdon et al., 1978) uses occupant specific (OS) and non-occupant specific (NOS) variables for equations that define 1) joint angles, anatomical geometry and vehicle packaging (x functions) and 2) driver positions of eye, landmarks relative to seat, vehicle controls and seat shape (g-functions). Dimensions in the ERL optimization (Reynolds and Wehrle, 2012) are in Table 1.
Figure 1: Anatomical landmarks and patches with arrows identifying support lan- dmarks used to optimize seated positions for driving.
Effects of Back Postures on Driving Positions as Measured With DHMs 73
Table 1. Dimensions in optimization software as defined for each DHM relative to independent X variables, g-functions and constants for OS and NOS variables.
G-functions Vision Eye location (X, Z) (OS) Seat Shape Orientation & Continuity angles between Patches (NOS) Landmark Positions Distance to patch top/rear, distance to patch bottom/front, normal distance to all patch surfaces (OS) Accelerator HRP (X, Y, Z) contact with floorboard, Sole (ball of foot) contact with pedal (distance to top, bottom & surface) (OS) Steering Wheel Hand grip to rim (Top, Center & Bottom of Grip Axis), Thigh Clearance, Chest Distance, Stomach Distance (OS) Joint Angles Neck, Torso, Thigh (Splay, Flexion, Rotation), Knee, Ankle (Rotation, Flexion, Inversion), Shoulder (Flexion, Abduction, Rotation), Elbow, Wrist (Rotation, Flexion, Deviation) (OS) Constants Pedal length, pedal width, steering wheel diameter, steering wheel rim diameter, Hand position, Headliner Z, Upper vision target (X, Z), Downward vision target (X, Z), Seat Material Properties (Toe, stiffness, and creep for each support patch) (NOS)
Joint angle variables are used in both x and g functions. The head cannot penetrate the head restraint patch and the neck joint angle is constrained to +1 mm minimum backset. Eye Z positions are constrained within 25 mm to 125 mm, below center of inside rear-view mirror (IRVM). Four anatomical landmarks are used to distribute body weight on the seat within ±2 mm of support patches on the trimmed seat surface when unloaded to 0 N. Optimal surface contact is constrained uniquely by landmark. The Objective Function optimizes lines of sight upward (+15
to IRVM from horizontal) and dow- nward (−15
to IP center from horizontal) and comfortable angles of elbow, hip, knee, shoulder, and thigh.
HPM Position is calculated with the seat at downmost position, 0
cushion tilt, ball of foot on accelerator, heel on floorboard, and same seat support and contact as DHMs. Landmarks for Chest (T8) and Lumbar (L4) were defined by aligning HPM’s hip shoulder with NMM torso (Brodeur and Reynolds,
74 Reynolds and Scataglini
1995). The ischial landmark is the SAE D-point, and the thigh centre of gra- vity was calculated as a proportion of length from hip to knee (Dempster et al., 1964). The Head Restraint Measurement Device is rigidly attached to the HPM torso for head restraint design and backset (Gane, 1999).
The ERL tool was validated (Reynolds and Wehrle, 2012) in 2006 double blind comparative study. Twelve professional drivers representing small to large body sizes drove 7 vehicles: 3 sedans, 2 SUVs, and 2 crossovers with seats from 5 seat suppliers. Each vehicle was driven 2 hours and drivers sub- jectively rated comfort. After all drives were completed, seats and vehicle architectural data were given to ERL, LLC labelled A-G for analysis. ERL comfort scores (Reynolds and Scataglini, 2022) compared to driver comfort scores per vehicle had a correlation of 0.78.
The average, minimum and maximum for each DHM in all Cars and UVs are graphed, and curves fit the averages of all DHMs and HPM to show effects of body size. Significant differences between body sizes and Cars with UVs will use T-tests with p < 0.05. Effect of posture uses single factor ANOVA to test 3 postures in each body size with p <0.05 for significance.
RESULTS
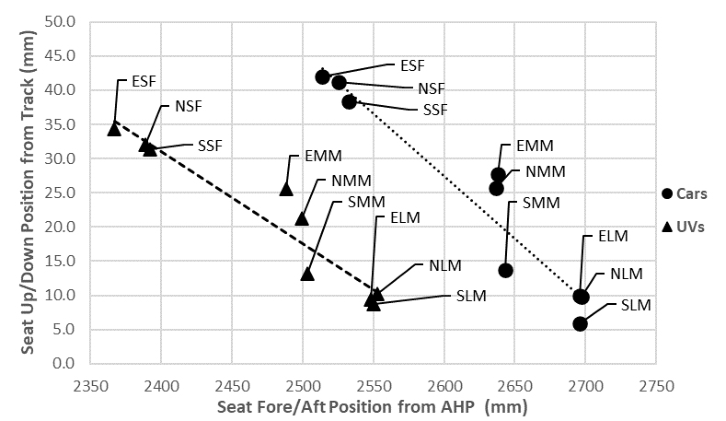
Total seat travel in Cars (x = 247mm) is significantly larger than UVs (x = 236 mm). Seat fore/aft positions relative to accelerator heel point (AHP) and seat up/down positions relative to track are presented in Figure 2. Ave- rage SFs sit at 77% of total seat travel from RMDM while MMs and LMs sit at 30% and 7% of total seat travel, respectively. Thirty-three percent of LMs in Cars and 53% in UVs sit at full rearmost seat positions. SF back posture effects in fore/aft positions are statistically significant in UVs, and MM back posture effects in Car and UV up/down travel are statistically significant.
Figure 2: Seat up/down per fore/aft position for all DHMs in cars and UVs.
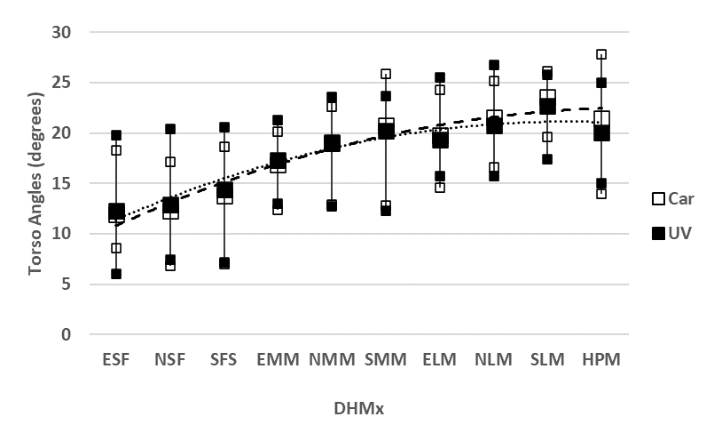
Effects of Back Postures on Driving Positions as Measured With DHMs 75 Linear trendlines for these data indicate a good fit with R2 = 0.922 and 0.911 for cars and UVs respectively. Torso angle is the angle of hip-shoulder axis relative to vertical (Figure 3). Average torso angles recline from small female (x = 12.9
±3.5) to large male (x = 21.3
±2.8). Only MM and LM have statistically significant differences in torso angles between Cars and UVs. All SF are significantly different from all MMs, and LMs have mixed statistical differences with MMs. HPM has torso angles (x = 21.1
) like SMM (x = 20.8
) and NLM (x = 21.6
) in Cars, and SMM (x = 20.2
) and NLM (x = 20.8
) in UVs. Back postures significantly affect MM and LM (P< 0.05) in Cars and UVs. SFs do not have significant torso angle variation in Cars and UVs. The Erect to Slump postu- res in MM and LM have an average 19% increase of torso angle in UVs and Cars.
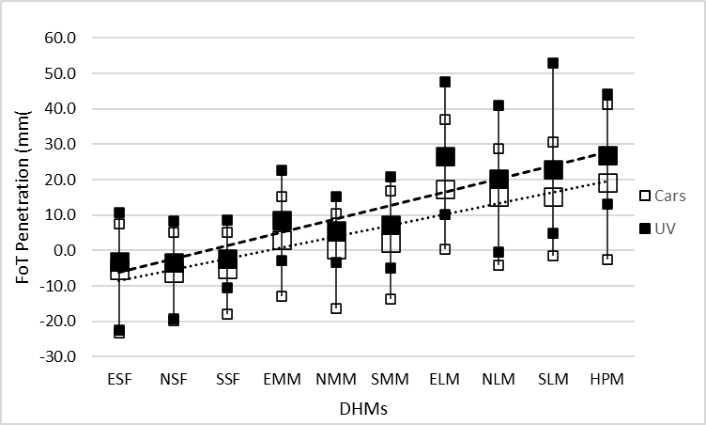
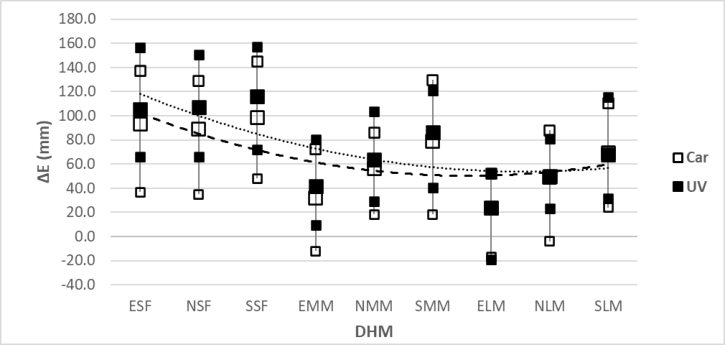
In the cushion, contact, after removing toe deflection at the FoT landmark, measures penetration of the elastic region (Figure 4). All SF (x = −5.7 mm) and LM (x = 16.0 mm) in Cars and UVs have statistically significantly diffe- rences (p < 0.05) from MM (x = 1.9 mm). There is greater penetration of FoT in all DHMs in Cars than UV, and the differences are statistically significant for EMM, NMM, ELM, SLM and HPM. However, there is no significant effect of back posture by body size on FoT penetration.
Small females penetrate the linear elastic region of seat deflection in 79% of Cars and 68% of UVs. Corresponding average percentages in Cars and UVs for MM and LM are 21% and 4%.
Eye height (EZ) was measured relative to the inside rear-view mirror (IRVM) with the head levelled relative to the Frankfort Plane. Figure 5 plots eye height from center of IRVM (1E) for each DHM. Since IRVM and Eye
Figure 3: Average, maximum, and minimum torso angles for each DHM in cars and UVs.
76 Reynolds and Scataglini
Figure 4: Average, maximum and minimum FoT (mm) elastic penetration in cars and UVs.Figure 5: Average, maximum, and minimum 1E for each DHM in cars and UVs.
coordinates are calculated in the vehicle axis system (V), the data have been translated to the Accelerator Heel Point (AHP) as defined in SAE J1100 (SAE International Surface Vehicle Recommended Practice 2009).
Equation reproduced from the original PDF.
1E = MZ −EZ (3) Only SSF has a significant difference in heights between Cars and UVs. Back posture does not affect 1E in SF, but MM and LM have significant eye heights decreasing from erect to slumped. Significant differences in 1E
Effects of Back Postures on Driving Positions as Measured With DHMs 77
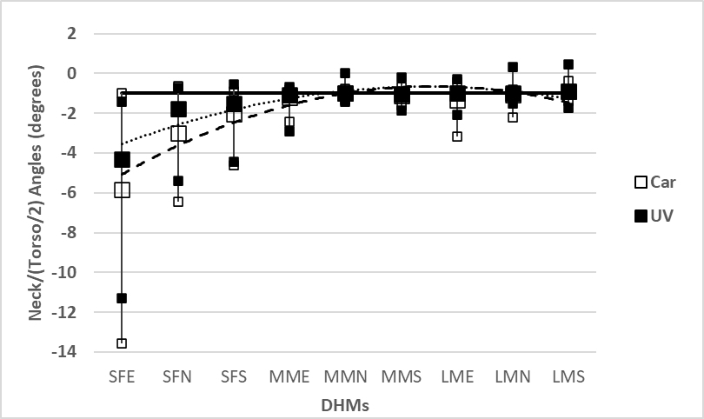
Figure 6: Average, minimum, and maximum neck/(torso/2) ratio in cars & UVs.
between SF and LM with MM are present for 67% of DHMs in Cars and 78% in UVs. Neck normalized to torso angle (Neck/(Torso Angle/2) uses a link from C7/T1 to the occiput/C1 joint. SF flexes the neck 2.9x the flexion used by medium and large males (Figure 6). Back posture significantly affects Neck/(Torso/2) of SF in Cars and UVs (P < 0.05) and the ratio changes in ESF to SSF from −4.2 to −2.1 in Cars and −3.6 to −1.8 in UVs. Back postures do not significantly affect Neck/(Torso/2) angles in MM and LM.
The optimal angle equals −1, and the average Neck/(Torso/2) angle ratio ±2 SD for all MM in Cars is −1.9 to −0.3 and −1.8 to −0.2 in UVs. The proportion of SF within these boundaries are 0.14, 0.32 and 0.64 in Cars and 0.15, 0.70, and 0.75 in UVs. All SFs in cars are significantly different (p<0.05 in 2 sample unequal variance T Tests) from all MM and LM. In UVs, only ESF is statistically significantly different from all MM and LM.
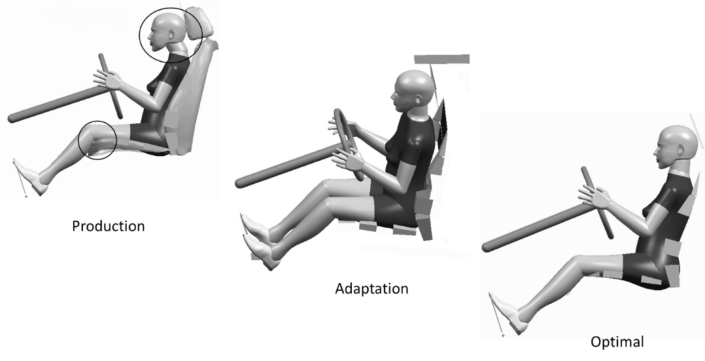
EXAMPLE OF ADAPTATION AND OPTIMAL FOR HEAD RESTRAINT DESIGN Settled, adaptative, and optimal postures are shown for ESF in a 2007 BMW 328 (Figure 7). Neck/(torso/2) ratios are −13.3 and −1.0 in Production and Adaptation, respectively. The seatback was reclined from 6.9
in production to 10.0
in adaptation. Minimum head restraint backset is +1 mm in both positions, but T8 in Adaptation is 32.6mm from Chest patch. Neck/(torso/2) ratio for ESF is −1.0 in optimal. SgRP changed X, Z positions from 2330.8, 467.4 mm in production to 2323.9, 464.7 mm in optimal, and HPM sits with torso angles of 24.2
and 21.1
with head restraint setbacks of 46.0 and 50.2 mm.
78 Reynolds and Scataglini
Figure 7: ESF sitting with settled support in production seat, an adaptation with seatback reclined to remove head restraint interference, and an optimal design.
DISCUSSION AND RECOMMENDATIONS Design for driving must consider interactions between driver, seat, and vehicle for variations in body size (small to large) and back postures (erect to slum- ped). The fully supported positions in Federal Motor Vehicle Safety Standard 49 CFR 571.214 for an average male driver at the middle of fore/aft seat travel and a small female passenger at the most forward position of seat tra- vel (NHTSA, 2018) do not correspond with ERL seated driving positions of MM and SF. Head restraint interference was found in a Volvo V70 for male passengers with <173 cm stature and female drivers <160 cm stature, ∼35th percentiles in ANSUR data (Jonsson et al., 2008). SF use upright torso angles for driving vision. Back postures in driving affect seat positions, seated body positions, relative mass distribution, and eye height for driving which need specifications for new female ATDs (Linder and Svensson, 2019). In conclusion, seats are not well-designed for smaller woman, and the following recommendations are offered:
1) >35% of females make unsafe seated adaptations to operate vehicle. 2) Head restraint positions for seated drivers must accommodate torso angles of 13
for SF and 21
for LM. 3) Head restraint and centerline shape define seat back support to accom- modate back posture variation in all drivers. 4) Tilt and centerline shape define cushion length to accommodate body size variation in all drivers.
REFERENCES
Alawneh, O., Zhong, X., Faieghi, R., Zi, F., 2022. Finite Element Methods for Modeling the Pressure Distribution in Human Body – Seat Interactions : A Systematic Review. Appl. Sci. 12, 18. https://doi.org/10.3390/app12126160
Effects of Back Postures on Driving Positions as Measured With DHMs 79
Brodeur, R. R., Cui, Y., Reynolds, H. M., 1996. Locating the pelvis in the seated automobile driver, in: SAE Technical Papers. https://doi.org/10.4271/960481 Brodeur, R. R., Reynolds, H. M., 2001. Digital definition of the deflected shape of
the human body in seated postures for ergonomic design in CAD models, in: SAE Technical Papers. https://doi.org/10.4271/2001-01-2106 Brodeur, R. R., Reynolds, H. M., 1995. Modeling Spine Shape for the Seated Posture.
East Lansing. https://doi.org/https://doi.org/doi:10.25335/M5CF9J91H Cheverud, J., Gordon, C., Walker, R. A., Jacquish, C., Kohn, L., 1990. Anthropometric Survey of US Army Personnel (1988): Correlation Coefficients and Regression Equations. Part 3. Simple and Partial Correlation Tables--Female. Dempster, W. T., Sherr, L. A., Priest, J. G., 1964. Conversion Scales for Estimating
Humeral and Femoral Lengths and the Lengths of FUnctional SEgments in the Limbs of Caucasoid Males. Hum. Biol. 36, 246–262. Gane, J., 1999. Measurement of Vehicle Head Restraint Geometry, in: SAE Technical Papers. SAE, Detroit, Michigan, p. 5. Geoffrey, S. P., 1961. A 2-D Mannikin - The inside story X-rays used to determine
a new standard for a basic design tool, in: SAE Technical Papers. https://doi.org/ 10.4271/610175 Gordon, C. C., Churchill, T., Clauser, C. E., Mcconville, J. T., Tebbetts, I., Walker, R. A., 1989. 1988 Anthropometric Survey of U. S. Army Personnel : Methods and Summary Statistics, Natick/TR-89/044. Gordon, C. C., Churchill, T., Clauser, C. E., Mcconville, J. T., Tebbetts, I., Walker,
R. A., 1988. 1988 Anthropometric Survey of U. S. Army Personnel : Methods and Summary Statistics. Security 640. Hey, H. W. D., Wong, C. G., Lau, E. T. C., Tan, K. A., Lau, L. L., Liu, K. P. G., Wong, H. K., 2017. Differences in erect sitting and natural sitting spinal alignment— insights into a new paradigm and implications in deformity correction. Spine J. 17, 183–189. https://doi.org/10.1016/j.spinee.2016.08.026 Jonsson, B., Svensson, M. Y., Linder, A., Björnstig, U., 2008. BioRID II manikin and
human seating position in relation to car head restraint. Int. J. Crashworthiness 13, 479–485. https://doi.org/10.1080/13588260802120926 Lasdon, L. S., Waren, A. D., Jain, A., Ratner, M., 1978. Design and Testing of a Generalized Reduced Gradient Code for Nonlinear Programming. ACM Trans. Math. Softw. 4, 34–50. https://doi.org/10.1145/355769.355773 Linder, A., Svensson, M. Y., 2019. Road safety: the average male as a norm in vehicle
occupant crash safety assessment. Interdiscip. Sci. Rev. 44, 140–153. https://doi. org/10.1080/03080188.2019.1603870 Milne, J. S., Lauder, I. L., 1974. Age effect in kyphosis and lordosis in adults. Ann.
Hum. Biol. 1 (3), 327–337. NHTSA, 2018. Federal Motor Vehicle Safety Standards. Natl. Highw. Traffic Saf.
Adm. 6, 297–1143. Nishida, N., Izumiyama, T., Asahi, R., Iwanaga, H., Yamagata, H., Mihara, A., Nakashima, D., Imajo, Y., Suzuki, H., Funaba, M., Sugimoto, S., Fukushima, M., Sakai, T., 2020. Changes in the global spine alignment in the sitting position in an automobile. Spine J. 20, 614–620. https://doi.org/10.1016/j.spinee.2019.11.016 Park, J., Ebert, S. M., Reed, M. P., Hallman, J. J., 2016. Statistical Models for Predi-
cting Automobile Driving Postures for Men and Women Including Effects of Age. Hum. Factors 58, 261–278. https://doi.org/10.1177/0018720815610249 Reynolds, H., Paul, G., 2018. Systems anthropometry of digital human models for seat design. Adv. Intell. Syst. Comput. 602, 184–195. https://doi.org/10.1007/ 978-3-319-60825-9_21
80 Reynolds and Scataglini
Reynolds, H. M., Brodeur, R. R., Aljundi, S., 2001. ERL, a CAD-based model of human occupants, in: SAE Technical Papers. https://doi.org/10.4271/2001-01- 0393 Reynolds, H. M., Snow, C. C., Young, J. W., 1982. Spatial Geometry of the Human
Pelvis. Civil Aeromedical Institute, Federal Aviation Admiinistration, FAA-AM- 82-9, Washington, D. C. Reynolds, H. M., Wehrle, J., 2012. Validation of virtual driver model for design of automotive seating packages. SAE Tech. Pap. https://doi.org/10.4271/2012-01- 0450 Reynolds, M., Scataglini, S., 2022. Driver Comfort Gender Inequality Measured with
DHMs. Digit. Hum. Model. Appl. Optim. 46, 128–140. https://doi.org/10.54941/ ahfe1001909 SAE International Surface Vehicle Recommended Practice, 2009. Motor Vehicle Dimensions. SAE Stand. J1100. Sato, F., 2019. Does Spinal Alignment Influence Car Occupant Responses? Sato, F., Brolin, K., Svensson, M., Linder, A., 2020. Towards occupant protections
for both men and women. Adv. Intell. Syst. Comput. 975, 603–615. https://doi.or g/10.1007/978-3-030-20216-3_56 Sato, F., Miyazaki, Y., Morikawa, S., Ferreiro Perez, A., Schick, S., Brolin, K., Svensson, M., 2021. The Effect of Seat Back Inclination on Spinal Alignment in Automotive Seating Postures. Front. Bioeng. Biotechnol. 9, 1–17. https://doi.org/ 10.3389/fbioe.2021.684043 Siefert, A., Hofmann, J., 2019. CASIMIR–a human body model for the analysis
of seat vibrations, in: Scataglini, S., Paul, G. (Eds.), DHM and Posturography. Elsevier Inc., pp. 105–114. Wang, X., Bulle, J., 2017. Identifying the factors affecting automotive driving posture and their perceived importance for seat and steering wheel adjustment. Adv. Intell. Syst. Comput. 481, 35–44. https://doi.org/10.1007/978-3-319-41627-4_4.
LISTED IN THE AHFE DIGITAL BOOKSTORE CATALOGUE
Explore the complete digital volume
Digital Human Modeling and Applied Optimization
Read this individual research paper free through the original publisher, or explore the full digital proceedings book.
ISBN 978-1-958651-52-0
Explore this ISBN in the AHFE Bookstore ↗Listed in the July 2026 bookstore catalogue; search by ISBN to confirm current availability · Digital book purchase optional