Mac Reynolds, Sofia Scataglini (2022). Driver Comfort and Gender Inequality Measured with DHMs. In: Digital Human Modeling and Applied Optimization. AHFE Open Access, vol. 46, pp. 128–140. https://doi.org/10.54941/ahfe1001909
Comfort is a subjective measure of how well motor vehicles accommodate the population. With Digital Human Models (DHMs) as drivers, comfort can be objectively evaluated on a 10-point scale with dimensions that measure accommodation of body size and back posture in seat support, controls reach, and lines of sight. In this study, the authors describe how comfort is measured with DHMs in production vehicles. The analysis of 42 vehicles reveals comfort scores by body size are unequal for small females (7.0) and large males (8.25) when compared to the medium-sized males (8.95). DHMs also reveal comfort varies with back posture. Given sexual dimorphism in body size, females are not as well accommodated in motor vehicle interiors as larger males, and seat design contributes to this inequality in the effects of cushion length on pedal reach and head restraint position on eye position for driving.
Driving is a seated task, and seating comfort measures how well the seat supports a driver’s preferred position to perform the task. Driving tasks are defined by reach to pedals and steering wheel, and vision (i.e. mirror, road and instrument panel). Drivers find preferred positions for their body size and posture. Vehicles vary in task geometries, and drivers optimize their positi- ons for the task. Comfort is a measure of success (Hertzberg, 1972) felt by drivers in their solutions for comfortable joint angles (Peng et al., 2017; Sch- midt et al., 2014), pressure distribution (Andreoni et al., 2002), seat and vehicle controls positions (Reed et al., 2000), and microclimate (Diebsch- lag et al., 1988). All of these parameters share a settled posture in the seat (Kohara and Sugi, 1972) which represents the effects of seat support for the driver’s body weight. At the beginning of vehicle design, the Society of Engineer’s H-point machine represents a settled posture in Design Position (SAE J826 Jun 92, 1993). Seats are designed to support the H-point machine and real drivers with iterative prototypes for comfort (Kolich, 2008). The only postural requirement in seat back design is for the head restraint to be
Driver Comfort Gender Inequality Measured with DHMs 129
within 55mm setback of the back of head of the H-point machine. A set- tled posture is defined in the ERL model where body weight is distributed in the seat at four anatomical landmarks: thigh center of gravity, ischial tube- rosity, 4th lumbar vertebra and 8th thoracic vertebra. Material properties of the seat are used as input to the ERL software to calculate the position of DHMs in the seat to operate controls and see the road and instrument panel. Drivers use back postures for adaptations to the ergonomic require- ments of the driving task (Brodeur et al., 1995a). In an Italian seating study, 3 postural strategies that describe erect, neutral and slumped back postures were identified with pressure mats recording seatback support and contact in an automotive seat (Andreoni et al.2002). Comfort has been defined as the absence of discomfort (Hertzberg, 1972) and an important factor in static sitting comfort is a settled posture in the seat (Kohara and Sugi, 1972). Paul (2019) in an extensive review of comfort points out that DHMs are needed in objectively assessing occupant comfort because the subjective responses of living subjects to prototype and production seating takes too much time and is unreliable. In contrast, the concept of comfort versus discomfort has been investigated by Diels et al. (Erol et al., 2014) and found that appea- rance has a significant impact on subjective evaluation of seating comfort. The role of a subjective, personal response cannot be replicated by DHMs which, without AI, do not have the capacity to evaluate subjective opinions of appearance. Automotive design processes, however, do not include the seat until the Tier 1 Supplier is involved and DHMs do not typically sit in a physical representation of the seat to measure settled postures in driving positions. The absence of a demonstrable relationship between a “settled” posture in the seat and the position required to operate the vehicle leaves the manufacturer’s design without any functional definition of design comfort. So, it is necessary to define an algorithm that can help to define the prese- nce or absence of discomfort by studying optimal fit of seat and package for driver size and posture based on Digital Human Modelling (DHM). This paper presents a methodology of calculating comfort in vehicles from the analysis of 42 vehicles (Reynolds, Brodeur and Aljundi, 2001) with ERL DHM tool.
METHODS
DHMs as Drivers Nine DHMs and the H-point machine (SAE J826 Jun92, 1993) were used to evaluate seated driver positions in all 42 vehicles. The three-dimensional shape of each DHM has the deflected shape of a driver’s body when sitting in a trimmed seat under the force of body weight supported in the cush- ion and back (Brodeur and Reynolds, 2001). The arm and leg link lengths (Dempster, Sherr and Priest, 1964; Gordon et al., 1989), torso posture, and body size (Snyder, Chaffin and Schutz, 1972; Reynolds, 1994; Brodeur et al., 1995a) represent adult human drivers. Each DHM represents a proportion of the total population according to anthropometry and back posture. The proportions in Table 1 for the distribution of postures were estimated for the
130 Reynolds and Scataglini
Table 1. Proportional distribution of erect (E), neutral (N), and slumped (S) back postures and body size in driving populations (Pop.).
Table available in the original PDF paper.
E N S Postural Sums Pop.
SF .30 .60 .10 1.00 .10 MM .15 .70 .15 1.00 .80 LM .05 .65 .30 1.00 .10
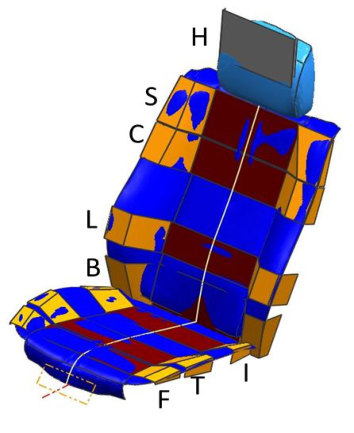
Figure 1: Three patches (seat insert and wings) on cushion (Ischial, Thigh CG, and Front of Thigh) and 4 patches on seat back (Biteline, Lumbar, Chest and Shoulder) with a patch for the head restraint.
population from measurements of back posture (Milne and Lauder, 1974; Brodeur et al., 1995b). The population estimates come from anthropometric statistics.
Seat Model in ERL The trimmed surface of the seat is defined by 3 patches on the cushion and 5 patches on the seat back (Figure 1). The patches represent the zero position for displacement of trimmed seat insert that supports body weight and con- tacts the driver. Each patch uses 5 planes to define the trimmed seat insert, 2 wings, and 2 top of wings. The DHM penetrates the wings as a measure of pressure felt by the driver. DHM positions are calculated for support of body weight to reach controls and see the road (Reynolds, Brodeur and Wehrle, 2006; Reynolds, 2019). Body weight is supported in the cushion under the pelvis (I) and thigh center of gravity (T) and in the seat back behind the chest (C) and lumbar (L). Contact, as measured by offset or penetration of patches in the seat, is at the front of thigh (F), biteline (B), shoulder (S), and head restraint (H) patches. All patches but the head restraint have wings which
Driver Comfort Gender Inequality Measured with DHMs 131
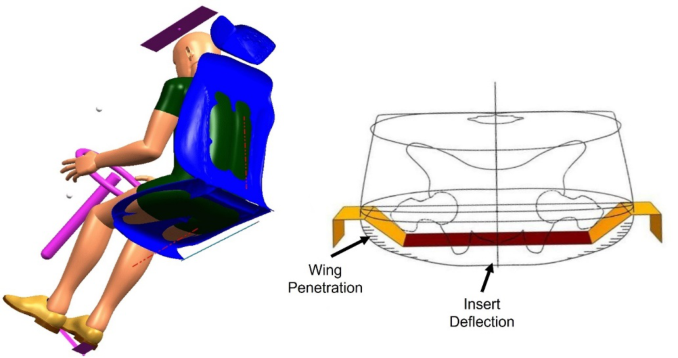
Figure 2: DHM deflection and penetration of seat sitting in position to drive the vehicle.
DHM positions in the seat may contact, i.e. have an offset, or penetrate as measured in the results.
Positions of anatomical landmarks on support patches are optimized to be within ±2 mm of the undeflected position of seat patch from body weight (Brodeur, Cui and Reynolds, 1996). Contact boundaries are defined for each patch. Figure 2 illustrates a DHM sitting in a deflected seat position with the ischial cross section on the ischial patch for seat insert deflection and wing penetration.
Comfort Scoring The ERL Comfort Score algorithm uses the solutions for each of the ERL DHMs, calculates a score from dimensions in the solution and summarizes for a total ERL Comfort Score for the population. Using these data defines a Comfort Score that is physiologically based for the population. That is, a driver’s subjective evaluation of comfort is based upon physiological input in response to forces such as stress on joints at their limits, pressure on tissues in the seat, and capability to reach and see what is needed to drive the vehicle. Joint angles are considered most comfortable in their mid-range since stress on ligament and muscles is similar for all positions. Likewise, force is genera- ted from the reaction of the seat to body weight which is supported in some regions of the seat and only contacted in other regions. Thus, the maximum deflection of the seat under the pelvis establishes the maximum penetration of the seat in regions that contact the seat. As a result of this model that depends upon adaptations to seat and control positions drivers make for driving, the digital human models are based on measurements of anatomical landmarks in a range of sitting postures and deflected tissue shapes in a foam seat. The ERL Comfort Score is based upon the same geometric input for each DHM that varies with body size and back sitting posture. For example, the height of the 8th thoracic vertebrae varies with body size and back posture, but the 8th thoracic vertebra is used for all occupants to define the chest patch in the
132 Reynolds and Scataglini
seat surface. Therefore, the large male is evaluated by equivalent anatomical criteria as the medium male and small female. This comparability is available only with anatomical landmarks that establish seating positions and interior accommodations for each occupant.
The ERL Comfort Score is a composite of measurements from four domains:
1. Joint Angle 2. Seat Cushion 3. Seat Back 4. Controls Packaging With Digital Human Models (DHMs) as drivers, comfort can be obje- ctively measured on a 10-point scale with 7 dimensions in the cushion, 13 dimensions in the seatback, and 6 dimensions in the package. The ERL Com- fort Score is based on results of optimizing positions of DHMs in driving positions with penalties assessed on the seat and package scores for joint angle violations. The score for each DHM is first determined and then weigh- ted by their proportional representation of the population. Seats and seating packages in vehicles are designed to accommodate the population, and the simulation must represent variation in the population.
The optimization of DHM positions (Reynolds and Wehrle, 2012) finds comparable positions for all drivers (Reynolds, 2019) since they are sup- ported at the same landmarks in the seatback and cushion. Each DHM is independently measured with dimensions that represent the interface betw- een body, seat cushion, back and vehicle package. Comfort dimensions are bimodal from “too much” to “too little,” and “just right” is typically a mid- point of a range as defined for the seat cushion, seat back, vehicle packaging, and penalties for joint angle (Tables 2-5). The score is based on a −2 to +2 scale, mapped to a 10.0 scale (1 to 10).
Seven cushion dimensions are summarized in 4 categories (Table 2). Ideal contact length is measured from buttocks contact to a point 75% of distance from thigh center of gravity to calf contact with nose of seat. Thigh support (T in Figure 1) is measured from support of thigh in seat insert and contact at the front of thigh patch (F in Figure 1). Ischial (WI) and Thigh (WT) wings are just right when penetrating the trimmed surface with 0.5 to 0.8 propor- tion of ischial patch deflection. The front of thigh wing (WF) is acceptable with ±20mm contact. Stiffness uses the statistics of seating properties in 38 vehicles to define an acceptable range.
Table 2. Categories used to measure 7 cushion comfort dimensions of patches in
Table available in the original PDF paper.
Figure 2.
Figure available in the original PDF paper.
Cushion Just Right Length (CL) Actual Contact Length >= 0.93 Ideal Length Thigh Support (TS) −2.1 <= T <= + 2.1 and −10 <= F <= 15 Wing Contact (WC) −0.5 <= (−∥WI∥−∥WT∥−∥WF∥)/3 <0.5 Stiffness (CS) Displacement within ±0.3 SD in 38 vehicles
Driver Comfort Gender Inequality Measured with DHMs 133
Table 3. Categories used to measure 13 seatback comfort dimensions of patches in
Table available in the original PDF paper.
Figure 2.
Figure available in the original PDF paper.
Back Just Right Head Restraint (HR) 20 mm> Backset <50 mm Height (BH) ±3% of T6 contact for E and N, & T8 for S Back Support (BS) −0.5 <= (−∥H∥−∥S∥−∥C∥−∥L∥−∥B∥)/5 <=0.0 Lumbar Support (LS) L4 = ±2 mm Lumbar Patch Deflection Wing Contact (WC) −0.5 <= (−∥WS∥−∥WC∥−∥WL∥−∥WB∥)/4 <0.5 Stiffness (SS) L displacement within ±0.3 SD in 38 vehicles
Table 4. Six dimensions used to measure controls packaging comfort.
Table available in the original PDF paper.
Package Just Right Pedal Reach (F) Heel Reference Point X <= 50 Fore/Aft Travel (T) (Max – 5 mm) – (Min +5 mm) > F/A Travel Headliner (L) Headliner Z – Tot of Head Z >= 25 mm Steering Wheel to Thigh (ST) Steering Wheel Rim to Thigh >= 30 mm Steering Wheel to Chest SC) Steering Wheel to Chest >= 250 mm Eye Location (E) −25 mm <= (Upper Z – Eye Z) <= 100 mm
Table 5. Dimensions used to calculate comfort penalties from joint angles.
Table available in the original PDF paper.
Equation reproduced from the original PDF.
The cushion comfort score for an occupant (OC) is calculated as follows: OC = (∥L∥1.25 + ∥S∥1.5 + ∥C∥1.5 + ∥D∥0.75)/4 (1)
Equation reproduced from the original PDF.
The seatback includes categories for comfort and safety (Table 3). Head restraint contact must comply with FMVSS 202a (NHTSA, 2018). Seat back height compares 6th thoracic vertebra in Erect and Neutral posture and 8th thoracic vertebrae in Slumped posture to seat height contact. Seat back sup- port evaluates contact patches (H, S, and B) with values unique to posture. Support patches, Chest (C) and Lumbar (L), must be within ±2 mm of the body landmark on the undeflected patch. When there is no lumbar adju- stment, L4 landmark in erect postures must be within 5-10 mm of the lumbar patch. Wing contact measures shoulder within 15–50mm, the chest wing has −20 mm penetration to 35mm clearance, and the lumbar has −20 mm
134 Reynolds and Scataglini
penetration to 25mm clearance. The biteline wings are just right with −15 penetration to 50mm clearance. Stiffness of seat back is evaluated at the lumbar patch (L in Figure 1).
The Seatback score for an occupant (OB) is calculated as follows:
OB = (∥HR∥+ ∥BH∥0.25 + ∥BS∥1.5 + ∥LS∥0.25 + ∥WC∥1.5 + ∥SS∥0.5)/6 (3) and Seatback (BS) is mapped to the 10-point scale as follows:
BS = (4 ∗(2 −OB)/2 + 1) ∗2 (4) Six dimensions in packaging define comfort (Table 4). Pedal reach is just right when the DHM’s heel is within 0–50 mm of Heel Reference Point (HRP) in the X axis. Fore/aft travel is measured at most forward and aft positions. Headliner is measured to the top of head. Steering wheel to thigh is measured from rim to thigh, and Steering wheel to chest is measured from steering wheel center to chest of DHM. Eye location is the relative height of the eye to the inside rearview mirror.
The package score for an occupant (OP) is calculated as follows:
OP = (2∗∥T∥+ 1.5∗∥L∥+ 0.5∗∥E∥+ 0.25∗∥SC∥+ 0.25∗∥ST∥+ 2∗∥F∥)6 (5) and the Package score (PS) is mapped to the 10-point scale as follows:
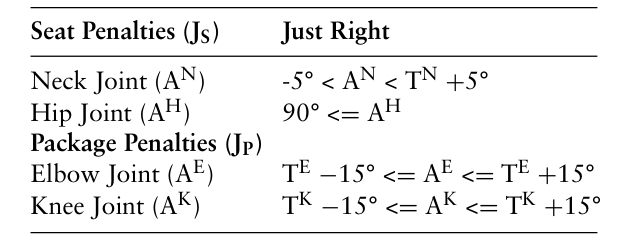
PS = (4 ∗(2 −OP)/2 + 1) ∗2 (6) The seat (JS) is penalized (Table 5) for uncomfortable neck and hip joint angles, and the package (JP) is penalized for uncomfortable elbow and knee joint angles as defined by a range about the targeted comfortable angle (T).
The maximum penalty (P) of 25% is scaled from 0 which is just right. The joint angle penalties are calculated as follows: JS = (1 −∥AN∥P/2)(1 −∥AH∥P/2) (7)
and
JP = (1 −∥AE∥P/2)(1 −∥AK∥P/2) (8) The occupant seat score (S O) is the average of CS and BS, and the seat score (S) is calculated as
Equation reproduced from the original PDF.
and the package score is calculated as
Equation reproduced from the original PDF.
Driver Comfort Gender Inequality Measured with DHMs 135
Table 6. Comfort average (10 pt. scale) and standard deviation in 22 cars and 20 UVs for DHMs.
Table available in the original PDF paper.
Vehicle Car UVs Car UV Statistics Ave Ave SF E 6.4 ±0.8 6.0 ±0.8 7.0 7.0 N 7.2 ±0.9 7.4 ±0.4 S 7.8 ±0.5 7.7 ±0.4 MM E 8.5 ±0.7 8.5 ±0.6 8.9 9.0 N 9.0 ±0.7 9.1 ±0.4 S 9.1 ±0.5 9.0 ±0.4 LM E 7.5 ±0.8 7.3 ±0.5 8.4 8.1 N 8.5 ±0.5 8.3 ±0.5 S 8.3 ±0.7 7.7 ±0.7 Population 8.7 ±0.6 8.7 ±0.3
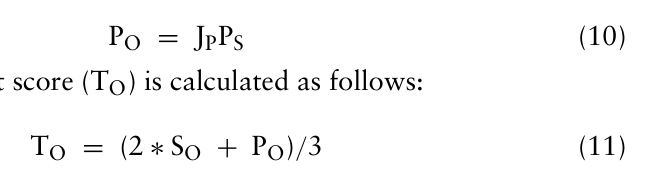
and the Total ERL Score (ERLT) is calculated as
Equation reproduced from the original PDF.
RESULTS
The average comfort score in Cars and UVs for each DHM is in Table 6. The population row reports the average weighted by back posture distribution (see Table 1) of vehicle comfort scores in this study. Comfort scores by body size, however, shows small females least comfortable with much smaller dif- ference between large males and medium males who are most comfortable. Similarly, comfort scores by body posture shows erect in all body sizes least comfortable with neutral and slumped postures most comfortable.
The proportion of “Just Right”cushions for body size and back posture are reported in Table 7. The weighted averages (Ave.) in Tables 7-9 are calculated to represent the population as defined in Table 1 for the ERL DHM sam- ple. Differences between cars and UVs are small, but body size and posture demonstrate sources of discomfort experienced by drivers.
In Cars and UVs, cushion length was too long for small females and too short for large males. The cushion was too short in 1 car for an erect small female and 2 cars for slumped medium males, but 1 UV had a cushion too long for an erect medium male and 8 UVs had cushions too short. In all vehicles, thigh support creates too much pressure in small females and too little in large males, and ischial wing contact is too little for small females and too aggressive for large males with thigh and front of thigh wings varying equally around just right. Table 8 provides the proportion of “just right” seatbacks. The greatest difference between Cars and UVs is found in stiffness where fewer UVs were satisfactory.
In seatbacks, the head restraint and overall seat back support create the greatest amount of discomfort. Shoulder and biteline patches are sites of the greatest discomfort for support while chest and lumbar provide the most
136 Reynolds and Scataglini
Table 7. Proportion Just Right in Cushions for DHMs of Cars and UVs for comfort score dimensions.
Table available in the original PDF paper.
CL TS WC CS SF Car E 0.14 0.45 0.36 0.41 N 0.41 0.55 0.09 0.32 S 0.64 0.55 0.14 0.41 UV E 0.15 0.40 0.30 0.35 N 0.60 0.55 0.05 0.45 S 0.85 0.50 0.05 0.50 MM Car E 0.95 0.82 0.32 0.32 N 1.00 0.73 0.32 0.45 S 0.91 0.73 0.36 0.45 UV E 0.85 0.90 0.35 0.35 N 0.85 1.00 0.30 0.50 S 0.85 0.95 0.15 0.40 LM Car E 0.32 0.68 0.41 0.32 N 0.36 0.68 0.27 0.32 S 0.36 0.64 0.09 0.32 UV E 0.15 0.45 0.30 0.30 N 0.40 0.55 0.35 0.40 S 0.15 0.60 0.25 0.45
Table 8. Proportion Just Right in Seatbacks for DHMs of Cars and UVs for comfort score dimensions.
Table available in the original PDF paper.
HR BH BS LS WC SS SF Car E 0.14 0.18 0.00 0.50 0.50 0.18 N 0.14 0.14 0.00 1.00 0.45 0.41 S 0.14 0.41 0.14 1.00 0.32 0.59 UV E 0.05 0.00 0.00 0.75 0.45 0.10 N 0.05 0.40 0.00 0.55 0.35 0.40 S 0.15 0.55 0.10 0.30 0.15 0.50 MM Car E 0.23 0.09 0.00 0.50 0.27 0.77 N 0.36 0.73 0.27 1.00 0.41 0.73 S 0.45 0.73 0.14 1.00 0.77 0.55 UV E 0.40 0.20 0.10 0.95 0.45 0.60 N 0.45 0.45 0.15 1.00 0.50 0.45 S 0.25 0.80 0.05 1.00 0.65 0.45 LM Car E 0.41 0.14 0.00 0.45 0.41 0.45 N 0.50 0.73 0.18 1.00 0.41 0.59 S 0.18 0.86 0.09 0.95 0.27 0.64 UV E 0.40 0.10 0.00 1.00 0.40 0.20 N 0.50 0.80 0.15 0.80 0.45 0.45 S 0.20 0.85 0.00 35.00 0.20 0.45
comfortable support in both cars and UVs. The height of seatback is typically too low for the erect postures in small females and large males, and the neutral posture in the small female is not frequently satisfied with seatback height. Table 9 reports the proportion of Just Right vehicles for packaging variables.
Driver Comfort Gender Inequality Measured with DHMs 137
Table 9. Proportion Just Right in Package for DHMs in Cars and UVs for comfort score dimensions.
Table available in the original PDF paper.
F T HL ST SC E SF Car E 0.14 0.18 0.00 0.50 0.50 0.18 N 0.14 0.14 0.00 1.00 0.45 0.41 S 0.14 0.41 0.14 1.00 0.32 0.59 UV E 0.05 0.00 0.00 0.75 0.45 0.10 N 0.05 0.40 0.00 0.55 0.35 0.40 S 0.15 0.55 0.10 0.30 0.15 0.50 MM Car E 0.23 0.09 0.00 0.50 0.27 0.77 N 0.36 0.73 0.27 1.00 0.41 0.73 S 0.45 0.73 0.14 1.00 0.77 0.55 UV E 0.40 0.20 0.10 0.95 0.45 0.60 N 0.45 0.45 0.15 1.00 0.50 0.45 S 0.25 0.80 0.05 1.00 0.65 0.45 LM Car E 0.41 0.14 0.00 0.45 0.41 0.45 N 0.50 0.73 0.18 1.00 0.41 0.59 S 0.18 0.86 0.09 0.95 0.27 0.64 UV E 0.40 0.10 0.00 1.00 0.40 0.20 N 0.50 0.80 0.15 0.80 0.45 0.45 S 0.20 0.85 0.00 35.00 0.20 0.45
Table 10. Average Joint Angle Penalties for Seat and Package design in Cars and UVs.
Table available in the original PDF paper.
Seat Penalty % Package Penalty % SF Car E 19.80 3.40 N 14.70 2.30 S 10.20 1.10 UV E 18.80 9.90 N 6.30 6.10 S 5.00 4.80 MM Car E 1.70 0.60 N 0.60 0.00 S 0.00 0.00 UV E 1.90 1.90 N 0.00 1.30 S 0.00 1.90 LM Car E 7.90 0.60 N 2.30 0.00 S 1.10 1.10 UV E 3.70 1.90 N 0.00 1.90 S 1.30 1.30
Discomfort in Car and UV packaging variables arises in reach to the pedal and seat fore/aft travel. Small females must extend knee joints to reach the accelerator, and large males do not have sufficient rearward travel of the seat. Packaging in UVs does not affect comfort as much as the seat. Seat penalties
138 Reynolds and Scataglini
(Table 10) are based upon hip and neck joints. Package penalties are based upon elbow and knee joints. Penalties for joint angle adaptations from seat design to operate the vehicle reflect the challenge of designing vehicles for the extreme body sizes.
The small female makes joint angle changes which create a closed, cramped body position, and the effect of head restraint design is the primary source of seat penalties. The large male must reach for the steering wheel and pedal, but this discomfort primarily affects the Erect large male.
DISCUSSION
The traditional A to B comparison of subjective scores used to develop opti- mal comfort in automotive seats (Kolich, 2008) can be standardized with a DHM sample that includes boundary conditions of anthropometric sizes and back postures observed in the drivers. With DHMs, the effects of seat shape on support and contact can be defined. As observed in the literature, cushion length (Kolich, 2003) and head restraint (Park et al., 2018) are two major design parameters for comfort and safety. The basic problem arises first in design and research protocols for investigations of posture and head restraint recognize the continuation of the problem (Park et al., 2018). Extreme body sizes experience greater discomfort than medium, but the small female and large male are not equidistant from the medium male in comfort dimensi- ons. Small females are 78% and large males are 92% as comfortable as the medium male. Comfort studies consider 7.5 as a minimum acceptable score but the averages in Table 4 show that the small erect and neutral women have averages of 6.4, 6.0 and 7.2, 7.4 respectively in Cars and UVs. These two back postures represent 90% of the small female postures (Table 1). Since 97% of women have sitting heights shorter than the average erect medium male (Gordon et al., 1989), this variation also applies to many women who will have less seating comfort than the medium man. Seat design for safety and ergonomics are created in the automotive industry for a standardized posture (SAE J826 Jun92, 1993). However, like body size, there are boundary con- ditions that describe a range of postures used by drivers. Variation in back posture arises from seated task adaptations (Reynolds, 2017) and anatomi- cal variation in musculo-skeletal structures (Milne & Lauder, 1974; Brodeur, Reynolds, 1996). Small drivers, primarily women, sit upright and use erect postures for good vision. When seat design is changed to provide space for the buttocks in the seat back, drivers sit more upright because of personal preference. Then, there are people who simply have anatomical structures in their spine, skeletal and soft tissue, that create back shapes that are not con- sistent with a standardized posture whether this is a slumped posture from disease like osteoporosis or natural variation that creates a lordotic lumbar spine. This variation, however, is represented in digital human body models developed for safety (Schoell et al., 2015) but not in those used for ergonomic and seating comfort. Choi, et al (2007) established a standardized posture to represent the 5th, 50th and 95th percentile manikins they developed for PAM COMFORT design and evaluation of seating.
Driver Comfort Gender Inequality Measured with DHMs 139
CONCLUSION
Comfort varies with body size, back posture, and gender. The absence of a demonstrable relationship between a “settled” posture in the seat and the position required to operate the vehicle leaves the manufacturer’s design without any functional definition of seating comfort. Thus, the manufactu- rer typically awaits the voice of the consumer after the vehicle is built to determine the presence or absence of discomfort.
REFERENCES
Andreoni, G. et al. (2002) ‘Method for the analysis of posture and interface pressure of car drivers’, Applied Ergonomics, 33(6), pp. 511–522. doi: 10.1016/S0003- 6870(02)00069-8. Brodeur, R. et al. (1995a) The Initial Position and Postural Attitudes of Driver
Occupants , Posture, ERL-TR-95-009. doi: 10.4271/2001-01-2106. Brodeur, R. et al. (1995b) The Initial Position and Postural Attitudes of Driver Occupants , Posture, ERL-TR-95-009. Lansing, Michigan. doi: https://doi.org/10. 4271/2001-01-2106. Brodeur, R. R., Cui, Y. and Reynolds, H. M. (1996) ‘Locating the pelvis in the seated
automobile driver’, in SAE Technical Papers. doi: 10.4271/960481. Brodeur, R. R. and Reynolds, H. M. (2001) ‘Digital definition of the deflected shape of the human body in seated postures for ergonomic design in CAD models’, in SAE Technical Papers. doi: 10.4271/2001-01-2106. Dempster, W. T., Sherr, L. A. and Priest, J. G. (1964) ‘Conversion Scales for Estimating
Humeral and Femoral Lengths and the Lengths of FUnctional SEgments in the Limbs of Caucasoid Males’, Human Biology, 36(3), pp. 246–262. Diebschlag, W. et al. (1988) ‘Recommendation for ergonomic and climatic physiological vehicle seat design’, in Society of Automotive Engineers. Erol, T. et al. (2014) ‘Effects of Appearance on the Perceived Comfort of Automo-
tive Seats’, Proceedings of the 5th International Conference on Applied Human Factors and Ergonomics AHFE 2014, Kraków, Poland 19-23 July 2014, (July), pp. 3211–3217. doi: 10.13140/RG.2.1.1424.1122. Gordon, C. C. et al. (1989) 1988 Anthropometric Survey of U . S . Army Personnel : Methods and Summary Statistics, Natick/TR-89/044. Hertzberg, H. (1972) ‘The Human Buttocks in Sitting: Pressures, Patterns, and
Palliatives’, SAE Transactions, 81-A, p. 9. doi: https://doi.org/10.4271/720005. Kohara, J. and Sugi, T. (1972) ‘Development of biomechanical manikins for measuring seat comfort’, in SAE Technical Papers. doi: 10.4271/720006. Kolich, M. (2003) ‘Automobile seat comfort: Occupant preferences vs. anth-
ropometric accommodation’, Applied Ergonomics, 34(2), pp. 177–184. doi: 10.1016/S0003-6870(02)00142-4. Kolich, M. (2008) ‘A conceptual framework proposed to formalize the scientific investigation of automobile seat comfort’, Applied Ergonomics, 39(1), pp. 15–27. doi: 10.1016/j.apergo.2007.01.003. Milne, J. S. and Lauder, I. L. (1974) ‘Age effect in kyphosis and lordosis in adults’,
Annals of Human Biology, 1 (3), pp. 327–337. NHTSA (2018) ‘Federal Motor Vehicle Safety Standards’, National Highway Traffic Safety Administration, 6, pp. 297–1143. Available at: https://www.govinfo.gov/ content/pkg/CFR-2018-title49-vol6/pdf/CFR-2018-title49-vol6.pdf.
140 Reynolds and Scataglini
Park, J. et al. (2018) ‘Driver head locations: Considerations for head restraint design’, Traffic Injury Prevention, 19(8), pp. 825–831. doi: 10.1080/15389588.2018.1524889. Paul, G. (2019) Occupant comfort, DHM and Posturography. Elsevier Inc.
doi: 10.1016/B978-0-12-816713-7. 00034–9. Peng, J., Wang, X. and Denninger, L. (2017) ‘Ranges of the least uncomfortable joint angles for assessing automotive driving posture’, Applied Ergonomics, 61, pp. 12–21. doi: 10.1016/j.apergo.2016.12.021. Reed, M. P. et al. (2000) ‘Effects of vehicle interior geometry and anthropometric
variables on automobile driving posture’, Human Factors, 42(4), pp. 541–552. doi: 10.1518/001872000779698006. Reynolds, H. M. (1994) Erect, Neutral and Slump Sitting Postures: A study of the torso linkage system from shoulder to hip joint. Available at: https://apps.dtic.mi l/sti/citations/ADA293239. Reynolds, H. M., Brodeur, R. R. and Aljundi, S. (2001) ‘ERL, a CAD-based model
of human occupants’, in SAE Technical Papers. doi: 10.4271/2001-01-0393. Reynolds, H. M., Brodeur, R. and Wehrle, J. H. (2006) ‘Erl seat design - Occupied specifications for the unoccupied deliverable seat’, in SAE Technical Papers. doi: 10.4271/2006-01-2336. Reynolds, H. M. and Wehrle, J. (2012a) ‘Validation of virtual driver model for design
of automotive seating packages’, SAE Technical Papers. doi: 10.4271/2012-01- 0450. Reynolds, H. M. and Wehrle, J. (2012b) ‘Validation of virtual driver model for design of automotive seating packages’, SAE Technical Papers, (4), pp. 1–17. doi: 10.4271/2012-01-0450. Reynolds, M. (2012) ‘Sitting posture in design position of automotive inte-
riors’, International Journal of Human Factors Modelling and Simulation. doi: 10.1504/ijhfms.2012.051554. Reynolds, M. (2019) ‘ERL seat design and digital human models’, in DHM and Posturography. doi: 10.1016/B978-0-12-816713-7.00012-X. SAE J826 Jun92 (1993) ‘Devices for use in defining and measuring vehicle seating
accomodation’, in SAE Vehicle Occupant Restraint Systems and Components Standards Manual. Schmidt, S. et al. (2014) ‘A literature review on optimum and preferred joint angles inautomotive sitting posture’, Applied Ergonomics, 45(2 PB), pp. 247–260. doi: 10.1016/j.apergo.2013.04.009. Schoell, S. L. et al. (2015) ‘Age- and Sex-Specific Thorax Finite Element Model
Development and Simulation’, Traffic Injury Prevention, 16, pp. S57–S65. doi: 10.1080/15389588.2015.1005208. Snyder, R. G., Chaffin, D. B. and Schutz, R. K. (1972) Link System of the Human Torso. Available at: http://deepblue.lib.umich.edu/bitstream/2027.42/ 1402/2/15273.0001.001.pdf.
LISTED IN THE AHFE DIGITAL BOOKSTORE CATALOGUE
Explore the complete digital volume
Digital Human Modeling and Applied Optimization
Read this individual research paper free through the original publisher, or explore the full digital proceedings book.
ISBN 978-1-958651-22-3
Explore this ISBN in the AHFE Bookstore ↗Listed in the July 2026 bookstore catalogue; search by ISBN to confirm current availability · Digital book purchase optional