Hyegjoo Choi-Rokas, Peng Li, K. Blake Mitchell (2023). Development of U.S. Army Tactical Brassiere (ATB) Sizing System. In: Digital Human Modeling and Applied Optimization. AHFE Open Access, vol. 76, pp. 1–10. https://doi.org/10.54941/ahfe1003348
In support of the development of the U.S. Army Tactical Brassiere (ATB), a sports bra for physical training activities, a three-phase study was designed and executed. The first-phase study (Choi-Rokas et al., 2022) investigated the relationship between overall coverage, design features, anthropometric characteristics, and mobility of seven commercial-off-the-shelf (COTS) sports brassieres to document the pros and cons of each design feature. As the results, a single COTS brassiere was ranked as the best out of all assessed sports brassieres, based on breast coverage, reduction of breast movement, and overall participants’ preference. The current study is the second phase of the three-phase study focusing on the development of the sizing system for the ATB. Previous studies and related references (including but not limited to periodicals, video tutorials, manufacturer brassiere sizing charts, websites, and media, etc.) focusing on methodologies to predict brassiere size and/or to develop brassiere sizing systems were reviewed. Communalities between reviewed methods show: 1. Bust Circumference and Underbust Circumference are the two main body dimensions used for developing brassiere sizing systems. 2. The resultant band size is always an even number, in inches, for conventional brassiere sizing system in the U.S. 3. Cup size is determined based on the difference values (delta) between Bust Circumference and Underbust Circumference or between Bust Circumference and brassiere band size. Regardless of the methods to calculate the delta, the brassiere cup size increases by one size as the delta increases every 1-inch. Based on this knowledge, a new method to develop a sizing system was established. In this method, brassiere band sizes are converted from Underbust Circumference values with various adding factors depending on the torso size (i.e., gradually reducing the adding factor from 4-inch, then 0-inch for Underbust Circumference of 34-inch or greater), and brassiere cup sizes are based on the delta between Bust Circumference and Underbust Circumference. Next, the most recent U.S. Army female Soldier anthropometric databases (ANSUR II), which includes both manual and three-dimensional (3D) body shape scans, were reviewed to confirm the availability of two main dimensions, Bust and Underbust Circumferences. Because Underbust Circumference is not available in the original database (ANSUR II), was extracted from the 3D scan. Since dimensions extracted from 3D scans are not identical to their measured counterpart (i.e., Measured Waist Circumference of person A vs. the scan extracted Waist Circumference from person A’s 3D scan), the current study performed additional analyses to minimize those differences. Using the data from ATB phase 1 study, the manual and scan extracted Underbust Circumference measurements were compared, and a simple linear regression analysis was performed to model and predict the manual Underbust Circumference measurements from 3D scan extracted measurements. Then, this model was applied to the Underbust Circumference extracted from ANSUR II 3D database, allowing for the predication of manual Underbust Circumference for each participant. Finally, the established sizing method was applied to U.S. Army databases to develop a brassiere sizing system with 10 different cup sizes and 7 different band sizes. Three band sizes, 32”, 34” and 36” accommodated 92.03% of the target U.S. Army population. A total of seven sister sizes (sizes that share the same cup volumes, i.e., 32D, 34C, 36B, 38A, etc.) were grouped to accommodate over 93% of the target population. Visualization on the results, as well as the topic of fit models are further presented and discussed in this paper.
In support of an US Army Tactical Brassiere (ATB) program, to select sports bra for physical training activities, a three-phase study was designed and executed. The first-phase study (Choi-Rokas et al., 2022) investigated the relationship between overall coverage, design features, anthropometric cha- racteristics, and mobility of six commercial-off-the-shelf (COTS) brassieres to document pros and cons of the design features per COTS. A single brassiere (Configuration D in Choi-Rokas et al., 2022) was ranked as the best sports brassiere out of all assessed brassieres based on the breast coverage, reduction of breast movement during the mobility test, and overall TPs’ preference.
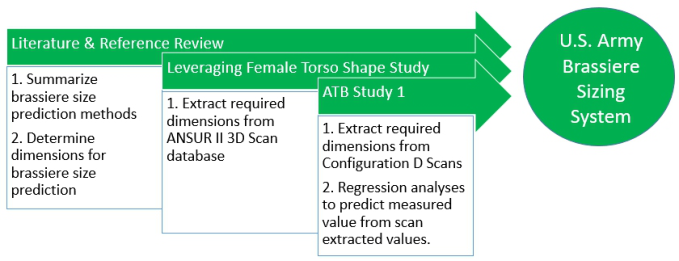
The current study summarized the second phase of the study, intended to develop the US Army sports brassiere sizing system. The flow of the study phase is represented in Figure 1. First, previous studies and related references (including but not limited to periodicals, video tutorials, manu- facturer brassiere sizing charts, websites, and media, etc.) focusing on methodologies to predict brassiere size and/or to develop brassiere sizing systems were reviewed. Because the current study was focused on the US methods and systems, those from outside the US were excluded. Commo- nalities between those methods were documented, combined, and modified
Figure 1: Flow of phase 2 study of ATB program to establish the final method for the study. Then, the critical anthropome- tric dimensions needed to develop a brassiere size system were identified. Next, the most recent US Army female Soldier anthropometric databa- ses, both manual and three-dimensional (3D), were reviewed to confirm the availability on those selected dimensions, and derived dimensions, if needed, to complement the databases. Lastly, the established method was applied to the US Army databases to develop the US Army brassiere sizing system.
REVIEW OF BRASSIERE SIZING SYSTEMS In general, brassiere sizing has two primary components: band size (in the US, this is conventionally an even number, e.g., 32, 34, 36) and cup size (with alphabetical representation, e.g., A, B, C). One interesting feature of brassiere sizing is that the breast volume accommodated by a given cup size changes depending on the band size. It is true that an A cup is always smaller than a B cup, and a B cup is always smaller than a C cup, but only if the band sizes are identical. If the band size changes, but the cup size remains the same, then the breast volume accommodated by that brassiere cup changes. For example, the breast volume captured by a size 34B brassiere is smaller than that of a 36B brassiere. Even though the cup sizes are represented by the same letter, the breast volume accommodated by a given cup size increases as the band size increases.
Typically, the cup size of 34B is identical to 36A (one cup size smal- ler and one band size larger), 32C (one cup size larger and one band size smaller) and 30D (two cup sizes larger and two band sizes smal- ler). A group of brassieres sizes (such as 30D, 32C, 34B, and 36A) whose cup sizes inscribe an identical breast volume, are known as “sister sizes”. The sizing system developed from this study follows the conventional for- mat by representing cup size by alphabet designation and band size in inches.
Development of US Army Tactical Brassiere (ATB) Sizing System 3 Methods for Brassiere Sizing System Development1
Brassiere Band Size Brassiere band is the fundamental support portion of the brassiere. Tight fit of the brassiere band just below the breast is recommended to achieve the maximum breast support from the brassiere. Depending on the manufactu- rer, band size is determined either based on the Underbust Circumference, measured circumference at chest right below the breast, or the Above Bre- ast Circumference, measured circumference above breast at or around the scye. Given that the actual location of the brassiere band on the torso is right below the breast when a brassiere is worn, it was felt that the Under- bust Circumference value was most reasonable to convert into the band size. Hence, methodologies using an Above Breast Circumference measurement were not considered for this study.
The process to convert an Underbust Circumference measurement into a band size varies by manufacturer and involves specific adjustments and rounding up or down (“Bra Size”, n.d.). Some companies suggest adding 5-inches to the Underbust Circumference and then rounding it down to the nearest even number to determine the band size. Other manufacturers sug- gest rounding up or down to the nearest integer, then either adding 1-inch if the integer is an odd number or 2-inches if an even number so that the next largest even number becomes the band size. Recently, instead of adding constant lengths, reducing those adding factors relative to the torso size has also been introduced (i.e., when Underbust Circumference is measured as 34 inches, it is converted to a bra band size 34 without any adding factor). Given that a tight fit of the brassier band is recommended, and the larger Underbust Circumference values heavily depend on soft tissue, which can be easily compressed, it is reasonable not to add additional length for these larger Underbust Circumferences.
Brassiere Cup Size Brassiere cup size represents the volume of the breast. Cup size can be predi- cted based on the difference between Bust and Underbust Circumferences or between Bust Circumference and band size. Many manufacturers recommend computing the band size and then subtracting it from the Bust Circumfere- nce to predict the cup size. If the difference between band size and the Bust Circumference is 0, then the cup size is predicted “A”. Then, as the difference increase by 1-inch, the cup size gets larger by one size (Refer to Table 1).
Table 1. Example of one bra cup size prediction chart (from Wright, M., 2002).
Table available in the original PDF paper.
Delta* −1 0 1 2 3 4 5 Cup Size AA A B C D DD E
*Difference between Bust Circumference and band size
1References connected to specific brand name or manufacturers for this section were not cited to withhold their identity.
One downside of using band size to predict cup size is that a wide range of Underbust Circumferences are binned into a relatively small number of band sizes. Given that the band size is set to be an even number, as much as a 1.99- inch difference in Underbust Circumference (i.e., 28.50” to 30.49”) can be computed into the same band size. If the cup size is then computed from the difference between Bust Circumference and band size, this 1.99-inch range in the Underbust Circumference is ignored. This is problematic, because two people with identical Bust Circumferences within the same bin may have very different breast sizes. For example, a person whose Underbust Circumfere- nce is 28.50” would have larger breasts than a person with an Underbust Circumference of 30.49” with the same Bust Circumference. The same cup and band size is not likely to result in a good fit for both.
In all, three trends were collected from the reference review. For developing the brassiere sizing system, Bust Circumference and Underbust Circum- ference are the two primary dimensions. Conventionally in the US, the resultant band size is always an even number in inches. Cup size increases by one size for every 1-inch difference between either band size or Underbust Circumference and Bust Circumference.
US ARMY BRASSIERE SIZING SYSTEM Anthropometric Dimension: Underbust Circumference
Based on the reviews, Bust Circumference and Underbust Circumference were identified as the key anthropometric and sizing dimensions for brassi- ere sizing system development. Bust Circumference was measured during the 2012 US Army Anthropometric Survey (ANSUR II) as Chest Circumference, and these data are readily available for a large number of Female Soldiers. Underbust Circumference, however, was not measured during ANSUR II. Thus, a female torso shape study (Li & Paquette, 2020) was leveraged to extract the Underbust Circumference from the three-dimensional (3D) scans of female ANSUR II participants.
Dimensions extracted from 3D scans are not identical to their manually measured counterpart (i.e., Measured Waist Circumference of person A vs. the scan extracted Waist Circumference from person A’s 3D scan), and the differences vary depending on the dimensions (Li & Paquette, 2019). Thus, if scan extracted dimensions are used together with traditionally measured dimensions, it is advised to perform additional processes to minimize those differences. One suggested way for the current study to obtain the Under- bust Circumference is through manual methods and scan extracted methods, and to compare those values to investigate whether the differences can be predicted and minimized.
The data and results from the first phase study (Choi-Rokas et al., 2022) were utilized for this purpose. During the study (n = 19), both Bust Circum- ference and Underbust Circumference were manually measured, and all test participants (TPs) were also scanned using the Cyberware 3D WB4 whole body scanner while wearing each COTS brassiere configuration. Out of the COTS items, Configuration D was selected to utilize the data to investigate the difference between manually measured and scan extracted Underbust
Development of US Army Tactical Brassiere (ATB) Sizing System 5
Circumference because the anthropometric dimensions measured in Confi- guration D were the median points out of all 7 configurations for almost all dimensions without extreme values, meaning it was in the middle of the test items for the amount of compression the brassiere applied to the breasts.
A correlation analysis between all measured and scan extracted anth- ropometric dimensions relative to measured Underbust Circumference was conducted. Scan Extracted Underbust Circumference showed the highest cor- relation to manually measured Underbust Circumference, which indicates that Scan Extracted Underbust Circumference would best predict measured Underbust Circumference. When a forward stepwise method was performed, no additional dimension besides Scan Extracted Underbust Circumference statistically significantly increased the explained variance in manually measu- red Underbust Circumference, which indicates that no additional dimensions besides Scan Extracted Underbust Circumference are needed to predict manu- ally measured Underbust Circumference. Thus, the Scan Extracted Underbust Circumferences for all TPs in Configuration D was used as the single input and independent variable to predict manually measured Underbust Circumference.
Therefore, manually measured Underbust Circumference is predicted from the 3D Scan Extracted Underbust Circumference by using the following equ- ation, from a simple linear regression: Predicted Measured Underbust Circumference = 53.34 + (0.8954) *Scan Extracted Underbust Circumference, R2 = .9736
Scan Extracted Underbust Circumference explains 97.36% of variance in measured Underbust Circumference. This equation was then applied to all the Scan Extracted Underbust Circumference measurements from the ANSUR II 3D scan database to predict measured Underbust Circumference measurements for every ANSUR II participant.
Those predicted measured Underbust Circumferences were used to develop the US Army brassiere sizing chart and size tariff. Then, predicted measu- red Underbust Circumference values were also added to the ANSUR II scan extracted database for future studies on female Soldier’s personal protective equipment and clothing and individual equipment where breast volume is critical.
Sizing System Development Brassiere Band Size This study adopted the sizing method that converts the Underbust Circumfe- rence into band size. However, instead of adding a constant length in inches to the Underbust Circumference, various lengths were applied relative to the size of the torso measured based on their Underbust Circumference (Table 2). This method adopted various approaches; the traditional method (adding a constant length to Underbust Circumference) up to band size 32, then a recent approach that gradually decreases the adding factors up to band size 36, then
rounding down the Underbust Circumference to the next smaller even num- ber for the band size 38 or greater. The band size prediction is represented in the Table 2.
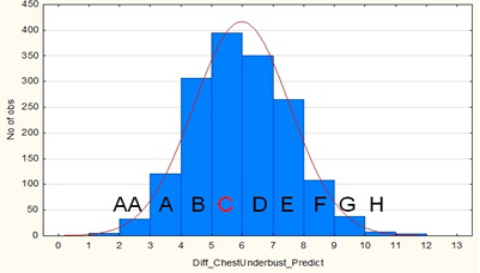
Brassiere Cup Size For this study, cup size was determined based on the difference between Bust Circumference and Underbust Circumference and does not utilize band size. Then, the distribution of the cup size was visualized (Figure 2) to understand the range and the center of the distribution. Given that 36C was the most frequently reported size by female US Army Soldiers (A. Cushon, personal communication, July 2021), the highest bar of the histogram was assigned to be brassiere cup C. Then, the rest of the cup sizes were assigned alphabetically. For example, when the difference between these two circumferences is less than 2.49 inches, it is determined to be an AA-cup. When the difference is between 2.5 and 3.49 inch, it is determined to be an A-cup. The cup size increases as the difference between these circumferences increases. For the ATB project, an AA-cup is the smallest and I-cup is the largest. The cup size schedule is shown in Table 3.
Figure 2: Brassier cup distribution (x-axes represent the delta between chest circumfe- rence and underbust circumference in inches).Table 3. Brassiere cup size.
Table available in the original PDF paper.
Cup AA A B C D E F G H I Delta* (in) Up to 2.49 3 (2.5- 3.49)
4 (3.5- 4.49)
5 (4.5- 5.49)
6 (5.5- 6.49)
7 (6.5- 7.49)
8 (7.5- 8.49)
9 (8.5- 9.49)
10 (9.5- 10.49)
11 (10.5- 11.49)
*Delta: Difference between Bust and Underbust Circumferences
Development of US Army Tactical Brassiere (ATB) Sizing System 7
The tariff for each brassiere size was then produced and shown in Table 4. Three band sizes, 32”, 34” and 36” are the most common and cover 92.03% of the target population. 34D is the single most populated size, cove- ring almost 11.15% of all US Army females. Sister sizes (refer to section “REVIEW OF BRASSIERE SIZING SYSTEM”), are color coded in Table 4 and grouped to represent the accommodation rate in Table 5, with the most populated size in each sister size group highlighted. These seven sister size groups accommodate 93.48% of the target population.
Fit Model Developing a fit model is one recommended step in the next development process. A fit model is a target object to test the fit of the developed size. A fit model could be a real person and/or a virtual model. A real person will give prompt results on the fit, however, it is not always easy to get the right sized person in each size. Virtual fit models utilize 3D scan images of a person, which can be selected out of the ANSUR II 3D databases. Virtual fit evalua- tion for each size is feasible using a large database of variable sizes of virtual humans. These virtual evaluations still need to improve their validity (Song & Ashdown, 2010) due to the lack of realism in body changes and the ability
Table 4. Size tariff (with color grouping of sister sizes).
Table available in the original PDF paper.
Table 5. Accommodation rate per sister size.
Table available in the original PDF paper.
Color Sister Sizes Percentage (%) Red 36AA, 34A, 32B, 30C 7.1 Orange 36A, 34B, 32C, 30D 12.8 Yellow 36B, 34C, 32D, 30E 19.42 Green 38B, 36C, 34D, 32E, 30F 20.28 Blue 38C, 36D, 34E, 32F, 30G 15.87 Navy 40C, 38D, 36E, 34F, 32G, 30H 12.38 Purple 40D, 38E, 36F, 34G 5.63 Total 93.48
Underlined bolded sizes represent most populated size per color/sister category.
to drape fabric and garments (Ancutiené, & Sinkeviˇci¯ut˙e, 2011; Hernández, Mattila, & Berglin, 2019) as compared to hands-on evaluations. Specifically, virtual fitting for a bra may be difficult due to compression issues and because the digital models are already wearing other bras that may influence the sha- pe/fit of the prototypes. However, it offers a substantial advantage that the virtual fit models allow non-invasive fit assessment and provide visualized information.
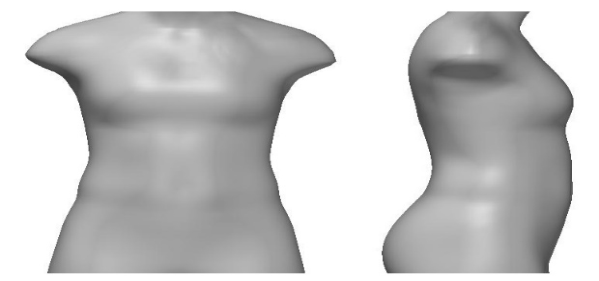
Producing the virtual fit models can be done in two ways: 1) use de- identified scan files of one representative case, close to the central size, per brassiere size or 2) develop an average scan file from all identified cases within the same size (i.e., average 32B 3D scan file from all cases identified as size 32B). 2D snapshots of the front and side views of average 32B are represented in Figure 3, as an example.
Figure 3: Front and side view of the average 32B.
CONCLUSION AND FUTURE DIRECTION This study summarized the second of three studies for ATB program. Curren- tly, all three studies to support ATB program have been completed. Study 1 evaluated selected COTS brassieres and suggested an optimal sports brassiere design that provides superior support on breasts during mobility tests while maintaining the highest comfort level. Study 2 developed a sizing system (Tables 2 & 3) for US Army female Soldiers with 93% of accommodation, using seven sister sizes along with representative sizes for each sister size (Table 4). Lastly, study 3 produced descriptive statistics for the selected pat- tern dimensions to develop the block patterns for those seven selected sizes one for each of seven sister sizes (Refer to Table 5 for seven sister sizes).
The next steps are to design and develop an ATB, utilizing the sizing system and pattern dimensions delivered from current three-phase study. Designing and developing an item to accommodate a specific target population requires iterative testing and redesign to improve the fit, sizing system and the accom- modation rate. It is strongly recommended to employ a fit mapping approach when testing the prototype ATBs. Fit mapping is a method that quantitatively characterizes the relationship between the garment being tested and its target population (Choi et al., 2009). This process identifies gap/overlap between
Development of US Army Tactical Brassiere (ATB) Sizing System 9
adjacent sizes and necessary and unnecessary sizes, validates size charts, and quantifies accommodation rates of each identified necessary size.
LIMITATION Suggested brassiere sizing methodologies (Figure 2, Table 2, and Table 3) are based on a theoretical investigation, and predicted sizes should be the best estimation, with limited adjustment for personal preference. The brassiere sizing system developed in this study is intended to accommodate US Army female Soldiers and is based on their anthropometric characteristics. Thus, this sizing system is not recommended to be used independently without ATB developed from it and should not be used to predict commercial brassiere sizing. A large group fit test is necessary to evaluate, modify and finalize the size chart and the tariffs once the ATB is developed based on this size system.
ACKNOWLEDGMENT
This research was funded by US Army tactical brassiere (ATB) program at US Army DEVCOM Soldier Center. The authors would like to thank those Warfighters for the sacrifices they make every day for our country and all those who volunteered to participate in this study.
REFERENCES
Ancutiené, K. & Sinkeviˇci¯ut˙e, D. (2011). The influence of textile materials mechanical properties upon virtual garment fit. Materials science, 17(2), 160–167. Bra size. (n.d.). In Wikipedia. Retrieved December 22, 2022, from https://en.wikipedia.org/wiki/Bra_size. Choi-Rokas, H. E., Hennessy, E., Brown, S. A. T., DeSimone, L (2022). Army Tactical
Brassiere (ATB) Project, Study 1: Assessment of Commercial Off the Shelf (COTS) Sports Brassieres (Interim Report), DEVCOM SC. Gordon, C. C., Blackwell, C. L., Bradtmiller B., Parham, J. L., Barrientos, P., Paquette, S. P., Corner, B. D., Carson, J. M., Venezia, J. C, Rockwell, B., Mucher, M. and Kristensen, S. (2014). 2010–2012 Anthropometric survey of U. S. Army personnel (ANSUR II): Methods and summary statistics. (Technical Report (Natick/TR-15- 007)). Natick, MA: U. S. Army Natick Research, Development and Engineering Center. Gordon, C. C., Bradtmiller, B., Clauser, C. E., Churchill, T., McConville, J. T., Teb-
betts, I., & Walker, R. A. (1989). 1987–1988 Anthropometric Survey of U. S. Army Personnel: Methods and Summary Statistics. (Technical Report (TR-89- 044)). Natick, MA: U. S. Army Natick Research, Development and Engineering Center. Kanhai, R. C. J. and Hage, J. J. (1999). Bra cup size depends on band size, Plastic and Reconstructive Surgery, Vol. 104, No. 1, pp. 300. Peng Li, Steven Paquette (2020), Female Torso Shape Classification: Methods and
Comparison. AHFE 2020. Advances in Intelligent Systems and Computing, vol 1206. Springer, Cham. https://doi.org/10.1007/978-3-030-51064-0_36
Peng Li, Steven Paquette (2019), Predicting Anthropometric Measurements from 3D Body Scans: Methods and Evaluation. AHFE 2019. Advances in Intelligent Systems and Computing, vol 975. Springer, Cham. https://doi.org/10.1007/978- 3-030-20216-3_52 Song, HK, Ashdown SP. (2011). Categorization of lower body shapes for adult fema-
les based on multiple view analysis. Textile Research Journal. 81(9): 914–931. doi:10.1177/0040517510392448 Wright, M. (2002). Graphical analysis of bra size calculation procedures. International Journal of Clothing Science and Technology, Vol. 14, No. 1, 2002, pp. 41–45.
LISTED IN THE AHFE DIGITAL BOOKSTORE CATALOGUE
Explore the complete digital volume
Digital Human Modeling and Applied Optimization
Read this individual research paper free through the original publisher, or explore the full digital proceedings book.
ISBN 978-1-958651-52-0
Explore this ISBN in the AHFE Bookstore ↗Listed in the July 2026 bookstore catalogue; search by ISBN to confirm current availability · Digital book purchase optional