Peng Li (2022). Orthogonal Curve Analysis of Human Scalp Shape. In: Digital Human Modeling and Applied Optimization. AHFE Open Access, vol. 46, pp. 35–42. https://doi.org/10.54941/ahfe1001897
This paper presents a shape analysis on orthogonal feature curves of 3D bald head scans with the intention of predicting scalp shape under the hair. While there are currently a number of large scale 3D head data collections available around the world, they unfortunately all suffer from hair obstruction preventing an accurate description of true scalp shape. This study is aimed at exploring the relationship between a small set of head anthropometric measurements and the feature curves of the scalp shape based on a small set of 3D bald head scans. The feature curves include scalp profile along the sagittal plane, coronal plane and a cross-sectional curve at the level of glabella.Introduction: The ever increasing availability of 3D scans of the human head has been a valuable source of information for improving head shape related equipment design and engineering with the goal of improving overall fit, sizing and comfort. However the existence of the hair prevents the actual recording and analysis of true scalp shape, and thus the analysis of scalp shape remains an elusive work. For this reason, much of the data analysis based on 3D head scans is mostly limited on facial shape and some facial landmarks. To overcome this limitation, it is desirable to be able to reconstruct the cranium shape from a few easy to obtain anthropometric measurements. In order to achieve this goal we obtained three orthogonal feature curves from 83 bald head scans and build regression equation between principal component scores of these curves and a number of head measurements such as head length, head breadth and tragion-to-top of head distance. The prediction error of these equations are evaluated. The approach: A total of 83 bald head scans taken in the 2012 anthropometric survey of US Army personnel (ANSUR II) from male soldiers are available for the analysis. From these bald head scans we identified three feature curves that principally define the scalp shape. These curves are a profile along the sagittal plane, a profile curve along the coronal plane and a cross-sectional curve at glabella level. These curves are then sampled in an equal angular space and grouped by their respective plane. The collection of each feature curves forms a shape space. We applied Principal Component Analysis (PCA) to those shape curves and decomposed the shape variation of each curve group into its respective principal axes. After conducting the PCA each curve group has a reduced dimension of 4~5 principal components that account for 95% of total variance. It shows major shape variations within each feature curve group. Then we apply multiple linear regression to the above head measurements and PCA scores of each curve group (Principal component regression or PCR). The regression equations for each curve and each PC were evaluated for their predicting power. From these regression equations the constituent feature curves can be selected from respective shape space based on head anthropometric measurements. Then PCR was also applied to the shape space of combined three curves as compared to prediction power in individual curve spaces.The results and discussion: PCR results from all orthogonal curve spaces and combined three curve space have similar predicting power as their R-squared value falling between 0.6 ~ 0.7. With a set of feature curves it is possible to further derive a 3D shape of the scalp. Although the three head measurements used in this study are effectively correlated to the first and second principal component in each group, other principal components contribute to subtle shape variations. This is an area need further analysis. We will also investigate methods to predicting 3D scalp shape from three feature curves and accuracy of the reconstruction of 3D scalp from those curves.
The ever increasing availability of 3D scans of the human head has been a valuable source of information for improving the ability to better describe and understand crania-facial variation as it relates to forensic analysis, pla- stic surgery, medical diagnosis and face and head-borne protective equipment designs. However, because hair is now well captured in most scanners, it pre- vents the actual recording and analysis of true scalp shape from 3D scans, and thus the analysis of scalp shape remains an elusive work that is limited to 3D skull data extracted from X-ray or CT scans (Bérar et al., 2006; Lacko et al., 2014). For this reason, much of the data analysis based on 3D head scans is mostly limited on facial shape and some facial landmarks (Goto et. al., 2015; Green and Curnoe, 2009; Zhuang et. al., 2010). 3D head/face shape analysis that used 3D scans has been reported (Zhuang et. al., 2013; Liu et al., 2015; Ellena et. al., 2017; Lee et. al., 2017; Dai et. al., 2020) but hair effect cannot be eliminated from the scans. In order to estimate a scalp shape under the hair 3D statistical shape models of a sample set of true scalp shapes have to be created. Lacko et. al. (2015) and Park et. al (2021) have developed PCA regression models of the head to predict scalp shapes from anthropometric measurements, based on data from CT scans and bald head
scans respectively. On the other hand, Paysan et al. (2009) and Bérar et. al. (2011) developed statistical models to predict facial shapes from skull data.
In this paper we describe the scalp shape based on a family of orthogonal curves obtained from a small collection of bald head scans. The statistical model of those orthogonal curves was built and multiple linear regression was applied to predict the shape of those curves from a set of anthropometric measurements. In this way, the dimensionality of 3D scalp shape may be reduced and the accuracy of prediction may be improved.
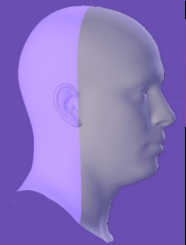
APPROACH A total of 82 bald male head scans that met the criteria for inclusion in this analysis were initially identified from the ANSUR II survey database (Gordon et. al., 2014). From these bald head scans, we selected three orthogonal fea- ture curves that principally define scalp shape. These curves are profiles along the sagittal plane, the coronal plane and a cross-section at glabella level, as shown in Figure 1. Before acquiring these feature curves, the orientation of a head is normalized by its Frankfort plane. The Frankfort plane is defined by two tragion landmarks and averaged location of two infraorbital landmarks. A head scan is normalized by making its Frankfort plane as the X-Z plane, with the middle point of the tragion-tragion line as the origin of the head, and the X-axis on the tragion-tragion line. As a result, the new head coor- dinate system has X-axis pointing to the left, Z-axis pointing to the front and Y-axis pointing up. Accordingly, the sagittal plane is the Y-Z plane and coronal plane is the X-Y plane. The feature curves are then sampled in an equal angular space and grouped by their respective plane. In particular, the sagittal and coronal curves start and end on the glabella plane and they are sampled from 0 to 180 degrees. The glabella cross-section is sampled from 0 to 360 degrees.
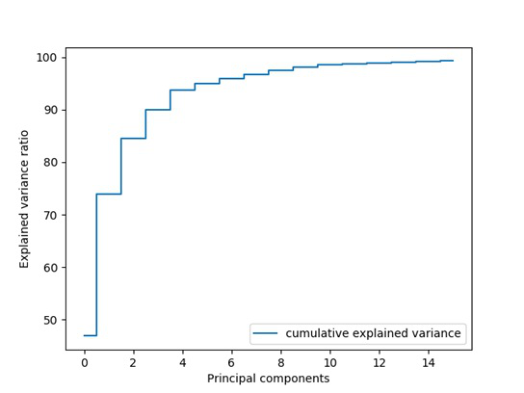
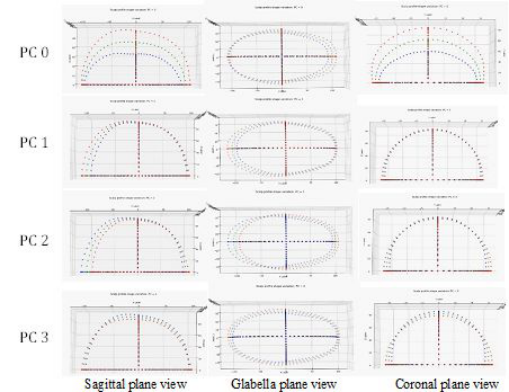
The collections of each feature curves can be viewed as three separate shape spaces. However, the shapes and dimensions of those three curves are asso- ciated to each other in order to define a complete scalp shape. Hence the combined data of the three curves was used in the following analysis. We applied principal component analysis (PCA) to this data set and decompo- sed the shape variation of the joint curve group into its respective principal axes. As shown in Figure 2, the first four principal components (PC) repre- sent around 90% shape variations and the first six PCs represent around 95% shape variation of this joint shape group. Figure 3 shows the shape variati- ons of the first four PCs with plus and minus three standard deviations from the mean shape, as viewed from the sagittal, glabella and coronal planes. As one may expect the first PC always reflects the overall dimension contrast of the shape group. The rest of PCs shows different shape aspects. Table-1 summarizes the observed shape variation for each PC.
Under PCA decomposition an individual shape is a weighted combination of several PC feature vectors as shown in following formula.
Equations and mathematical formulas are available in the original paper PDF.
Orthogonal Curve Analysis of Human Scalp Shapes 37
Figure 1: Coronal, Glabella and Sagittal sampling plane, after the head orientation is normalized in the Frankfort plane.Figure 2: The cumulative explained variance of the joint curve PCA.
where M is the mean shape, {wi} is the PCA scores (weight) and {Vi} is the loading vectors.
The loading vectors are eigenvectors of PCA that form a shape space. The PCA scores are individual specific values to define a shape. When we have a representative PCA space of cranium curves for a target population we could reconstruct an individual’s scalp shape by his/her PCA scores. However, PCA scores are mathematic weights and do not directly associate with an individual’s anthropometric measurements that are often the only accessible variables to describe the scalp shapes. Exploring the relationship between the PCA scores and anthropometric measurements will help to predict 3D scalp shape with simple tape and caliper measurements. We hypothesize that a PCA score may be related to the head measurements by a linear equation as shown in formula (2):
where m is a measurement variable and bli are regression coefficients.
38 Li
Figure 3: PC0 ~ PC3 shape variations of three views of feature curves (mean shape in green, +3SD shape in red, −3SD shape in blue).
So that a predicted scalp shape of orthogonal curves can be expressed as:
X
N X
N X
(ai +
Table-2 lists the descriptive statistics of 82 subjects’ anthropometric measu- rements. Among them are seven manual measurements collected in ANSUR II (Gordon et. al., 2014) and three derived ratio measurements.
RESULTS AND CONCLUSIONS First, we evaluated the accuracy of the reconstructed scalp curves from the first four and six loading vectors respectively by computing 3D point to point distance to the original curves. The mean error and standard deviation are summarized in Table-3. Using the first six loading vectors reduced the stan- dard deviation. Hence the top six PC scores were used in the multiple variate linear regression (MLR) analysis and shape reconstruction.
Then we selected eight measurements: Head Length, Head Breadth, TrTOH, Menton-Sellion Length, Bizygomatic Breadth, Head Breadth to Head Length ratio, TrTOH to Head Breadth ratio and TrTOH to Head Length ratio as independent variables. Head Circumference was not used because that measurement is measured with a tape around hair which cannot reflect the true circumference of scalp.
Multiple variate linear regression (MLR) of the top six PC scores were performed. Table-4 displays the F-test results for the variable selections for PC0 ~ PC3 and the R-squared values from the MLR. We also tested MLR based on measurements selected by their F-test results (those p<0.05 are kept in fitting). The R-squared values from this set of MLR equations slightly decreased, so in the later computation we still used all eight measurements to predict PC scores.
Orthogonal Curve Analysis of Human Scalp Shapes 39
Table 1. Description of observed shape variations of the feature curves.
PC0 Variation on the height and length of sagittal curves. Overall larger shape vs smaller shape
Large variation on the height of coronal curves. Taller and wider vs shorter and narrower.
Length variation occurs at the front of head, which indicates a proportion change related to tragion location
PC1 Length variation of the sagittal curves at the back of head
Length variation of the glabella curves at the back of head
Variation in breadth, maybe due to tragion location variation
Small variation in the breadth of coronal curve PC2 Proportion change of tragion location combined with slightly length variation
Proportion change of tragion location combined with slightly length variation
Taller and narrower vs shorter and wider
PC3 Shorter in length and taller vs longer in length and shorter in height of sagittal section
The shape variation is mainly a scale factor in both section length and breadth, a longer and wider shape vs a shorter and narrower shape
Table 2. Descriptive statistics of the 10 anthropometric measurements utilized in this study.
Table available in the original PDF paper.
Min Max Mean SD Age (years) 19 56 35.9 9.03 Head Breadth (mm) 143 175 155.3 5.48 Head Length (mm) 187 224 201.0 6.53 Menton-Sellion Length (mm) 110 137 123.7 5.53 Bizygomatic Breadth (mm) 133 166 145.2 6.07 Head Circumference (mm) 545 615 575.9 15.15 Tragion to Top Of Head distance (TrTOH) (mm) 111 147 129.5 6.72 Ratio of head breadth and head length 0.6895 0.8426 0.7731 0.0317 Ratio of TrTOH to head breadth 0.7161 0.9459 0.8348 0.046 Ratio of TrTOH to head length 0.5441 0.7231 0.6446 0.0307
To evaluate the predicted scalp shape accuracy, we reconstructed the scalp shapes from the regression models with the eight measurements as inputs and then computed the distance between the corresponding points on the original scalp shape. The mean distance and standard deviation were recorded as a metric for the goodness of the prediction. We split the sample data into a training and a test group and perform a 10-fold cross-validation. That is, using regression models from training data (about 72 samples), we predicted scalp shapes that were not included in the training data for each batch (about eight samples) and rotated the split 10 times. When doing this, we received
40 Li
Table 3. Reconstruction accuracy from top four and six loading vectors (unit=millimeter).
Table available in the original PDF paper.
Mean error Standard deviation Use loadings on PC0, PC1, PC2 and PC3 1.34 1.0139 Use loadings on PC0, PC1, PC2, PC3, PC4 and PC5 0.9633 0.7481
Table 4. F-test’s p-value of MLR results from eight measurements on PC0 ~ PC3, shaded areas are those p-value > 0.05 and R-squared values for each MLR fitting.
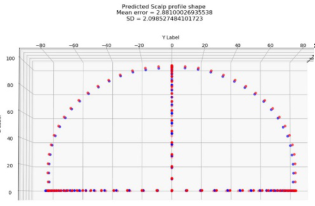
Figure 4: Two samples of predicted scalp shape from the measurements in Table-4 (blue = original shape, red = predicted shape).
Orthogonal Curve Analysis of Human Scalp Shapes 41
an average mean distance error between the corresponding points of 2.8035 mm with an average standard deviation of 1.9654 mm from all tests. Figure 4 shows two examples that have mean errors of 2.88 and 2.39, respectively.
With a set of orthogonal feature curves it is possible to further derive a 3D shape of the scalp. The ultimate goal of this approach is to predict the scalp shape for head scans with hair in the ANSURII database. The 10-fold cross validation shows the mean distance error from MLR prediction is around 2.8 mm but there are some cases that the mean errors are larger than 5 mm. We will try different prediction methods to improve the accuracy and also continue to collect more bald scans to increase the size of the training data set. It’s not clear if including facial scan as independent variables can improve prediction accuracy, but our experiment does show that using eight variables in Table-4 improved prediction accuracy over using less variables. Being able to reconstruct scalp’s shape from traditional anthropometric measurements is important for leveraging existing 3D head surface scans to create complete head models for head-borne protective equipment designs.
ACKNOWLEDGMENT
The author would like to thank Ms. Blake Mitchell for reviewing and suggestion to this paper.
REFERENCES
Bérar, M., Desvignes, M., Bailly, G., & Payan, Y. (2006). Statistical skull models from 3D X-ray images. arXiv: Medical Physics. Bérar, M, Tilotta, F., Glaunès, J., , Rozenholc, Y., (2011). Craniofacial reconstruction
as a prediction problem using a Latent Root Regression model, Forensic Science International, Volume 210, Issues 1–3, 2011, Pages 228-236, ISSN 0379-0738, https://doi.org/10.1016/j.forsciint.2011.03.010. Dai, H., Pears, N., Duncan, C., (2017). Modelling of Orthogonal Craniofacial Profiles. J. Imaging, 3(4):55, 2017. Dai, H., Pears, N., Smith, W. et al. (2020). Statistical Modeling of Craniofacial Shape
and Texture. Int J Comput Vis 128, 547–571. https://doi.org/10.1007/s11263- 019-01260-7 Ellena T, Skals S, Subic A, Mustafa H, Pang TY. (2017). 3D digital head form models of Australian cyclists. Applied Ergonomics. 2017 Mar;59(Pt A):11-18. DOI: 10.1016/j.apergo.2016.08.031. PMID: 27890118. Gordon, C.C., Blackwell, C.L., Bradtmiller B., Parham, J.L., Barrientos, P. Paqu-
ette, S.P., Corner, B.D., Carson, J.M., Venezia, J.C. Rockwell, B.M., Mucher, M, and Kristensen, S. (2014). 2010-2012 Anthropometric Survey of U.S. Army Per- sonnel: Methods and Summary Statistics. Technical Report (Natick/TR-15/007). U.S. Army Natick Research, Development and Engineering Center, Natick, MA 01760-2646. Goto, L., Lee, W., Song, Y., Molenbroek, J., Goossens, R., (2015). Analysis of a 3D anthropometric data set of children for design applications. In: Proceedings 19th Triennial Congress of the IEA, vol. 9, p. 14. Green H, Curnoe D. (2009). Sexual dimorphism in southeast Asian cra- nia: a geometric morphometric approach. Homo. 2009;60(6):517-534. doi:10.1016/j.jchb.2009.09.001
42 Li
Lacko D, Huysmans T, Parizel PM, De Bruyne G, Verwulgen S, Van Hulle MM, Sijbers J. (2015). Evaluation of an anthropometric shape model of the human scalp. Appl Ergon. 2015 May; 48:70-85. doi: 10.1016/j.apergo.2014.11.008. Epub 2014 Dec 6. PMID: 25683533. Lee, W., Goto, L., Molenbroek, J., Goossens, R., Wang, C., (2017). A Shape
based Sizing System for Facial Wearable Product Design, Proceedings of 5th International Digital Human Modeling Symposium, Bonn, Germany 2017. Liu Y, Xi P, Joseph M, Zhuang Z, Shu C, Jiang L, Bergman M, Chen W. (2015).
Variations in Head-and-Face Shape of Chinese Civilian Workers. Ann Occup Hyg. 2015 Aug;59(7):932-44. doi: 10.1093/annhyg/mev026. Epub 2015 Apr 9. PMID: 25858431; PMCID: PMC5504517. Park, B. K. D., Corner, B. D., Hudson, J. A., Whitestone, J., Mullenger, C. R., & Reed, M. P. (2021). A three-dimensional parametric adult head model with representation of scalp shape variability under hair. Applied Ergonomics, 90, 103239. Paysan, P., Lüthi, M., Albrecht, T., Lerch, A., Amberg, B., Santini, F., & Vetter,
T. (2009). Face Reconstruction from Skull Shapes and Physical Attributes. In: Denzler J., Notni G., Süße H. (eds) Pattern Recognition. DAGM 2009. Lecture Notes in Computer Science, vol 5748. Springer, Berlin, Heidelberg Zhuang, Z., Shu, C., Xi, P., Bergmana, M., Joseph, M., (2013). Head-and-face shape variations of U.S. civilian workers, Applied Ergonomics, Volume 44, Issue 5, September 2013, Pages 775-784 Zhuang, Z., Slice, D., Benson, S., Lynch, S., & Viscusi, D., (2010). Shape Analysis of
3D Head Scan Data for U.S. Respirator Users. EURASIP J. Adv. Signal Process. 2010, 248954. https://doi.org/10.1155/2010/248954
LISTED IN THE AHFE DIGITAL BOOKSTORE CATALOGUE
Explore the complete digital volume
Digital Human Modeling and Applied Optimization
Read this individual research paper free through the original publisher, or explore the full digital proceedings book.
ISBN 978-1-958651-22-3
Explore this ISBN in the AHFE Bookstore ↗Listed in the July 2026 bookstore catalogue; search by ISBN to confirm current availability · Digital book purchase optional