Alexis Polanco Jr, Tsailu Liu (2023). Uncovering an Inclusion Gap in the Design of Digital Assessments for Middle school-aged Deaf and Hard of Hearing Students in the United States. In: Design for Inclusion. AHFE Open Access, vol. 75, pp. 83–92. https://doi.org/10.54941/ahfe1003329
What does a score on a digital assessment mean? At its core, a score is a measurement of how a student matches up to a predefined construct. For example, a reading assessment may measure the construct of a student’s reading fluency, comprehension, or both. This research seeks to challenge the legitimacy of digital assessment from the lens of Accessibility, User Experience (UX), Inclusive Design, and Marginalized Populations by focusing on the needs of the deaf and hard of hearing (DHH) middle school-aged student in the United States.DHH learners are among the least understood groups. Neither the US Census nor public schools recognize American Sign Language (ASL) as a non-English language used at home. For the sake of discussion, this research references a study by Goman from 2016 which estimates that 14.3% of all Americans aged 12 and older have some form of hearing loss, and a study from the U.S. National Center of Educational Statistics which estimated students with hearing impairment between ages 3-21 at 1% of all students. These statistics are especially concerning when juxtaposed with how assessments are created. Two of the top educational companies in U.S. use a process called “pretesting” to determine the statistical relevance of the questions used in their assessments. This process involves trialing assessment items with a sample group similar to the population to be assessed. As assessments are increasingly delivered digitally, they overlap with other disciplines like UX Design. In UX, it is well documented that testing with five people finds most problems. If we assume that pretesting uses a similar sample size, it is a reasonable assumption that many items would not be trialed with DHH students, i.e. this marginalized group isn’t populous enough to be accounted for in a statistically relevant pretesting sample.To provide legitimacy to this claim, this research used structured interviews with subject-matter experts (SMEs) in usability, accessibility, child-computer interaction, and DHH education. The responses provided by these SMEs lent credence to the idea that DHH learners were often not included in digital assessment design either due to being sampled out, a lack of accessibility awareness, and/or the absence of inclusive design guidelines for DHH students. For example, one interviewed Director at a prominent deaf institution said, “In terms of my field, there isn’t some tangible set of design principles that apply in [my] specific area. These things are developing as we go.”This is especially concerning when scores for deaf learners have wide implications in terms of public funding for school districts at the macro level, and self-worth issues at the individual level; especially when it is oft-cited that 80% of age-14 DHH students on average place below a grade-4 reading level. For these reasons, the goal of this research is to empower designers, developers, managers, and researchers with a repeatable framework for inspiring cross-disciplinary collaboration to create fair and equitable digital assessment designs. It is about meeting the full spectrum of need for every individual student—starting with the DHH student’s needs.
In the United States, it is estimated that 14.3% of all Americans age 12 and older have some form of hearing loss. (Goman, 2016) Research on deaf or hard of hearing students (DHH) is seemingly non-existent despite the number of DHH students in schools increasing each year. (Pizzo & Chilvers, 2016). This lack of scientific literature and the novelty of digital assessments at large have caused me to investigate the efficacy of digital assessments that proport to quantifiably measure the proficiency of DHH students in the United States.
How are Assessments Measured?
Assessments provide a quantifiable measure for how a student matches up to a predefined construct. There are two primary methods of measuring stu- dent performance in an assessment: Classical Test Theory (CTT) and Item Response Theory (IRT). For the purposes of this article, these theories will not be disputed.
In short, the first method, Classical Test Theory, was developed in order to determine measurement error values to correct test scores. It sought to explain why the same construct could be measured multiple times with diffe- rent results. (Steyer, 2001, p. 1955) The primary concepts are “test observed” (X), “true score” (T), and “error score.” In CTT, a true score represents the average score a student would receive if they completed a test an infinite number of times. As a result, this approach is very dependent on the size of pretesting test-taker samples. Additionally, in order to properly calculate an assessment’s true score in the CTT model, the same question must be admi- nistered each time to appropriately determine the error score. (Zanon, Hutz, Yoo, & Hambleton, 2016).
The second method, Item Response Theory, was formed in response to the CTT limitation of needing to deliver the same test items for analysis. Its key concepts are a person’s “latent ability” and an “item characteristic curve (ICC).”(Yang & Solon, 2014, “Basic measurement properties for IRT”) Latent ability refers to a construct being measured, and the item characte- ristic curve represents the probability of receiving a correct score based a test-taker’s latent ability. Item response theory is founded upon a few key assumptions–assumptions which have caused it to be the more prevalent model in educational assessment.
1) Monotonicity: as the latent trait increases, the probability of a correct answer will always increase. 2) Unidimensionality: there is one dominant trait that is being measured by an item, and it is the primary factor in all item scores. 3) Local independence: scores received on different items have no statistical bearing on one another; i.e. they are mutually independent. 4) Invariance: Item characteristics can be estimated from any point on the ICC. (Yang & Solon, 2014) How do These Test Theories Relate to Students With Disabilities?
Quite simply, the study and measurement of students with disabilities is novel. To lend credence to this claim, the National Assessment of Educational
Uncovering an Inclusion Gap in the Design of Digital Assessments 85
Progress (NAEP) –which is the largest nationally representative assessment of American students’ proficiency in various subjects– was first administered in 1969, but its first assessment with special needs accommodations was in 1998. Unsurprisingly, the study of students with disabilities’ performance on digital assessments is even more novel. Pointedly, it was only until 2017 that NAEP transitioned to a digitally based assessment. (NCES, 2019). Fur- thermore, the transition to digital assessments has forced a new level of interdisciplinary design that did not exist. Namely, fields like user experi- ence design, instructional design, and assessment design have been forced to co-exist, and often in ways that may seem contradictory. For exam- ple, in paper-based assessment (PBA) things like line-wrapping, the font weights, and font sizes are elements that can be kept constant betw- een test-takers—thereby eliminating the potential statistical impact these variations could have on a students’ ability to score well on digital assessments.
In the world of digital design, however, it is generally assumed that there will be variance between test taking devices. For example, a web page may require considerably more scrolling on a smaller or low-resolution compu- ter monitor than would be required on a larger, high-resolution computer monitor. While it is possible to lockdown the computer hardware that stu- dents use through heavily modifying a computer’s firmware (e.g. altering the firmware of a Windows-based PC to prevent the use of hotkey that calls forth operating system functions that are not controlled by the digi- tal assessment, like the Magnification tool). Unfortunately, this type of practice may unfairly punish students with disabilities who may rely on these types of operating system tools to be successful. As a result, asses- sments have employed the use of accommodations for students with disa- bilities. Fortunately, in the case of Magnification, it is a widely accepted accommodation.
That said, I have been unable to locate studies that demonstrate that this accommodation does not alter constructs being measured—which is how NCES defines an accommodation. As a result, it becomes difficult to asser- tation why accommodations are not universally provided. This bolsters the argument that assessments that require accommodations may be inherently flawed due to the need to provide special exceptions to measure a con- struct. The theoretical argument to be made here is that if the assessment was designed from the beginning with the needs of all students in mind, accommodations would be unnecessary.
Fortunately, assessments like NAEP, have been adopting a universal design mindset which aligns with this argument. These universal design elements provides equitable assistance to all students, regardless of ability—some examples include Text-to-Speech for directions or the ability to change the color contrast of assessment items. The downside to a purely universal design mindset, however, is may force statistically small populations to be overlooked in the design process.
86 Polanco Jr and Liu
How Statistically Significant Are Deaf and Hard of Hearing Middle-School Aged Students?
It is likely that anyone who has worked in accessibility in any capacity has been asked to quantify the problem or value proposition associated with persons of disabilities. It is an unfortunate question, because even a single problem for a person with disability is something that should be respected.
That said, I have attempted a best guess at quantifying the number of stu- dents in the United States that that know American Sign Language (ASL) to approximate the scope of my research statement. (Please note that not all deaf students learn ASL. Parents/guardians of deaf or hard of hearing chil- dren may have elected to provide their children with cochlear implants which allow for improved hearing ability.)
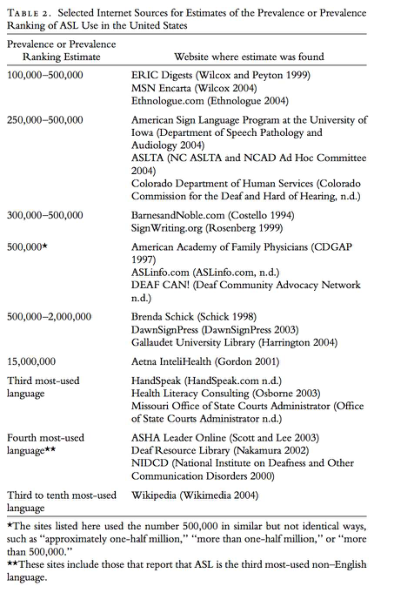
Here is the big caveat: Neither the US Census nor public schools (auth- orized by the Bilingual Education Act of 1968) list ASL as a non-English language used in the home. (Michell, Young, Bachleda, & Karchmer, 2006, p. 306) As a result, the most relevant information I can find is a 2005 publi- cation by Gallaudet University. Due to the aforementioned limitations of the U.S. Census, Gallaudet was forced to rely on Internet sources, which place ASL usage in the United States at somewhere between 100,000 and 15,000,000 people. Using these estimates, we can attempt a loose approximation of ASL usage in middle-school-aged students (MS students). Another reason why these numbers are not definitive is that the US National Center for Educational Statistics (NCES) aggregates PreK-8 as one dataset. According to NCES, the projected total number of students in PreK-8 in 2020 is 39,476,000. (NCES, 2019) If we assume the following: 1) Prekindergarten and Kindergarten are distinct grade-levels, 2) Students have an equivalent distribution between all 10 grade levels (preK-8), 3) Middle-school represents grades 6-8; we can estimate that there are 11,842,000 students in middle school in the United States.
39, 476, 000 students ÷ 10 grade levels = 3, 947, 600 students grade level 3, 947, 600 students gradelevel × 3 grade levels = 11, 842, 000 MS students
The last datapoint we need to come to an ASL in middle-school number is the total US population. According to Census.gov, the US Population is approximately 330,000,000 as of October 2020. If we divide the total middle school population by the US population, we can calculate the percentage of middle-school aged students at 3.59% of the total population.
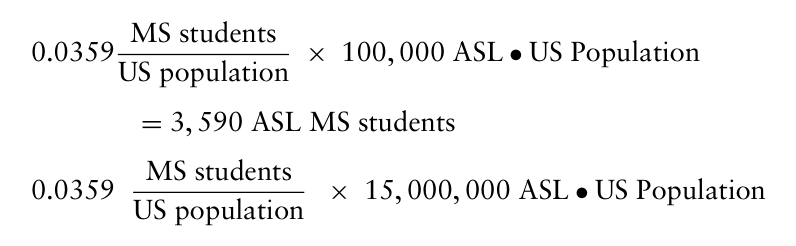
Equation reproduced from the original PDF.
Another assumption that we will make is that the proportion of MS stu- dents to total US population is an equal proportion to that of ASL-speaking
Uncovering an Inclusion Gap in the Design of Digital Assessments 87
Figure 1: Prevalance of ASL Use in the United States. Reprinted from “How Many People Use ASL in the United States? Why Estimates Need Updating”, by Michell, R. E., Young, T. A., Bachleda, B., & Karchmer, M. A. (2006), p. 315.
MS students of the US to the total ASL-speaking population of the US. This would place the ASL MS student population between 3,590 and 538,500.
Equation reproduced from the original PDF.
The reason for providing these numbers is not to lessen or diminish the lived-in experiences of these middle-school aged students. The goal is to demonstrate the duality of this population group as being one that measures in the thousands to hundreds of thousands, yet can at times be a rounding error that can cause these students to be ignored due to statistical rounding errors.
It is unlikely that every testing institution uses an identical process for creating items, but they do have many similarities. In this article, we will remark on the item creation process for two of the largest testing institutions globally- Educational Testing Services and Pearson.
ETS’s test development process follows seven steps. (ETS, n.d., “Step 1-7”)
1. Define Objectives: “Educators, licensing boards or professional associations identify a need to measure certain skills or knowledge.” 2. Item Development Committees: “The answers for the questions in Step 1 are usually completed with the help of item development committees, which typically consist of educators and/or other profes- sionals appointed by ETS with the guidance of the sponsoring agency or association.” 3. Writing and Reviewing Questions: “Each test question undergoes numerous reviews and revisions to ensure it is as clear as possible, that it has only one correct answer among the options provided on the test, and that it conforms to the style rules used throughout the test.” 4. The Pretest: “After the questions have been written and reviewed, many are pretested with a sample group similar to the population to be tested.” 5. Detecting and Removing Unfair Questions: “Trained reviewers must carefully inspect each individual test question, the test as a whole, and any descriptive or preparatory materials to ensure that language, symbols, words, phrases, and content generally regarded as sexist, racist, or otherwise inappropriate or offensive to any subgroup of the test-taking population are eliminated.” 6. Assembling the Test: “After the test is assembled, it is reviewed by other specialists, committee members and sometimes other outside experts.” (ETS, n.d., “Step 6”) 7. Making Sure that the Test Questions are Functioning Properly: “Even after the test has been administered, statisticians and test
Uncovering an Inclusion Gap in the Design of Digital Assessments 89
developers review to make sure that test questions are working as intended. (ETS, n.d., “Step 7”).
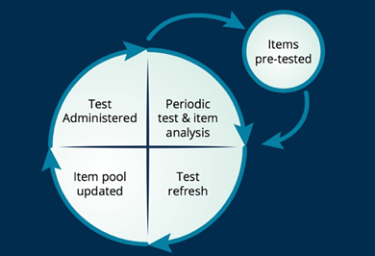
Pearson, conversely, provides a cyclical diagram to describe its test content creation process. It is not immediately clear which is the first step in the process, but I believe it to be Periodic test and item analysis. Pearson describes these terms as follows: Pretesting: “Pre-testing (or trialing) of test items refers to the admini- stration of the items solely to gather performance statistics to determine if the items should be included in the operational item pool from which items are selected for future administration & scoring.” (Pearson, 2018, “Pre-testing”).
Item Analysis: “Statistical investigation of the performance of test items to obtain information about the quality of the items.” (Pearson, 2018, “Glossary”).
Item pool updated: “Psychometric analysis of operational scored items should be conducted to evaluate which items should remain in the opera- tional pool and which items should be retired from use.” (Pearson, 2018, “Item analysis”).
What’s the Problem?
The processes described by Educational Testing Services and Pearson appear are sufficient from the perspective of effective item development (ID). At a surface-level, they also appear sufficient from an equity perspective– from the understanding that items will be pretested and will have gone through various ID committees. The assumption here is that these committees are well-versed in the nuances of their represented populations.
Upon closer reflection, the problem lies in the pre-testing step that is com- mon to both ETS and Pearson. Let us revisit ETS’s definition of pre-testing (with bold representing my emphasis): “… many are pretested with a sample group similar to the population to be tested.”
Unfortunately, students with disabilities represent a statistically small segment of the entire student population, especially so DHH middle school- aged students, as was communicated in Section III. As such, it is not unreasonable to assume that this population can and will be sampled out.
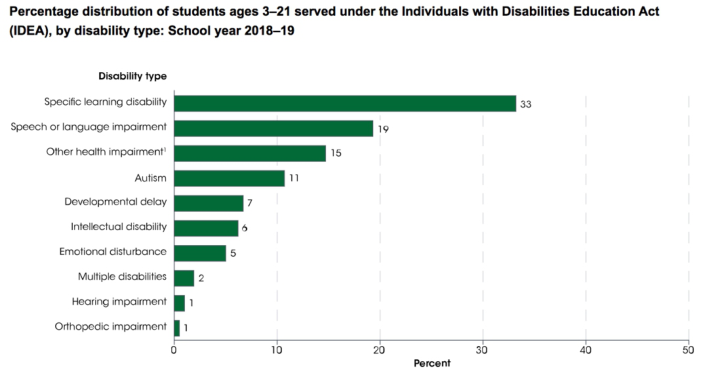
In the field of usability, for example, user-testing with five participants finds most problems, user-testing with 39 participants is at the high-end, and most companies use 11 participants per testing session. (Nielsen, 2012) If we use the industry recommendation of five test participants, that would mean that every student of every disability type, with the exception of “specific learning disability” would be omitted due to representing less than < 20% of a nationally-representative sample (NCES, 2020).
What Can Be Done?
Before we can continue to discuss the problem facing DHH middle school- aged students, it is important to understand the larger context of digital accessibility in the United States.
90 Polanco Jr and Liu
Figure 3: Percentage of students with disabilities. (NCES, 2020, “Students with Disabilities”).
In 1996, the US Department of Justice ruled that websites were public accommodations. (US DOJ, 2012) As such, businesses were not allowed to discriminate against individuals with disabilities. In 1998, Section 508 of the Rehabilitation Act of 1973 required the federal sector (e.g. government age- ncies, federally funded non-profits, K-12 schools) to have accessible digital assets. (Pan, 2017) In the years that followed, the Web Content Accessibility Guidelines versions 1.0 and 2.0 that were developed by the World Wide Web Consortium (W3C) came out in 1999 and 2008, respectively, as a way of improving web accessibility. In a move that codified WCAG as a de-facto standard, the US Government then further modified Section 508 in 2018 to require WCAG 2.0 Level AA compliance. (US GSA, 2018) Understanding all this history, one would expect ETS and Pearson to expli- citly reference WCAG in their content creation guidelines, especially for work done on behalf of the federal government. Unfortunately, this is not the case as was exemplified in Section IV. I believe this to be unacceptable, and this needs to change. believe it to be unreasonable that both Pearson and ETS do not explicitly reference WCAG in terms of work process or review process in their respective content creation guidelines.
To give credit where it is due, ETS and Pearson are both members of the W3C. From the interviews I have conducted with individuals who work in the field of accessibility at these and other companies, I understand that it is a difficult battle to bring an entire company on-board with the idea that accessibility is the responsibility of every employee. As such, it is my hope that this article is perceived less as an attack on credibility, but more so a rally cry to get practitioners excited to work with their accessibility partners.
What Do Experts Have to Say About This?
The theoretical constructs I sought to investigate were usability, accessibility, and child-computer interaction. Using structured interviews and the strategy
Uncovering an Inclusion Gap in the Design of Digital Assessments 91
of the Critical Decision Method (CDM), domain specific knowledge was eli- cited from subject matter experts (SMEs) in usability, assessment design, child computer interaction, accessibility, and deaf or hard-of-hearing education.
In terms of my field there isn’t some tangible standard set of design principles that apply in this specific area.
CDM works by applying a set of probing questions as a framework for allowing experts to recall aspects of their decision-making process. Since its inception, it has been gained notable use in the fields of instructional design, system development, and information technology. (Taylor, 2006) The strength of CDM is rooted in empirical studies that have found that sub- ject matter experts enjoy telling stories, and that “some practitioners learn on the job by sharing their ‘war stories’ and even report that they learn more that way than through formal instruction.” (Hoffman, Crandall, & Shadbolt, 1998, p. 271) Among the most telling of the questions asked were: “What principles or guidelines are you aware of and use in your profession?” No list of existing guidelines were provided so as to not bias the answers provided. To my sur- prise, there was no single guideline that emerged as being universally used by all SMEs. A slight majority did emerge, however, with WCAG and Universal Design being mentioned by 4 out of the 7 SMEs, which represented a slight majority.
The quote which resonated the most with me came from a Melissa Malz- kuhn, the Director of the Motion Light Lab at Gallaudet University. Through an interpreter, she said: “I’m not really clear on what you mean by that question in terms of design principles, and really it’s interesting because when we develop these storybook apps for deaf readers there was no precedent for them.
…In terms of my field there isn’t some tangible standard set of design principles that apply in this specific area. These are things that we’re
developing as we go.”
CONCLUSION
At the onset of this research, I believed that a clear set of guidelines could emerge which would in turn be provided to the leading digital assessment companies in the United States to improve fair and equitable assessment for deaf and hard of hearing middle school-aged students. Unfortunately, that outcome did not happen. What did happen, however, was that an inclusion gap in assessment pre-testing activities became apparent and the SMEs who I spoke to came to understand that even if they were not designers themselves, they had valuable expertise that could aid in the design of digital assessments and designerly output.
REFERENCES
ETS. (n.d.). How Tests and Test Questions are Developed. Retrieved Oct 2020, from ETS.org: https://origin-www.ets.org/understanding_testing/test_development.
92 Polanco Jr and Liu
Goman, A. (2016). HOW MANY PEOPLE HAVE HEARING LOSS IN THE UNITED STATES? https://www.jhucochlearcenter.org/how-many-people-have- hearing-loss-united-states.html. Hoffman, R. R., Crandall, B., & Shadbolt, N. (1998, June 1). Use of the Critical
Decision Method to Elicit Expert Knowledge: A Case Study in the Methodology of Cognitive Task Analysis. Retrieved from SAGE journals: https://journals-sagep ub-com.prox.lib.ncsu.edu/doi/abs/10.1518/001872098779480442. Magno, C. (2009, April). Demonstrating the Difference between Classical Test Theory and Item Response Theory Using Derived Test Data. Retrieved from Ed.gov: https://files.eric.ed.gov/fulltext/ED506058.pdf. Michell, R. E., Young, T. A., Bachleda, B., & Karchmer, M. A. (2006). How Many
People Use ASL in the United States? Why Estimates Need Updating. Retrieved from Project MUSE: https://muse-jhu-edu.prox.lib.ncsu.edu/article/197164. NCES. (2019). Digest of Educational Statistics. Retrieved from NCES: https://nces.e d.gov/programs/digest/d19/tables/dt19_105.20.asp. NCES. (2019). NAEP History and Innovation. Retrieved from Ed.gov: https://nces
.ed.gov/nationsreportcard/about/timeline.aspx. NCES. (2020, May). The Condition of Education: Students With Disabilities.: https: //nces.ed.gov/programs/coe/indicator_cgg.asp. Nielsen, J. (2012, June 3). How Many Test Users in a Usability Study? Retrieved
from Nielsen Norman Group: https://www.nngroup.com/articles/how-many-test -users/. Pan, J. (2017, September 26). 508, ADA, WCAG: What’s the difference? Retrieved from LOGIC Solutions: https://www.logicsolutions.com/508-ada-wcag-accessibi lity-difference/. Steyer, R. (2001). Classical (Psychometric) Test Theory. In N. J. Smelser, & P. B. Baltes,
International Encyclopedia of the Social & Behavioral Sciences (pp.1955–1962). https://www.sciencedirect.com/science/article/pii/B008043076700721X Taylor, H. (2006). Eliciting Tacit Knowledge Using the Critical Decision Interview Method. In M. E. Jennex, Knowledge Management in Modern Organizations (pp.285–301). Idea Group, Inc. US DOJ. (2012, Dec 7). Nondiscrimination on the Basis of Disability; Accessibility of
Web Information and Services of State and Local Government Entities and Public Accommodations: https://www.ada.gov/anprm2010/web%20anprm_2010.htm. US GSA. (2018, May). Applicability & Conformance Requirements. Retrieved from Section508.gov: https://www.section508.gov/create/applicability-conformance. W3C Team. (2019, December 6). ACCESSIBILITY FOR CHILDREN COMMU-
NITY GROUP. https://www.w3.org/community/accessibility4children/2019/12/ 06/call-for-participation-in-accessibility-for-children-community-group/. Yang, F. M., & Solon, T. K. (2014, June). Item response theory for measurement validity. https://www.ncbi.nlm.nih.gov/pmc/articles/PMC4118016/#B3 Zanon, C., Hutz, C. S., Yoo, H., & Hambleton, R. K. (2016, April 18). An application
of item response theory to psychological test development. https://prc.springerop en.com/articles/10.1186/s41155-016-0040-x
LISTED IN THE AHFE DIGITAL BOOKSTORE CATALOGUE
Explore the complete digital volume
Design for Inclusion
Read this individual research paper free through the original publisher, or explore the full digital proceedings book.
ISBN 978-1-958651-51-3
Explore this ISBN in the AHFE Bookstore ↗Listed in the July 2026 bookstore catalogue; search by ISBN to confirm current availability · Digital book purchase optional