Rocky Mahmud (2023). Eco Innovation and Firm Performance: A Meta Analysis. In: Creativity, Innovation and Entrepreneurship. AHFE Open Access, vol. 74, pp. 161–171. https://doi.org/10.54941/ahfe1003318
The objective of the meta-analysis is to develop a comprehensive knowledge of the relationship between eco-innovation and firm performance. Total 21 articles, published in different academic journals, were selected for the meta-analysis following a systematic literature search on the web of science and Scopus. The result of the meta-analysis suggests that there is a positive relationship between eco-innovation and firm ́s financial performance. The correlation between the variables is moderate (r > .20). However, findings suggest a heterogeneity among the reported effect size. It is found that study regions and sample company size have moderating effect on the heterogeneity score, suggesting these factors affects the result of an individual study. Moreover, the funnel plots suggest there might be the presence of publication bias.
The increasing environmental awareness has led governments around the world to impose strict regulatory measures toward ensuring a sustainable global economy (Doran & Ryan, 2016; Hojnik & Ruzzier, 2017; Tang et al., 2018; Yi et al., 2021). The strict measures of the governments causing the companies to invest a substantial amount of money in Eco-Innovation (Garcia-Marco et al., 2020; Hojnik & Ruzzier, 2017; Tang et al., 2018). With the momentum, the idea of eco-innovation has become a topic of great inte- rest among the scholars as scholarly publication has been gradually increasing on the topic. The relationship between eco-innovation and a firm’s financial performance is among the most investigated research topics (Yi et al., 2021). Existing literature on the relationship between eco-innovation and firm’s per- formance presents an inconclusive result (Tang et al., 2018; Yin et al., 2022). For instance, Aiber-Guzman and Somohano-Rodriguez (2021) and Rama- nathan (2010) found environmental innovation contributes to the loss of a firm, while some studies found a weak effect of eco-innovation (Duque- Grisales et al., 2020; Marin-Vinuesa et al., 2017; Marin-Vinuesa et al., 2020; Scarpellini et al., 2017; Xie & Zhu, 2020), and several studies reported a moderate correlation between the variables (Hojnik & Ruzzier, 2017; Singh et al., 2022; Tang et al., 2018). Given the fact that understanding the financial impact of environmentally friendly innovation would assist organizations in making investment decision regarding eco-innovation, we conduct this
meta-analysis to generate a comprehensive knowledge on the topic. Also, comprehensive knowledge of the relationship between eco-innovation and firm performance would have significant impact on the existing literature. Hence, the objective of this research synthesis is to offer comprehensive kno- wledge to answer the research question “what is the financial impact of eco-innovation?”.
Existing literature define eco-innovation emphasizing on the reduction of environmental pollution and fostering sustainability. Green innovation, sustainable innovation, green patent, eco-product innovation, eco process innovation, environmental innovation etc. are some widely used keywords in academic literature that represents eco-innovation. According to (Guo et al., 2020) green innovation refers to a long term approach to reduce environ- mental pollution by business entities through innovation of new products and processes. Eco innovation usually refers to the creation of business pro- cess and new products that has lower impact of environmental pollution and contribute towards sustainability (Liao & Liu, 2021). Dimensions of eco-innovation include product eco innovation, process eco innovation, and organizational eco innovation. The existing literature suggest that eco inno- vation is the combination of product and process innovation (Hojnik & Ruzzier, 2017; Hu et al., 2021; Liao et al., 2019; Tang et al., 2018; Xie et al., 2022; Yao et al., 2021). While product eco innovation refers to the innovation of new product that lower the environmental pollution, the pro- cess eco innovation refers to the development of new business processes that reduces overall environmental damage (Hojnik & Ruzzier, 2017; Xie et al., 2022). In this paper firm’s financial performance refers to several aspects of economic performance including return on assets (ROA), return on equity (ROE), profit margin, and sales revenue (Chouaibi et al., 2022; Tang et al., 2018; Xie et al., 2022).
METHODOLOGY
A systematic literature search approach was used to write this meta-analysis following the seven steps approach of Cooper (2015). Since the principal objective of the research synthesis is to analyze the relationship between eco-innovation and firm performance, a. systematic literature search is done to identify relevant literature that discuss the relationship between these variables. For the literature search, I have used web of science and Sco- pus databases. As the variables eco-innovation and firm performance are broad, it seemed quite reasonable to use several synonymous words for both the constructs. For the meta-analysis eco innovation, green innovation, and sustainable innovation were used as synonym for eco innovation. Similarly, firm performance, financial performance, and firm profitability were used as synonym for the construct firm performance. The search generated 486 results, which was further refined by research areas, categories, language, and document types. The final result of the literature search provided a list of 163 journal articles. The following inclusion criteria were used to screen the 163 articles-
Eco Innovation and Firm Performance: A Meta Analysis 163
a) Each study empirically explains the relationship between eco innova- tion and firm performance in which firm performance was a dependent variable. b) Each study had to report R-family effects explicitly (e.g., correlation, chi-square, p value, t statistic). Also, the sample size and regression coefficients had to be clearly present in each study. c) Each study had to clearly define the construct eco innovation and firm performance; study that did not use a similar definition of eco-innovation and firm performance were excluded from the study. d) Each study had to provide sufficient information to compute effect size.
When an article did not match all these inclusion criteria, it was exclu- ded from the study. Following the screening criteria, 21 independent studies were found from which data for this meta-analysis is collected and coded for carrying out the analysis.
Effect Size In this meta-analysis, I have adopted the data processing method suggested by Rosenthal and Rosenthal (2001). From the included studies, relevant data including Pearson’s r, F statistic, t statistic, chi-square, p-value, and sample size were collected. Next, these statistics were converted into correlation coef- ficient value (r). Finally, the correlation coefficient (r) was transformed into Fisher’s effect size using the formula Fisher′s Effect Size = 0.5 ln (1 + r)
(1−r) . The effect size value is used as the final input data for meta-analysis. Both fixed effect model and random effect model were used in the meta-analysis, and a comparison between the model outputs is presented in a later section of this paper.
LITERATURE DESCRIPTION The systematic literature search shows an upward trend of academic publi- cation on the topic since 2009. Majority of the papers included in the meta-analysis were published within the last five years. Three different theo- retical perspective was used in explaining the casualty between the variables eco-innovation and firm performance in the articles used for this meta- analysis. While majority of the articles (30%) were written from the Resource Based View (RBV; (Barney, 1991)), a combination of RBV and institutional theory (DiMaggio & Powel, 1983) has been used in a significant number (20%) of studies as well. Also, 15% articles in the sample were written from institutional theory perspective. Rest of the paper used various theoretical aspects including corporate sustainability, first mover theory, agency theory, and organizational based view. The resource-based view suggest that a firm can attain competitive advantage using its strategical assets, which in turn benefits the firm financially (Barney, 1991). Institutional theory examines the process in which organizations are pressured by institutions (govern- ments, authorities etc.) to adopt similar strategic decisions for attaining social legitimacy (DiMaggio & Powel, 1983).
164 Mahmud
The included studies also vary in terms of empirical methodology. Majority of the studies were done using either the structural equation modelling (SEM) or partial least square structural equation modelling (PLS-SEM). However, some studies employed ordinary least squares, general least square, and quan- tile regression method in analyzing the data. Literatures investigating the relationship between financial performance (FP) and eco-innovation (ECIN) mainly employed two types of data collection method: - survey based data and secondary data from published annual reports. Apart from that, the extant literature shows that a substantial number of variables can mediate the relationship between the independent (FP) and dependent variable (ECIN).
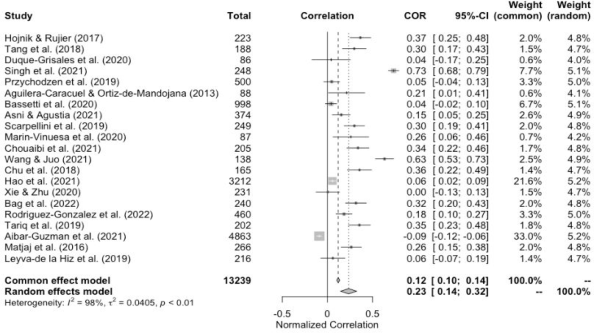
META ANALYSIS The meta-analysis included 21 independent studies (k = 21) and the total observation is 13239. with an effect size ranging from a minimum of 0.04 (Duque-Grisales et al. 2020; Bassetti et al. 2020) to a maximum of 0.73 (Singh et al. 2022). The confidence interval (95% CI) of individual studies suggests that there are several studies (see, e.g., Duque-Grisales et al., 2020; Przychodzen et al., 2019; Bassetti et al., 2019; Xie & Zhu, 2020; Leyva-de la Hiz et al., 2019) that seems to have reported an insignificant effect size of eco innovation.
The fixed effect model is suggesting that the mean effect size of eco inno- vation is 0.12 and the result is significant (p <0.001), which suggest that eco innovation positively impact a firm’s financial performance. Cohen et al. (2014) suggested that a correlation effect lower than 0.10 is low, from 0.10 to 0.30 is moderate, and above 0.30 is high correlation. Given the fact, in a fixed effect model the weight is distributed based on the observation size, it is found that the study of Aiber-Guzman et al. (2021) and Hao et al. (2021) were having the significant impact on the effect size of the fixed-effect model. The confidence interval (95% CI) of a fixed-effect model is usually low, which is only 4 points in this case (0.10 to 0.14). Interestingly, the mean effect size
Figure 1: Forest plot of the random and fixed effect model.
Eco Innovation and Firm Performance: A Meta Analysis 165
of the random effect model is 0.23 and the result is significant (p <0.001), suggesting that the impact of eco innovation on a firm’s financial perfor- mance is moderate. The confidence interval of the random effect model is suggesting that the effect size varies from 0.14 to 0.32 among the studies. A significant difference between the effect size of the fixed effect model and the random effect model is identified. The reason for such variation is caused by the weight distribution process in the fixed effect model.
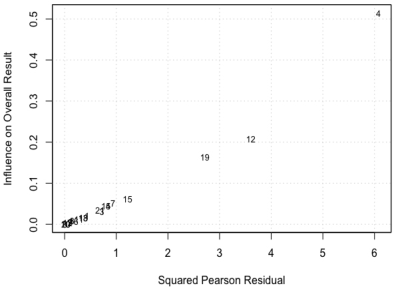
There are several statistics that represents heterogeneity in a meta-analysis including Q statistic, I2 statistic, and tau2 statistic. Each statistic has its merits and demerits, but for this study we find it rational to use I2 statistic as it represents the true heterogeneity in the effect size even when the number of studies is low in the meta-analysis. The I2 statistic is 97.7%, which is suggesting that there is a high degree of inconsistency among the studies in terms of effect size. Since the I2 measure does not tell us about the variation in the effect size (Borenstein et al., 2017). Hence, we calculate the prediction intervals as it explains how much the effect size varies around the studies. The prediction interval (PI) suggest that the effect size varies from −0.15 to 0.62, which is atypical. There could be several reasons for the heterogeneity among the effect sizes reported in the sample studies. For instance, studies in the sample have used several methodologies including structural equation modeling (SEM), Par- tial Least Square (PLS), SEM-PLS, Quantile Regression (QR), and others. While another reason for the heterogenous effect sizes could be the company sizes, industries, and number of respondents in the sample. To identify the influential power of individual studies in meta-analysis Baujat et al. (2002) proposed a graphical analysis method, which identifies the studies that has most influence on the heterogenous results. Using the Baujat chart (Figure 2) it is found that the result of Singh et al. (2022), Wang and Juo (2021), and Aibar-Guzman et al. (2021) significantly influence the heterogenous result of the meta-analysis. These three studies have used unique sources of data, which has resulted more unique effect sizes, and in turn these studies had high influence on the heterogeneity score of this meta-analysis. The plot of the random effect model shows better symmetry compared to the fixed effect
Figure 2: Baujat plot of meta-analysis.
166 Mahmud
model. However, it is clearly visible that these three studies are impacting the overall effect size of the meta-analysis.
Moderation of the Model Removing the identified outliers from the meta-analysis improve the overall heterogeneity in the effect size. However, the overall heterogeneity seems to be still high as the reported I2 score is 83.5%. Removing the outliers reduce the difference between the mean effect size of fixed effect model (0.14) and random effect model (0.20). In the next step of moderation, we remove the studies that exhibit insignificant effect sizes, which lead to a lower heteroge- neity (I2 = 37%). Removing the studies with low effect size (insignificant) shows that the mean effect size of both the fixed and random effect are the same (0.28) and the confidence interval (95% CI) range is less dispersed. The following table (Table 1) shows the summary outputs of three different pha- ses of the meta-analysis. Comparing the result of three different phases, it can be concluded that eco innovation has a moderate effect, as we find a mean effect size over.20 regardless of the heterogeneity statistic of the meta-analysis model.
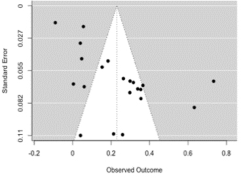
The funnel plots in (Figure 3) shows three different scenarios of the meta- analysis (3a – includes all 21 studies, 3b – includes 18 studies after removing the identified outliers, 3c – includes 12 studies after removing all studies with weak and insignificant effect sizes). The funnel plots shows that as we remove the outliers it becomes symmetrical compared to the first model, and when all the weak effect size studies are removed the funnel plot (3c) become more symmetrical.
The funnel plot in figure 3(a) is showing an asymmetric distribution of the studies, which indicate the probability of publication bias among the publica- tions. After removal of the identified studies that are having an outlier effect on the overall correlation between the dependent and independent variables, the distribution is still somewhat asymmetric, and the same can be observed
Eco Innovation and Firm Performance: A Meta Analysis 167
in the case of 3(c). This observation assists us in concluding that there might be a presence of publication bias.
SUBGROUP ANALYSIS It is highly probable that the country of study and company sizes in the sam- ple would have some impact on the heterogenous effect size reported in the study. Hence, we run the analysis using region and company size as subgroup. The selected studies were classified into 6 regions (1= Europe, 2 = North America, 3 = Asia, 4 = South America, 5 = Africa, 6 = Global), and the com- pany sizes were classified into 3 subgroups (1 = SMEs, 2 = Big Corporations, 3 = Mix).
Study Regions The result suggest that study region has a significant impact on the mean effect sizes as well as on the heterogeneity. The result of the regional analysis (Table 2) shows that the mean effect size as well as the heterogeneity score (I2) are substantially different from one cluster to another. There is little dif- ference between the effect size of random effect model (0.30) and fixed effect model (0.30) in studies conducted in the European region. Interestingly, the I2 score is suggesting a low heterogeneity of effect sizes. It suggests that the eco innovation has high impact on the companies operating in the European countries, which indicate the possibility of higher environmental awareness among the European consumers.
Similarly, in the North American region there is a small difference between the mean effect size of fixed and random effect models. The heterogeneity score is 73%, which is comparatively lower than the overall heterogeneity score of the meta-analysis (86%). Studies conducted in the Asian countries shows the highest difference in the mean effect (0.11 FE &0.20 RE) between fixed and Random effect models. Moreover, the I2 statistic of the region is 90%, suggesting a severe heterogeneity among the study results. One of the probable reasons for such variation in the effect sizes of the studies in the Asian region could be the company characteristics in the samples (e.g., size, industry etc.), which could be a potential topic for further investigation.
Company Size The result of the analysis shows that company size could have a moderation effect on the result of this meta-analysis. The difference between the mean
Table 2. Subgroup analysis based on region.
Table available in the original PDF paper.
Study Region Total Obs. FE Model RE Model I2 1 = Europe 1118 .30 [CI = .25 −.36] .30 [CI = .25 −.36] 0% 2 = North America 1958 .08 [CI = .03 −.12] .09 [CI = .00 −.18] 73% 3 = Asia 4372 .11 [CI = .08 −.13] .20 [CI = .08 −.32] 90% 4 = South America 86 .04 [CI = −.17 −.25] .04 [CI = −.17 −.25] N/A 5 = Africa 240 .32 [CI = .20 −.43] .32 [CI = .20 −.43] N/A 6 = Worldwide 216 .06 [CI = −.07 −.19] .06 [CI = −.07 −.19] N/A
168 Mahmud
Table 3. Subgroup analysis based on company size.
Table available in the original PDF paper.
Company Size Total Obs. FE Model RE Model I2 1 = SMEs 1090 .25 [CI = .20 −.31] .25 [CI = .13 −.37] 78% 2 = Big Companies 2918 .14 [CI = .10 −.17] .17 [CI = .08 −.26] 83% 3 = Mix 3982 .10 [CI = .07 −.13] .21 [CI = .07 −.34] 91%
effect size and heterogeneity score are distinct when company size is used to classify the selected studies. The result of the analysis is presented in Table 3, which shows that studies that used data from small and medium enterprises (SMEs) reported the highest impact (r = 0.25) of eco innovation on the firm’s performance. Further, we find no difference between the mean effect size (0.25) of the fixed effect and random effect model in case of SMEs. However, the I2 statistic of the subgroup is 78%, which represents high heterogeneity in the effect size. Moreover, the confidence interval (95% CI) is much higher in the case of random effect model. Interestingly, removing the study of Xie and Zhu (2020) from the sample change the heterogeneity score to a much lower level.
In case of big companies, the mean effect size shows a little difference between the fixed effect model (0.14) and random effect model (0.17). The confidence interval (95% CI) is lower compared to SMEs, which might be due to a higher number of total observations in the subgroup. However, there is high heterogeneity among the effect sizes (78%) which is almost like the other two subgroups. In the case of studies that used data from a mix of SMEs and Large corporations, a substantial difference between the mean effect size of fixed effect (0.10) and random effect (0.21) model is observed. Although, the total number of observations is the highest (3982) in this subgroup, the confidence interval (CI) range is higher in the RE model than the other two subgroups. Also, the I2 is the highest (91%) in this group. One probable reason for such result could be the variation in data due to the sampling method (the studies collected data from SMEs and Big companies, which naturally should vary substantially due to the size, financial capabilities, and market exposure etc.).
CONCLUSION
The meta-analysis is conducted to examine the published articles that exa- mine the causal relationship between eco-innovation and financial perfor- mance of firms that invest in environmentally sustainable innovation. The result of the meta-analysis reveals that eco-innovation is positive related to a firm’s financial performance, and the impact can be considered as moderate level impact (r > 0.20). Our analysis further revealed that, in the European region eco innovation pays of better than other regions in the world. Intere- stingly, small, and medium size enterprises receive higher benefits from green innovation compared to the big corporations. However, there is little evidence available from South America, North America, and African region. More evi- dence from these regions could further clarify the approximate quantitative
Eco Innovation and Firm Performance: A Meta Analysis 169
effect on a firm’s profitability from green investments. There are several limi- tations that might impact the interpretation of this meta-analysis including but not limited to low number of studies, time, and data collection approach. For identifying relevant studies, only three synonyms of eco innovation and firm performance were used, leaving the possibility of missing out several relevant studies.
ACKNOWLEDGMENT
I would like to thank the University of South-Eastern Norway (USN) for offering me the opportunity of doing independent research as a PhD scholar. Furthermore, I am greatful to my mentors Professor Vinit Parida and Asso- ciate Professor Thomas Brekke for their consistent support to my research endeavours.
REFERENCES
Aguilera-Caracuel, J., & Ortiz-de-Mandojana, N. (2013). Green Innovation and Financial Performance: An Institutional Approach. Organization & Environment, 26(4), 365–385. Aibar-Guzman, C., & Somohano-Rodriguez, F. M. (2021). Do Consumers Value
Environmental Innovation in Product? Administrative Sciences, 11(1), Article 33. Asni, N., & Agustia, D. (2021). The mediating role of financial performance in the relationship between green innovation and firm value: evidence from ASEAN countries. European Journal of Innovation Management. Bag, S., Dhamija, P., Bryde, D. J., & Singh, R. K. (2022). Effect of eco-innovation on
green supply chain management, circular economy capability, and performance of small and medium enterprises. Journal of Business Research, 141, 60–72. Barney, J. (1991). Firm Resources and Sustained Competitive Advantage. Journal of Management, 17(1), 99–120. Bassetti, T., Blasi, S., & Sedita, S. R. (2021). The management of sustainable deve-
lopment: A longitudinal analysis of the effects of environmental performance on economic performance. Business Strategy and the Environment, 30(1), 21–37. Chouaibi, S., Chouaibi, J., & Rossi, M. (2022). ESG and corporate financial performance: the mediating role of green innovation: UK common law versus Germany civil law. Euromed Journal of Business, 17(1), 46–71. Chu, Z. F., Wang, L. L., & Lai, F. J. (2019). Customer pressure and green innovations
at third party logistics providers in China: The moderation effect of organizational culture. International Journal of Logistics Management, 30(1), 57–75. Cooper, H. (2015). Research synthesis and meta-analysis: A step-by-step approach (Vol. 2). Sage publications. DiMaggio, P. J., & Powell, W. W. (1983). The iron cage revisited: Institutional isomor-
phism and collective rationality in organizational fields. American sociological review, 147–160. Doran, J., & Ryan, G. (2016). The Importance of the Diverse Drivers and Types of Environmental Innovation for Firm Performance. Business Strategy and the Environment, 25(2), 102–119. Duque-Grisales, E., Aguilera-Caracuel, J., Guerrero-Villegas, J., & Garcia-Sanchez,
E. (2020). Does green innovation affect the financial performance of Multilatinas? The moderating role of ISO 14001 and R&D investment. Business Strategy and the Environment, 29(8), 3286-3302.
170 Mahmud
Garcia-Marco, T., Zouaghi, F., & Sanchez, M. (2020). Do firms with different levels of environmental regulatory pressure behave differently regarding complementa- rity among innovation practices? Business Strategy and the Environment, 29(4), 1684–1694. Guo, Y., Wang, L., & Chen, Y. (2020). Green Entrepreneurial Orientation and Green
Innovation: The Mediating Effect of Supply Chain Learning. SAGE Open, 10(1), 2158244019898798. Hao, X. Y., Chen, F. L., & Chen, Z. F. (2022). Does green innovation increase enterprise value? Business Strategy and the Environment, 31(3), 1232–1247. Hojnik, J., & Ruzzier, M. (2017). Does it pay to be eco? The mediating role of
competitive benefits and the effect of ISO14001. European Management Journal, 35(5), 581–594. Hu, D., Qiu, L., She, M. Y., & Wang, Y. (2021). Sustaining the sustainable development: How do firms turn government green subsidies into financial perfor- mance through green innovation? Business Strategy and the Environment, 30(5), 2271–2292. Leyva-de la Hiz, D. I., Ferron-Vilchez, V., & Aragon-Correa, J. A. (2019). Do
Firms’ Slack Resources Influence the Relationship Between Focused Environmen- tal Innovations and Financial Performance? More is Not Always Better. Journal of Business Ethics, 159(4), 1215-1227. Liao, Z. J., Dong, J. C., Weng, C., & Shen, C. (2019). CEOs’ religious beliefs and the environmental innovation of private enterprises: The moderating role of politi- cal ties. Corporate Social Responsibility and Environmental Management, 26(4), 972–980. Marin-Vinuesa, L. M., Portillo-Tarragona, P., & Scarpellini, S. (2017). Firms’ capabi-
lities management for waste patents in a circular economy. International Journal of Productivity and Performance Management. Marin-Vinuesa, L. M., Scarpellini, S., Portillo-Tarragona, P., & Moneva, J. M.
(2020). The Impact of Eco-Innovation on Performance Through the Measure- ment of Financial Resources and Green Patents. Organization & Environment, 33(2), 285–310. Matjaz, M., Maletic, D., Dahlgaard, J. J., Dahlgaard-Park, S. M., & Gomiscek, B.
(2016). Effect of sustainability-oriented innovation practices on the overall orga- nisational performance: an empirical examination. Total Quality Management & Business Excellence, 27(9-10), 1171–1190. Przychodzen, W., Leyva-de la Hiz, D. I., & Przychodzen, J. (2020). First-mover advantages in green innovation-Opportunities and threats for financial performa- nce: A longitudinal analysis. Corporate Social Responsibility and Environmental Management, 27(1), 339–357. Ramanathan, R., Black, A., Nath, P., & Muyldermans, L. (2010). Impact of envi-
ronmental regulations on innovation and performance in the UK industrial sector. Management Decision, 48(10), 1493–1513. Rodriguez-Gonzalez, R. M., Maldonado-Guzman, G., & Madrid-Guijarro, A.
(2022). The effect of green strategies and eco-innovation on Mexican automo- tive industry sustainable and financial performance: Sustainable supply chains as a mediating variable. Corporate Social Responsibility and Environmental Management. Rosenthal, R., & DiMatteo, M. R. (2001). Meta-Analysis: Recent Developments in Quantitative Methods for Literature Reviews. Annual Review of Psychology, 52(1), 59–82.
Eco Innovation and Firm Performance: A Meta Analysis 171
Scarpellini, S., Marin-Vinuesa, L. M., Aranda-Uson, A., & Portillo-Tarragona, P.
(2020). Dynamic capabilities and environmental accounting for the circular eco- nomy in businesses. Sustainability Accounting Management and Policy Journal, 11(7), 1129–1158. Singh, S. K., Del Giudice, M., Jabbour, C. J. C., Latan, H., & Sohal, A. S. (2022).
Stakeholder pressure, green innovation, and performance in small and medium- sized enterprises: The role of green dynamic capabilities. Business Strategy and the Environment, 31(1), 500–514. Tang, M. F., Walsh, G., Lerner, D., Fitza, M. A., & Li, Q. H. (2018). Green Innovation, Managerial Concern and Firm Performance: An Empirical Study. Business Strategy and the Environment, 27(1), 39-51. Tariq, A., Badir, Y., & Chonglerttham, S. (2019). Green innovation and perfor-
mance: moderation analyses from Thailand. European Journal of Innovation Management, 22(3), 446–467. Wang, C. H., & Juo, W. J. (2021). An environmental policy of green intellectual capital: Green innovation strategy for performance sustainability. Business Strategy and the Environment, 30(7), 3241–3254. Xie, X. M., & Zhu, Q. W. (2020). Exploring an innovative pivot: How green trai-
ning can spur corporate sustainability performance. Business Strategy and the Environment, 29(6), 2432–2449. Xie, X. M., Hoang, T. T., & Zhu, Q. W. (2022). Green process innovation and financial performance: The role of green social capital and customers’ tacit green needs. Journal of Innovation & Knowledge, 7(1), Article 100165. Yao, Q., Zeng, S. Z., Sheng, S. B., & Gong, S. Y. (2021). Green innovation and
brand equity: moderating effects of industrial institutions. Asia Pacific Journal of Management, 38(2), 573-602. Yi, Y. L., Zeng, S. X., Chen, H. Q., & Shi, J. J. (2021). When Does It Pay to Be Good?
A Meta-Analysis of the Relationship Between Green Innovation and Financial Performance. Ieee Transactions on Engineering Management. Yin, C. L., Salmador, M. P., Li, D., & Lloria, M. B. (2022). Green entrepreneurship and SME performance: the moderating effect of firm age. International Entrepreneurship and Management Journal, 18(1), 255–275.
LISTED IN THE AHFE DIGITAL BOOKSTORE CATALOGUE
Explore the complete digital volume
Creativity, Innovation and Entrepreneurship
Read this individual research paper free through the original publisher, or explore the full digital proceedings book.
ISBN 978-1-958651-50-6
Explore this ISBN in the AHFE Bookstore ↗Listed in the July 2026 bookstore catalogue; search by ISBN to confirm current availability · Digital book purchase optional