The COVID-19 pandemic has made a huge impact on various aspects of life around the globe. An important step in tackling issues caused by COVID-19 and other thoracic pathologies is to find approaches that will automate the detection of such diseases from medical images. Medical images such as chest x-rays are widely available around the globe. Traditional medical image classification techniques required extensive work for finding distinctive features in medical images and using them for building accurate models for classification. The modern approaches are highly focused on using models based on machine learning for similar tasks. Convolutional Neural Networks (CNNs) are a type of artificial neural network based upon the mathematical linear operation called convolution. CNNs have a few different layers and are widely used for computer vision tasks. A major advantage of CNNs is that they could extract spatial features from images automatically. In this work, various convolutional neural networks are implemented and tested for the classification of chest x-ray images from four classes of normal, viral pneumonia, lung opacity, and Covid-19. The most efficient model achieves an accuracy of 90.69% and a recall and precision of 91.25% and 92.03% across all four classes.
Medical images such as chest X-rays are widely available around the globe. Analyzing these images could help identify valuable medical information about the patients which could lead to more efficient healthcare systems around the world. However, detection of thoracic pathologies in chest X-ray images comes with its own challenges. A major challenge is that in many rural areas, access to radiologist level expertise is highly limited. Even in the presence of radiologist level expertise, it would be very time-consuming for a radiologist to analyze a huge number of chest X-ray images to detect thoracic pathologies in patients. Moreover, since medical diagnosis is a very sensitive task, finding solutions that will lead to accurate detection are of high importance. In this specific situation, the challenges associated with detection of thoracic pathologies even in the presence of radiologist level expertise, emphasizes the need for coming up with other solutions for this problem.
Advancements in artificial intelligence have led researchers to find new ways for medical image classification tasks. Machine learning, which is a subset of artificial intelligence has paved the way for designing highly effici- ent models for medical diagnosis tasks. Thus, huge efforts have been made to detect diseases by designing and utilizing automated models. Therefore, it makes sense to try to implement automated models for classifying chest x-ray images from different classes such as COVID-19. COVID-19 is a respira- tory disease which could lead to respiratory failure, acute respiratory distress
Classification of Thoracic Pathologies by Using Convolutional Neural Networks 675
syndrome, organ failure, and even death in extreme cases. Thus, finding solu- tions for distinguishing between various classes of thoracic pathologies could highly benefit healthcare systems.
Creating automated models for medical image classification comes with its own challenges. Classical image classification techniques required extensive work for finding distinctive features in medical images. More recent work has been focused on using models based on machine learning for similar tasks. However, there are still many details that should get considered when using machine learning for medical image classification. An important considera- tion is the data used for training and validating the model. In other words, it is important to understand if a model has generalization and that it could get used in real world medical diagnosis applications. A model that has been overfitted on the training data might not work properly on never seen test data. Convolutional Neural Networks (CNNs) are a type of artificial neural network based upon the mathematical linear operation called convolution. CNNs have a few different layers and are widely used for computer vision tasks. A major advantage of CNNs is that they could extract spatial featu- res from images automatically. Thus, researchers have built various models based on CNNs for different image classification tasks. A major benefit of CNNs is the ability to detect patterns in input images without the need for human intervention.
BACKGROUND
Medical Image Classification The term image classification has received a lot of attention in computer vision and refers to the process of creating a label for an input image (Cohen 2020). Medical image classification is a branch of image recognition, and the major goal is to improve medical treatment for patients. The created model tries to extract the most informative features from the images and build an accurate model for classification based upon the extracted features. As men- tioned earlier, CNNs have shown to be highly effective for creating models that could perform such tasks. The major building blocks of CNNs are the convolutional layer, pooling layer, and fully-connected layer.
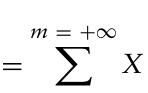
Convolutional Layer The convolution layer has the linear operation of convolution and might combine it with a non-linear activation function which was discussed in the previous section. In the convolution layer, a filter or kernel gets convolved by the input. For instance, in the case of an image, we could think of the input image as a matrix of pixel values (Yamashita et al. 2018; Albawi et al. 2017; O’Shea & Nash 2015). The mathematical formula for discrete convolution between two functions such as X[n] and Y[n] is as follows:
Equation reproduced from the original PDF.
676 Vajar and Anpalagan
In images such as RGB images the depth size is 3 which means that there are 3 different channels of “Red”, “Green”and “Blue”. In the case of 3 channels, the kernel or filter and the output would also have 3 channels which means that the filter is getting convolved with all the channels of the input. The ker- nel or filter slides over the values of the input and the sum of the element-wise product of kernel and input values is calculated and put into the correspon- ding position in the output. The output has also been called a feature map as it is able to extract features from the input image. The stride refers to the distance between two consecutive kernels or filters getting applied on the input. Increasing the stride has a downsampling effect on the feature maps created, which means that the dimensions of the output are reduced. Let us assume that we have an image with a size of n × n × 1 and the kernel or filter size is f × f × 1.
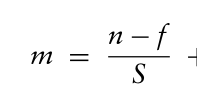
For a stride of S, the size of the output or feature map would be m × m × 1 and m is calculated as follows:
Equation reproduced from the original PDF.
S + 1
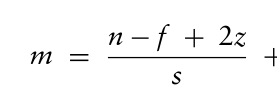
One of the issues in using convolution layers is that the when the filter is sliding over the input image, information from borders of the image could get lost. Furthermore, while using convolution layers, the dimension of the output feature map is reduced compared to the dimensions of the input image. One way to tackle these challenges is to use zero-padding. Zero padding refers to padding zeros to the borders of the input image. If we assume a layer size of z for the zero-padding process, the formula for the same image size, filter size and stride will get modified as follows:
Equation reproduced from the original PDF.
s + 1
Pooling Layer The next layer used in CNNs is the pooling layer which is a downsampling technique that reduces the dimensionality of the feature maps created. An important contribution of the pooling layer is that in reduces the number of parameters which in turn reduces the computational complexity of the model by reducing the size of feature maps. One of the most used pooling methods is called max-pooling which is performed by only considering the maximum input value in each part of the input image (Yamashita et al. 2018; Albawi et al. 2017; O’Shea & Nash 2015).
Fully Connected Layer The next layer in CNNs is called the fully connected layer or dense layer. Unlike the convolution layer and pooling layer that are used for extracting informative features from the input image, the fully connected layer is a neu- ral network used for classifying the images. The resulting feature maps from the convolution and pooling layer get flattened first. This means that the fea- ture maps are transformed into a one-dimensional vector and then fed into the fully connected layer as inputs. In the fully connected layer, the neurons
Classification of Thoracic Pathologies by Using Convolutional Neural Networks 677
in each layer are connected to all the neurons in the next layer. Furthermore, it is very important to apply an appropriate activation function to the last layer of a fully connected layer. For problems in binary classification, sigmoid is an appropriate activation function whereas for multiclass classification, SoftMax is usually utilized. images without the need for human intervention.
MATERIALS AND METHODS
In this section, the dataset and the classes and attributes of the image data present in the dataset will be discussed. Furthermore, data preprocessing techniques used for this work (such as image data augmentation and nor- malization) are explained in this chapter. The models developed for the task of classification are presented in this chapter. Moreover, the reasons for choosing these types of architecture and the parameters will be elaborated upon.
Dataset Radiologists capture Chest X-ray images by X-ray radiation which could display abnormalities in the patient’s chest or surrounding areas of the body. The data used for this work is based on (Chowdhury et al. 2020; Rahman et al. 2021) and can be found on the Kaggle website. The dataset was crea- ted by integrating chest X-ray images from various sources. The images are labelled by utilizing various methods such as laboratory tests, radiologist level diagnosis, and medical history of the patients. The version of the dataset used for this work contains 21165 chest X-ray images belonging to 4 classes. There are 3616 samples for the COVID-19 class, 6012 samples for the lung opacity class, 1345 samples for the viral pneumonia class, and 10192 samples for the normal class. All the chest X-ray images in the dataset have a Portable Graphics Format (PNG) and have a size of 299 × 299.
Proposed Method and AI Techniques In the past few years, CNNs have shown to be highly effective for various tasks in object recognition and image classification. The reason is that CNNs can detect local and global discriminant features from images. and achieve high accuracy of detection for many applications concerned with images. Furthermore, researchers’ examinations in the literature review demonstra- ted that CNNs could also be highly effective for diagnosis of diseases from medical images such CT scans, chest X-rays, and so on. Thus, we can see extensive research on the usage of CNNs for image classification even prior to the start of the COVID-19 pandemic. For instance, CNNs had shown to be highly effective for detecting pneumonia or tuberculosis from other thoracic pathologies in chest X-ray images of patients. Therefore, extensive research has been performed to find architectures based on CNNs for the task of COVID-19 detection.
Data Preprocessing For this work, all the images in the dataset are first resized to 256 × 256. Moreover, all the images in the dataset are normalized prior to feeding them
678 Vajar and Anpalagan
to the network. As seen in the literature review, image data normalization is a standard procedure and is performed by scaling the range of intensity values for the pixels of the images.
Various factors make the creation of large datasets of labelled medical ima- ges a very challenging task. One of the factors is that annotating the images requires radiologist level expertise which makes it more time and cost consu- ming compared to creating datasets of labelled images for other applications. Furthermore, privacy is one of the most important aspects of an effective healthcare system and could make the process of accessing medical images more difficult. The lack of labelled medical image data for training mach- ine learning models could reduce the efficiency of the models. Therefore, in many cases, researchers use data augmentation to increase the size and qua- lity of the training dataset which could potentially increase the accuracy of the automated model that is built.
In this paper, data augmentation is used to help the models better learn variations of images from all four classes studied in this work. Inspired by the literature, only horizontal flipping is used as an image data augmenta- tion technique. As the name suggests, horizontal flipping refers to flipping the pixels of chest X-ray images over the horizontal axis and then feeding these new variations alongside the original images to the network which will increase the number of variations the model has learned.
CNN Architecture When building a CNN, there are various factors to consider based upon the application in hand. These factors include the choice for number of layers, kernel sizes, types of layers, optimizer type, activation functions and more. In this paper, the most efficient model is built based upon a combination of literature review analysis and an empirical approach that will increase classification accuracy whilst keeping an acceptable computational overhead in mind.
The seven models developed for this work are as follows:
1) Model 1 is a 3-layer CNN with 32, 64, and 128 kernels of size 3 × 3 in all convolutional layers. 2) Model 2 is a 4-layer CNN with 32, 64, 128, and 256 kernels of size 3 × 3 in all convolutional layers. 3) Model 3 is a 5-layer CNN with 32, 64, 128, 256, and 512 kernels of size 3 × 3 in all convolutional layers. 4) Model 4 is a 5-layer CNN with 32, 64, 128, 256, and 256 kernels of size 3 × 3 in all convolutional layers. 5) Model 5 is a 5-layer CNN with 32, 64, 128, 256, and 128 kernels of size 3 × 3 in all convolutional layers. 6) Model 6 is a 5-layer CNN with 32, 64, 128, 256, and 256 kernels in all convolutional layers. The filter size in all convolutional layers is set to 3 × 3 except for the first layer which has a 7 × 7 filter size. This is to check whether a larger filter size will improve the performance of the model.
Classification of Thoracic Pathologies by Using Convolutional Neural Networks 679
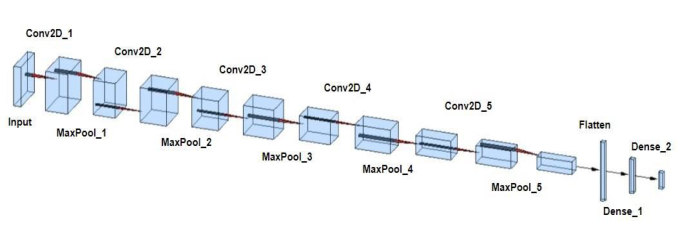
Figure 1: Architecture of the most efficient model.
7) Model 7 is a 5-layer CNN with 32, 64, 128, 256, and 256 kernels in all convolutional layers. The filter size in the first and second layers is set to 7 × 7 and 1 × 1, respectively. This is to investigate whether the addition of a smaller filter size after a larger filter size will improve the performance of the model. The last three convolutional layers have a filter size of 3 × 3.
The most efficient model developed in this work is a 5-layer CNN with 32 filters or kernels in the first layer and 64, 128, 256, and 256 in the next four layers, respectively (Figure 1). It is standard procedure to choose powers of 2 for the number of filters in each convolutional layer and gradually increase the number of kernels as more convolutional layers are added to the model. Furthermore, an empirical approach for the number of kernels is required to improve the overall accuracy of the model and increase feature extraction efficacy. The choice of kernel size in different layers is another important aspect of CNNs. A larger kernel size such as 7 × 7 is used for instances where an overall view of the pixels of the input image data is more informative. On the other hand, a smaller kernel size could potentially capture local features from pixels of the input chest X-ray images. All the convolutional layers in the most efficient model have a kernel size of 3 × 3 to create a balance between locality and globality of feature extraction.
The stride chosen for all the models developed for this work is the default which is a stride of one. Non-linear activation functions have could help models learn non-linear relationships in the data and improve the efficacy of machine learning models (Goodfellow et al. 2016). The ReLU non-linearity is a common choice for the activation functions of the convolutional layers which has been added to all the models. After each convolutional layer, a poo- ling layer is added to reduce spatial dimensionality of the extracted features. The type of pooling layer used for all the layers is 2 × 2 max-pooling. More- over, a flatten layer is added to convert the outputs of the last convolutional layer into a one-dimensional vector. Finally, two fully connected layers are added to complete the architecture of the model. For the last layer, the Sof- tMax nonlinearity is chosen instead of the ReLU activation function which is a common choice for instances where more than two classes of chest X-ray images are getting classified. Since the models are classifying images into four classes of COVID-19, normal, viral pneumonia, and lung opacity, the final
680 Vajar and Anpalagan
dense layer has four outputs where each one is representing one of the four classes.
In machine learning models, loss functions are used to evaluate the dif- ference between model predictions and the actual value for each data point (Goodfellow et al. 2016). The sparse categorical cross entropy is the chosen loss function which is a common choice for similar image classification tasks that involve two or more classes. For optimization, the Adaptive Moment Estimation or in short Adam optimizer is used (Kingma & Ba 2014). Adam has various advantages such as decreased memory consumption and impro- ved learning and has been extensively used for various applications of deep neural networks.
EXPERIMENTAL RESULTS In this section, evaluation metrics used to compare the effectiveness of vari- ous models are explained. Furthermore, seven models are developed and tested based on various metrics for the 4-class classification (COVID-19 vs lung opacity vs normal vs viral pneumonia) task. Finally, comparison of the developed models is discussed. Various evaluation metrics such as accuracy, precision, recall, are F1 score is used for this work. An important aspect of evaluating CNN models for medical image classification is to find out the efficacy of the model for detecting true positive (tp) cases. For instance, in the case of COVID-19, tp refers to the number of cases that were predicted as COVID-19 positive by the model and are also labelled COVID-19 positive in the dataset. On the other hand, true negative (tn) cases would be the num- ber of cases that were predicted as COVID-19 positive by the model and are also labelled COVID-19 positive in the dataset. For this example, false posi- tive (fp) refers to instances where a sample is precited as COVID-19 positive by the model but is labelled COVID-19 negative in the dataset. Finally, false negative (fn) refers to instances where a sample is precited as COVID-19 negative by the model but is labelled COVID-19 positive in the dataset. The importance of these factors, specially in medical tasks is that even a sli- ght error could have devastating outcomes for healthcare systems and the patients.
F1 score is an evaluation technique which is calculated by the following formula:
F1score = 2 × Precision × Recall Precision + Recall where precision and recall are calculated by the following formulas:
Precision = tp tp + fp Recall = tp tp + fn
Furthermore, confusion matrix is commonly used to provide a visual understanding of the derived models’ efficacy for each class of the dataset. Due to the input data type which is chest X-ray images and the fact that
Classification of Thoracic Pathologies by Using Convolutional Neural Networks 681
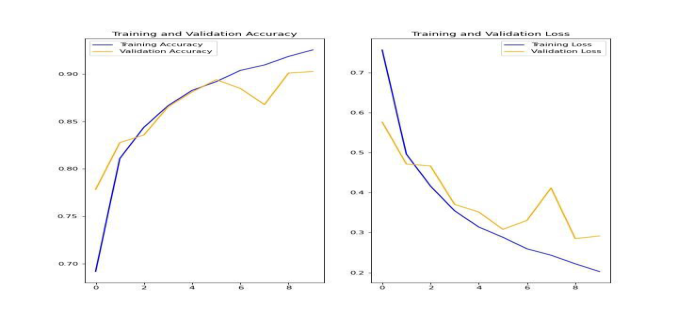
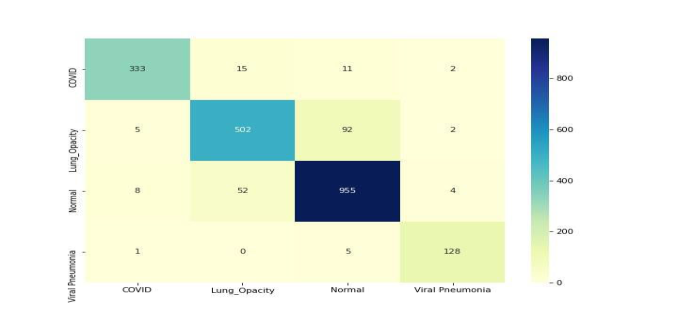
Figure 2: Comparison of training and validation loss and accuracy for model 4.Figure 3: Confusion matrix for model 4.
there are over 20000 images in the dataset, the experiments were conducted using Graphics Processing Unit (GPU). All the experiments and model develo- pments were conducted on the Amazon SageMaker platform. The training, validation, and test splits were 70%, 10%, and 20% respectively. Figure 2 displays the comparison of training and validation accuracy and, training and validation loss for the most efficient model. The confusion matrix for this model is presented in Figure 3. To compare the efficiency of all seven models, table 1 displays the comparison of all seven models based on test accuracy, average recall, and average precision.
CONCLUSION
In this work, seven CNN based models were implemented and evaluated for the 4-class (COVID-19 vs lung opacity vs normal vs viral pneumonia) classifi- cation task of classifying images from chest X-ray images. The most efficient model (model 4) achieves a test accuracy, recall, and precision of 90.69%, 91.25%, and 92.03%, respectively. Classifying images from the lung opacity
682 Vajar and Anpalagan
Table 1. Comparison of test accuracy, average precision, and average recall.
class is the most challenging among all classes. However, the addition of new classes increases the robustness of the developed models.
REFERENCES
Albawi, Saad, Tareq Abed Mohammed, and Saad Al-Zawi. “Understanding of a convolutional neural network.” In 2017 International Conference on Engineering and Technology (ICET), pp. 1–6. Ieee, 2017. Chowdhury, Muhammad EH et al., “Can AI help in screening viral and COVID-19
pneumonia?.” IEEE Access 8 (2020): 132665–132676. Cohen, Stanley. Artificial Intelligence and Deep Learning in Pathology E-Book.
Elsevier Health Sciences, 2020. Goodfellow, Ian, Yoshua Bengio, Aaron Courville, and Yoshua Bengio. Deep learning. Vol. 1, no. 2. Cambridge: MIT press, 2016. Kingma, Diederik P., and Jimmy Ba. “Adam: A method for stochastic optimization.”
arXiv preprint arXiv:1412.6980 (2014). O’Shea, Keiron, and Ryan Nash. “An introduction to convolutional neural networks.” arXiv preprint arXiv:1511.08458 (2015). Rahman, Tawsifur et al., “Exploring the effect of image enhancement techniques
on COVID-19 detection using chest X-ray images.” Computers in biology and medicine 132 (2021): 104319. Yamashita, Rikiya, Mizuho Nishio, Richard Kinh Gian Do, and Kaori Togashi.
“Convolutional neural networks: an overview and application in radiology.” Insights into imaging 9, no. 4 (2018): 611–629.
Read this individual research paper free through the original publisher, or explore the full digital proceedings book.
ISBN 978-1-958651-44-5
Explore this ISBN in the AHFE Bookstore ↗Listed in the July 2026 bookstore catalogue; search by ISBN to confirm current availability · Digital book purchase optional