Kosuke Sato, Kazunori Kaede, Keiichi Watanuki (2025). Estimation of Intellectual Productivity Using Electrocardiograms during Computational Tasks with Cognitive Load. In: Affective and Pleasurable Design. AHFE Open Access, vol. 164, pp. 24–31. https://doi.org/10.54941/ahfe1006057
Long working hours have recently become a major problem in Japan. A means of eliminating long working hours is to improve factories. Thus far, understanding current work efficiency and establishing an estimation method to support it is essential. Understanding the work efficiency of individual workers allows us to propose efficiency improvement measures suited to each worker that contribute to eliminating long working hours and improving the working environment. Working long hours increases cognitive load and decreases work efficiency. With the development of information technology, tasks requiring cognitive load to capture and process information have increased, further affecting workers. Cognitive load refers to the amount of information processed by the working memory of the brain, and processing new information and completing tasks is believed to become more difficult when the cognitive load is increased. Therefore, in this study, we focused on tasks requiring cognitive load and examined a method for estimating work efficiency. In previous studies on cognitive load and work efficiency, biometric information was often used to evaluate cognitive load. Yamaguchi reported an increase in the LF and LF/HF components, indicators of sympathetic activity, and a decrease in the HF component, an indicator of parasympathetic activity, using a time-series frequency analysis of heart rate variability during continuous additive work. Mishima measured the cerebral blood flow in the prefrontal cortex during a verbal fluency task using fNIRS and reported increases in the relative values of oxygenated and total hemoglobin levels. These results suggest that biological information, such as heart rate variability and cerebral blood flow, is effective in assessing cognitive load. However, to date, there has been no research on the quantitative estimation of work efficiency under cognitive load using biometric information. In my research, I attempted to estimate work efficiency using cerebral blood flow in the prefrontal cortex. However, owing to the high cost of measurement devices and the burden of wearing them, issues remain in terms of practicality in the daily working environment. Therefore, in this study, we focused on electrocardiography as a biometric information that can be obtained more routinely and measured during a continuous addition task to establish a method to evaluate work efficiency. A machine learning method was used to estimate work efficiency, and a convolutional neural network (CNN) was used as the learning model. The continuous addition task in the experiment was performed on a VDT screen for 20 min, and the number of correct answers in 30 s was used as task efficiency. Additionally, electrocardiograms were obtained during the experiment. Learning models were created for each participant. The biometric data were time-series data, and CNN was used for feature extraction. PFI was used to evaluate the importance of each heart rate variability index.
In recent years, the proportion of tasks involving cognitive load has increased in Japan owing to the advancement of information technology. This increase has led to an increase in long working hours with cognitive load, which has become a significant issue. Improving intellectual productivity is crucial to reducing the time spent on cognitively demanding tasks. Research on productivity enhancement suggests the effectiveness of motivation improvement systems through the visualization of work efficiency (Daniel et al., 2024). According to previous studies, providing positive feedback that displays the amount of work completed by an individual can help them evaluate their actions, enhance their willingness to improve, and provide a sense of reassurance and achievement to the recipient, which could increasing
Estimation of Intellectual Productivity Using Electrocardiograms 25
their motivation. However, the direct measurement of the efficiency of cognitively demanding tasks remains challenging.
Therefore, research has been conducted to evaluate productivity by capturing changes in cognitive function using electrocardiography (ECG). A study that used heart rate variability indices to detect cognitive function changes (Tsunoda et al., 2016) reported that estimation was possible for 70% of the participants but difficult for the remaining 30% owing to individual differences. In addition, the current challenges for practical applications include large estimation errors, difficulty in personal optimization owing to the creation of a generalized model for all participants, and the challenge of real-time estimation when using heart rate variability indices. To address these challenges, potential solutions include improving the accuracy using deep learning techniques, developing personalized models, and enabling real- time estimation using raw ECG data. Therefore, the objective of this study is to develop an intellectual productivity estimation model based on the ECG of each participant using machine learning. A convolutional neural network (CNN) was used to extract features from time series data to construct an intellectual productivity estimation model.
CONTINUOUS ADDITION TASK EXPERIMENT FOR ESTIMATING INTELLECTUAL PRODUCTIVITY In this experiment, a continuous addition task modeled after the Uchida– Kraepelin test (Uchida, 1957) was created to estimate individual intellectual productivity using ECG data. During the task, ECG measurements were conducted. The participants were eight Japanese males (aged 23.0 ± 1.0 yr), and each participant performed the experiment five times. This study was approved by the Ethics Committee for Human Research at Saitama University (R5-E-4), and written informed consent was obtained from all participants.
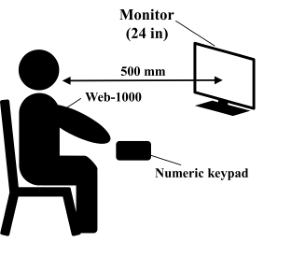
The experimental environment and protocol are shown in Figures 1 and 2, respectively. For the ECG measurements, a multichannel physiological measurement device, the Web-1000 (Nihon Koden Corporation) was used with a sampling frequency of 1 kHz. During the experiment, participants were seated 0.5 m away from the monitor, and input was standardized such that it could be provided using only the dominant hand on a numeric keypad.
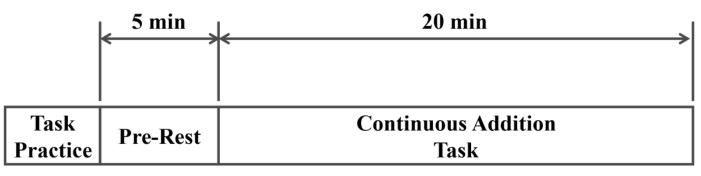
The experiment consisted of three phases: task practice, a 5 min pre- rest period, and a 20 min task session. Task practice was conducted to eliminate the effects of becoming accustomed to using a numeric keypad and performing the task. During the practice, participants were instructed to “Continue until the task speed becomes constant” to ensure that they could perform the task at a stable pace. After practice, a 5 min pre-rest period was provided, and this was followed by a 20 min continuous additional task. To avoid influencing the participants’ perception of time, the task duration was not disclosed.
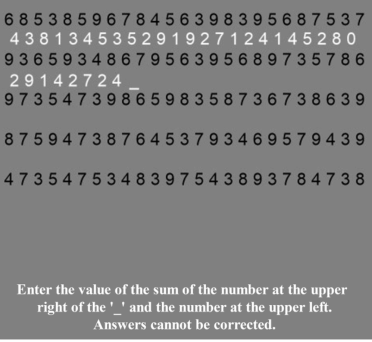
The continuous addition task used in this experiment is illustrated in Fig. 3. In this task, participants calculated the sum of two adjacent numbers from a randomly displayed sequence on the screen and entered the last digit of the
sum using a numeric keypad. This task followed the format of the original Kraepelin test, with a new sequence displayed every minute, regardless of the number of answers provided. Additionally, the bottom of the task screen displayed the following instruction: “Enter the value of the sum of the number at the upper right of the ‘_’ and the number at the upper left. Answers cannot be corrected.”
Estimation of Intellectual Productivity Using Electrocardiograms 27
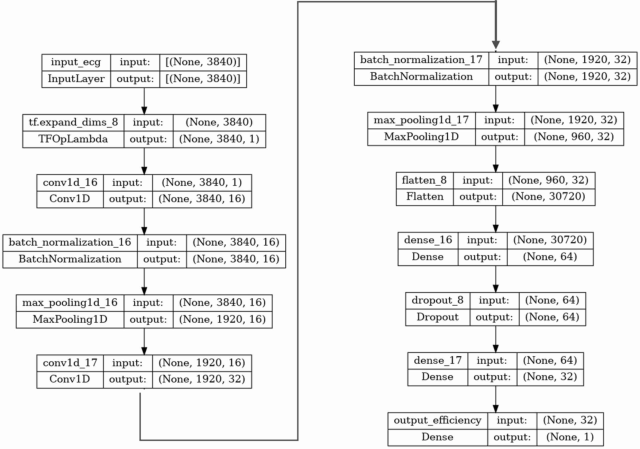
INTELLECTUAL PRODUCTIVITY ESTIMATION MODEL The structure of the model is illustrated in Fig. 4. In this model, ECG data obtained at 1 kHz were used as explanatory variables, and the data were resampled to 128 Hz to enable the extraction of the RR intervals (RRI). In this study, intellectual productivity was defined as the amount of output per unit of time, and the number of correct answers in the continuous addition task over a 30 s period was used as the objective variable for the model. Each variable was obtained using a 30 s time window, and data were acquired by shifting the frame by 1 s throughout the task period. A total of 5,855 data points per participant were obtained over the course of the five experiments. Additionally, standardization was applied to both the input and output data to standardize the scales of the variables.
To split the data into training, validation, and test datasets, a k-fold cross-validation method (k = 3) was employed. The data were divided into training (53.3%), validation (26.7%), and testing (20%) datasets. The validation data were used for hyperparameter tuning and overfitting detection.
This regression model estimates intellectual productivity by extracting features from ECG data using a CNN and inputting these features into fully connected layers. ReLU functions were used as the activation functions for both the convolutional and fully connected layers, whereas a linear function was used for the output layer. Batch normalization was applied to the outputs of each convolutional and fully connected layer to stabilize and accelerate learning. Additionally, dropout was applied after the fully connected layers with a probability of 0.5 to prevent overfitting and enhance the generalization performance of the model.
Figure 4: Machine learning model shape.
The Huber loss was used as the loss function in this model. The Huber loss combines the advantages of the mean squared error (MSE) and mean absolute error (MAE). The learning rate was adjusted from 0.0005 to 0.0001 using the ReduceLROnPlateau, which monitors the behavior of the loss function and lowers the learning rate when the loss does not decrease. In this model, if the loss did not decrease over 20 epochs, then the learning rate was reduced to 20% of the previous value. The number of epochs was set to 200.
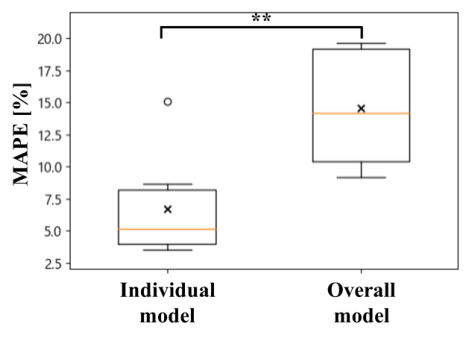
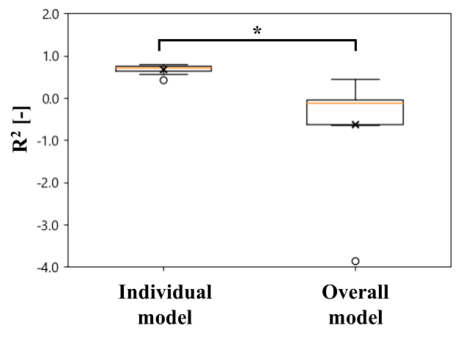
The MAPE and R2 were used as metrics to evaluate the test data. The MAPE indicates the percentage of prediction errors. In this study, two types of models were constructed, namely, individual models for each participant and an overall model using data from all participants, and their performances were compared.
RESULTS
The learning results of the model are as follows. In the individual and overall models, the values of the loss function for the training and validation data were stable at the final epoch, indicating that the learning process converged and that the model training was successful.
Next, the individual and overall models were compared. For the overall model, all the data from each participant were used as test data, and the evaluation metrics were calculated. A paired t-test was conducted on the evaluation metrics obtained from the individual and overall models. The results of this t-test are shown in Figures 5 and 6. For the MAPE, the individual models were significantly lower at the 1% significance level. Moreover, for R2, the individual models were significantly higher at the 5% significance level. The MAPE results indicate that the individual models provided more accurate estimations than did the overall model. Additionally, the R2 value showed that the individual models had higher explanatory power than did the overall model.
The evaluation metrics for the individual models are listed in Table 1. According to the MAPE and R2 for each participant, the individual models achieved medium to high accuracy in estimating intellectual productivity.
Table 1: Evaluation of the test data of the experimental participants.
Table available in the original PDF paper.
Participants MAPE [%] R2 score [-] A 15.1 0.426 B 8.63 0.665 C 3.88 0.712 D 8.05 0.555 E 3.99 0.806 F 4.27 0.775 G 3.52 0.729 H 5.95 0.742 Mean 6.67 0.676
Estimation of Intellectual Productivity Using Electrocardiograms 29
These results suggest that it is possible to estimate intellectual productivity on an individual basis using electrocardiography. These results can be explained by the Yerkes–Dodson law (Yerkes and Dodson, 1908).
The Yerkes–Dodson law states that performance improves at an optimal level of arousal and decreases in states of low arousal, such as drowsiness and fatigue, and high arousal, such as excitement and tension. However, for simple tasks, higher levels of arousal can enhance performance.
Furthermore, autonomic nervous system activity can be used to evaluate arousal levels. Heart rate variability (HRV) reflects the balance between the sympathetic and parasympathetic nervous systems and is useful for evaluating arousal levels. Among the HRV indices, the RR interval is an important indicator for assessing autonomic nervous activity. The root mean square of successive differences (RMSSD), which is calculated as the square
root of the mean squared differences between adjacent RR intervals, reflects parasympathetic nervous activity. Moreover, the standard deviation of NN intervals (SDNN), which is the standard deviation of RR intervals, reflects the influences of both the sympathetic and parasympathetic nervous systems.
In the developed model, the characteristics of autonomic nervous activity were captured from these electrocardiographic properties, which made it possible to clarify arousal levels and estimate intellectual productivity.
The difficulty of estimating using the overall model is attributable to the significant impact of individual differences on intellectual productivity. In this study, the level of intellectual productivity varied greatly among individuals, leading to cases in which high performance for one person was low performance for another. This variation makes estimation using uniform standards difficult.
Furthermore, individual differences in cardiac activity exist during various tasks (Miyake, 2022). According to previous research, there are two types of individuals who respond to mental arithmetic tasks: cardiac responders, who exhibit an increase in heart rate, and vascular responders, who exhibit a decrease in heart rate. These individual differences make it difficult to achieve consistent estimation using an overall model, which hinders the estimation of intellectual productivity for each individual.
Hence, a model that considers individual characteristics when estimating future intellectual productivity must be constructed.
CONCLUSION
This study aimed to estimate intellectual productivity during computational tasks with cognitive load using ECG data, and an intellectual productivity estimation model was created for a continuous addition task. The experimental results suggest that the intellectual productivity of each individual can be estimated using ECG data. These outcomes may have resulted from the created model capturing individual arousal levels from the ECG data. In the future, a system to enhance intellectual productivity will be developed and evaluated after examining whether the model developed in this study contributes to the improvement of intellectual productivity.
REFERENCES
Kwasnitschka, D., Franke, H. and Netland, T. H. (2024) ‘Effects of feedback in manufacturing: A field experiment using smartwatch technology’, Journal of Operations Management, 70, pp. 933–956. Miyake, S. (2022) Guide to human experiments using Q&A: Psychophysiological
research in ergonomics. 1st edn. NTS Corporation. Tsunoda, K., Chiba, A., Chiaki, Y., Ura, T., Watanabe, T. and Mizuno, O. (2016) ‘Estimation of cognitive ability changes using heart rate variability’, Journal of Information Processing Society of Japan, 57(8), pp. 1835–1844. (in Japanese).
Estimation of Intellectual Productivity Using Electrocardiograms 31
Uchida, Y. (1957) ‘New aptitude test method - Uchida-Kraepelin mental test-’, Nikkan Kogyo Shimbun. (in Japanese). Yerkes, R. M. and Dodson, J. D. (1908) ‘The relation of strength of stimulus to
rapidity of habit-formation’, Journal of Comparative Neurology and Psychology, 18(5), pp. 459–482.
LISTED IN THE AHFE DIGITAL BOOKSTORE CATALOGUE
Explore the complete digital volume
Affective and Pleasurable Design
Read this individual research paper free through the original publisher, or explore the full digital proceedings book.
ISBN 978-1-964867-40-3
Explore this ISBN in the AHFE Bookstore ↗Listed in the July 2026 bookstore catalogue; search by ISBN to confirm current availability · Digital book purchase optional