Kosuke Sato, Kazunori Kaede, Keiichi Watanuki (2024). Estimating Work Efficiency Using Biological Information During Computational Work with Cognitive Load. In: Affective and Pleasurable Design. AHFE Open Access, vol. 123, pp. 55–63. https://doi.org/10.54941/ahfe1004676
In recent years, long working hours have become a problem in Japan. One of the measures to solve this problem is to improve work efficiency, and it is essential to establish an evaluation method for this purpose. It is also said that work efficiency decreases due to an increase in cognitive load caused by long working hours. Cognitive load refers to the amount of information processed by the brain's working memory, and it is difficult to process new information or complete a task when cognitive load is high.In previous studies on cognitive load and work efficiency, biometric information is often used as a method for evaluating cognitive load, and its effectiveness has been suggested. However, at the present stage, quantitative estimation of work efficiency under cognitive load has not been studied using biometric information. In this study, we measured biometric data during a continuous addition task with the aim of estimating work efficiency under cognitive load using biometric data. As evaluation indices, we used biological information such as heart rate variability and changes in the relative concentrations of oxygenated hemoglobin (Oxy-Hb) and deoxygenated hemoglobin (Deoxy-Hb) in the prefrontal cortex. Machine learning methods were used to estimate work efficiency, and Convolutional Neural Networks (CNNs) were used to create the machine learning models. CNNs are used in a wide range of fields as machine learning methods and are also widely used in research in the fields of cognitive load and biological information.The experiment was conducted five times on four male subjects. The continuous addition task was performed on a VDT screen for 20 minutes, and the number of correct answers in 30 seconds was used as the task efficiency. Electrocardiograms and cerebral blood flow in the prefrontal cortex were measured during the experiment.Four models were created for everyone to estimate work efficiency every 30 seconds using Oxy-Hb and Deoxy-Hb in the electrocardiogram and prefrontal cerebral blood flow. The biometric data were time-series data, and CNN was used to extract time-series features. To examine the effects of electrocardiograms and cerebral blood flow on learning, we created a model with electrocardiograms alone as explanatory variables, a model with Oxy-Hb and Deoxy-Hb in cerebral blood flow as explanatory variables, and a model with electrocardiograms and Oxy-Hb and Deoxy-Hb in cerebral blood flow as explanatory variables. We also used PFI to evaluate the importance of prefrontal cortex regions on learning.The training results showed that the ECG-only model was not sufficient for estimation, while Oxy-Hb and Deoxy-Hb in the cerebral blood flow provided highly accurate estimation. The PFI values suggested that the dorsomedial prefrontal cortex and the left dorsolateral prefrontal cortex were relatively important.
Long working hours have recently become a major problem in Japan. To solve this problem, it is necessary to improve work efficiency and develop an evaluation method. In addition, with the development and spread diffusion of DX technology, the work that humans are engaged in often frequently involves situations where a cognitive load is required to process informa- tion. Cognitive load refers to the amount of information that is processed by the brain’s working memory. It becomes difficult to process new information and complete tasks when cognitive load is high. Therefore, this study focused on tasks that require cognitive load. Previous studies on cognitive load and work efficiency have often used biological information to assess cognitive load. For example, Yamaguchi conducted a time-series frequency analysis of the RR interval of heart rate variability during continuous additive work and reported that the LF and LF/HF components, which are indicators of sympathetic nervous activity, increased, whereas while the HF component, which is an indicator of parasympathetic nervous system activity, decreased
(Yamaguchi, 2010). Mishima also measured cerebral blood flow in the pre- frontal cortex during a verbal fluency task using fNIRS and reported that the relative values of oxygenated hemoglobin and total hemoglobin increased during the task (Mishima et al., 2010). These results suggest that biological information such as heart rate variability and cerebral blood flow can be used to assess evaluate cognitive load. However, there is no research on the assess- ment of work efficiency in tasks with cognitive-load tasks using biological information. Therefore, in this study, a continuous-addition task experiment was conducted to create a model for estimating work efficiency using bio- logical information. Biological information, such as heart rate variability and changes in the relative concentrations of oxygenated and deoxygenated hemoglobin in the prefrontal cortex, were used as evaluation indices. Con- volutional neural networks (CNNs) are widely used as machine learning methods and are also frequently used in studies of cognitive load and bio- logical information. In this study, a CNN was used to extract features from time-series data and create a model to estimate work-efficiency.
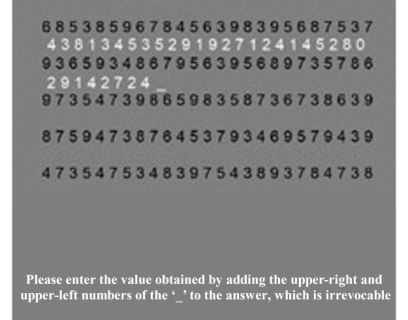
Continuous Additive Task Experiments for Work Efficiency Estimation To estimate individual work efficiency based on biometric data, a continu- ous addition task simulating the Uchida-Kraepelin performance test (Uchida, 1957) was created, and the biological information was measured during the continuous addition task. Figure 1 shows the continuous addition task used in the experiment. The lower part of Figure 1 shows the following statement: “Please enter the value obtained by adding the upper-right and upper-left numbers of the ‘_’ to the answer, which is irrevocable.”
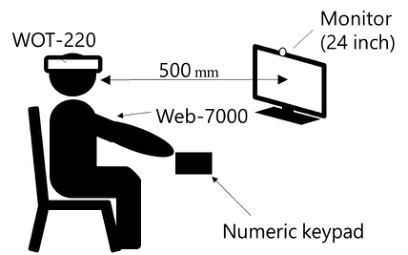
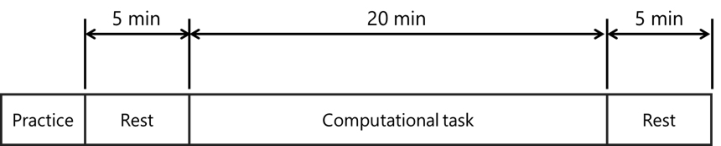
Figures 2 and 3 show the experimental environment and protocol, respec- tively. A multichannel bioinstrumentation device (Web-1000, Nihon Kohden) was used to measure the electrocardiograms, and the sampling period was set to 1 kHz. The wearable optical topography WOT-220 (Hitachi High- Technologies Corporation) was used to measure cerebral blood flow in the prefrontal cortex at a sampling rate of 5 Hz. Participants were seated 0.5 m away from the monitor during the experiment. This study was approved by the Ethics Committee on Research Involving Human Subjects (R5-E-4) at Saitama University.
Verbal informed consent was obtained from all participants. In the contin- uous addition task, participants had to find the sum of two adjacent numbers in a random number sequence displayed on the screen and enter the value of the last digit of the sum using a numeric keypad. In these tasks, a new number sequence was displayed every minute, regardless of the number of responses, according to the original Kraepelin test. Practice sessions were conducted prior to the experiment to avoid the effects of familiarity with the numeric keypad entries and the tasks. The practice was to be performed until partici- pants were able to enter numbers without looking at the numeric keypad and was limited to a maximum of 10 min. Responses were entered using only the dominant hand with a numeric keypad and a mouse.
The experiment was conducted five times on different days with four Japanese males (22.8 ± 0.75 years old). The participants were not informed
Estimating Work Efficiency Using Biological Information During Computational Work 57
of the task’s duration so as to deter them from performing it while cognizant of the time.
ANALYSIS METHOD The ratio of oxygenated hemoglobin to deoxygenated hemoglobin increases when blood vessels dilate near active nerves dilate in response to neural activ- ity when the brain is activated; this increase in cerebral blood flow was used in this study.
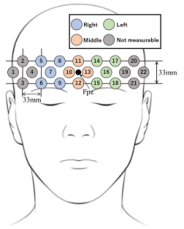
In this study, the changes in the relative concentrations of oxygenated and deoxygenated hemoglobin were used as a measure of cerebral blood flow. In this study, measurements were performed with the WOT-220 such that the transmitter and receiver sections were spaced 33 mm apart so that the Fpz in the international 10–20 method (Okamoto et al., 2004) overlapped with the intermediate position between CH10 and CH13. The gray areas here indicate channels that were excluded from the analysis because they could not be measured due to the influence of hair or other factors. To analyze the brain regions, we divided the brain into right (right dorsolateral prefrontal cortex), middle (dorsomedial prefrontal cortex), and left (left dorsolateral prefrontal cortex) regions. Figure 4 shows the divisions of the regions in the experiment.
Noise was removed from the data measured with NIRS. Due to its technical characteristics, a standard moving average (SMA) was used to remove the spike noise. N = 5 signal smoothing was performed on oxyHb and deoxyHb measurements.
To remove noise caused by head and body movements, noise reduc- tion was performed using a correlation-based signal improvement (CBSI) (Cui et al., 2010) method. This method takes advantage of the fact that the oxyHb and deoxyHb values are negatively correlated when brain activity is present, whereas the oxyHb and deoxyHb values are positively correlated when variations due to non-neural activities such as body movements are present.
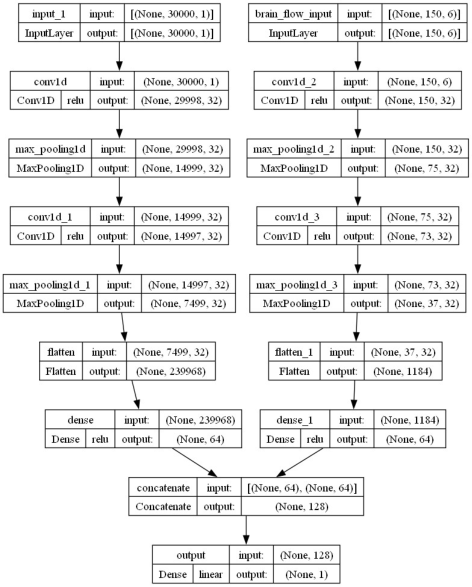
MACHINE LEARNING MODEL In this model, the input and output data were standardized to match the scale of each variable. The model is a regression model that estimates work efficiency by preparing a convolutional layer and an all-combining layer for feature extraction and learning between combined features for each type
Figure 4: Area division of NIRS.
Estimating Work Efficiency Using Biological Information During Computational Work 59
of biological information, and then combining the outputs from each all- combining layer and inputting them into the all-combining layer. ReLU functions were used as the activation functions for each convolutional layer and all combined layers, and linear functions were used for the output layer. Training was performed using a k-partition cross-validation method with five partitions and cross-validation. MSE was used as the loss function and Adam was used as the optimization method. The hyperparameters were a batch size of 32, number of epochs of 200, and a learning rate varied between 0.01 and 0.0001 using ReduceLROnPlateau, a program that monitors the behavior of the loss function and reduces the learning rate if the loss does not decrease. The program monitored the behavior of the loss function and reduced the learning rate when the loss did not decrease. In this model, if the loss did not decrease over 20 epochs, then the learning rate was reduced to 20% of the previous rate.
MAPE and R2 values were used as evaluation indices for the test data. PFI is a measure of the importance of a feature in the prediction model. Incre- mental errors can be used to indicate the importance of features. To examine the effects of electrocardiograms and cerebral blood flow on learning, a model was created in which electrocardiograms alone were an explanatory variable, cerebral blood flow alone was an explanatory variable, and both electrocardiograms and cerebral blood flow were explanatory variables.
Figure 5: Shape of the machine learning model.
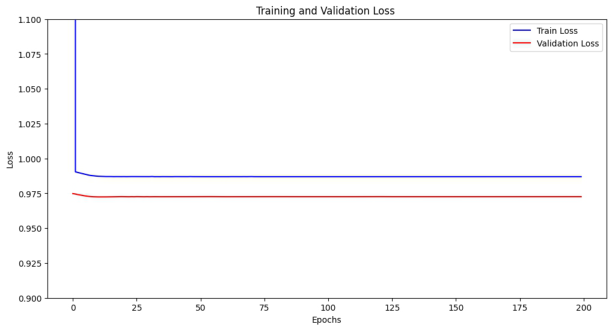
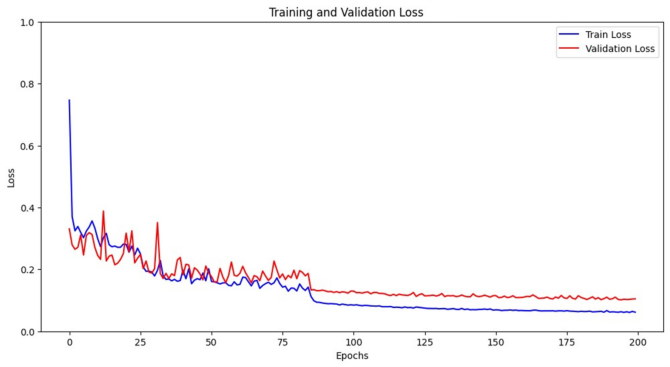
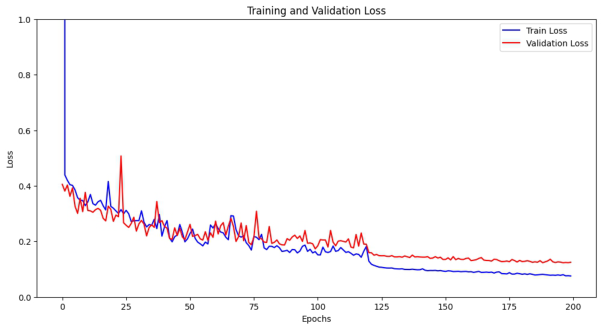
EXPERIMENTAL RESULTS The results of the training with the machine-learning models are shown below. Figures 6, 7, and 8 show the learning curves of the model created for Subject A’s electrocardiogram only, the model created for cerebral blood flow only, and the model created for both electrocardiogram and cerebral blood flow.
Figure 6: Learning curves for models created from the electrocardiograms.Figure 7: Learning curves for models created from the cerebral blood flow.
Estimating Work Efficiency Using Biological Information During Computational Work 61
Figure 8: Learning curves for models created from the electrocardiogram and cerebral blood flow.Table 1. Experimental participants evaluation of test data.
B MAPE [%] 17.1 3.42 4.39 R2 −1.56E-03 9.04E-01 9.15E-01 C MAPE [%] 10.7 2.61 4.32 R2 −3.7E-05 9.24E-01 8.06E-01
D MAPE [%] 12.7 4.69 3.53 R2 −6.50E-04 8.99E-01 8.84E-01 Mean MAPE [%] 13.3 3.41 4.07 R2 −7.16E-04 9.17E-01 8.72E-01
Figure 6 shows that the loss function of the model created using only electrocardiograms remained unchanged as the number of training sessions increased. The results in Figures 7 and 8 show that both the training loss and the validation loss converged at low values for the model created using only cerebral blood flow, and the model trained using both electrocardiograms and cerebral blood flow, respectively. The learning curves of the other collab- orators also showed the same trend as those of Collaborator A. Table 1 shows the MAPE and R2 values for the test data for each model from experimental collaborators A to D, respectively.
From the above results, it can be said that the model created using only the electrocardiogram showed a low R2 value, and that the estimation using only the electrocardiogram was not sufficient. The model using only cerebral blood flow was the most accurate and more accurate than the model using both electrocardiograms and cerebral blood flow.
Figure 9: PFI results by prefrontal region.
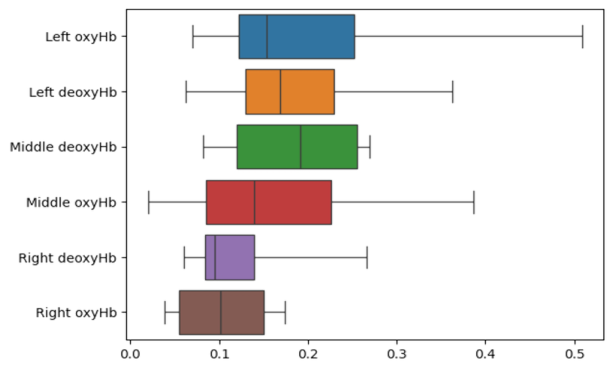
Figure 9 shows the results of the PFI for each prefrontal region, it is evident that the right dorsolateral prefrontal cortex was relatively less important, whereas the dorsomedial and left dorsolateral prefrontal cortices were more important.
DISCUSSION
The above results suggest that it is possible to estimate work efficiency from biological information. In addition, the accuracy of the models using only cerebral blood flow, electrocardiograms, and both cerebral blood flow and electrocardiograms suggests that changes in cerebral blood flow are more important than those in electrocardiograms for estimating work efficiency. The calculations were performed using both short-term memory (remember- ing numbers) and long-term memory (using calculation methods). Working memory is defined as a mechanism that actively retains the information required to perform an activity or task. The prefrontal cortex is thought to be heavily involved in this process (Matsunami and Naito, 2000). In addi- tion, the ratio of oxyHb in cerebral blood flow increases when the brain is activated, and the values of oxyHb and deoxyHb are negatively correlated when brain activity is present. In the present model, oxyHb and deoxyHb can capture the activity of the prefrontal cortex and thus predict work efficiency with high accuracy.
The results of the PFI for each region of cerebral blood flow suggest that the dorsomedial and left dorsolateral prefrontal cortices are important for estimating work efficiency. In general, the dorsomedial prefrontal cortex is responsible for attention, control of external information, and execution, whereas the left dorsolateral prefrontal cortex is responsible for language and mathematical processing. Previous studies have shown that the left side of the prefrontal cortex is activated during computation (Mishima et al. 2010). This suggests that work efficiency can be estimated by recording the
Estimating Work Efficiency Using Biological Information During Computational Work 63
activation of the prefrontal cortex during computation. It is hypothesized that the right side of the prefrontal cortex, which is relatively insignifi- cant, is associated with intuition and emotion. The computational task in this study was monotonous, so it is thought that changes in emotion and work efficiency were relatively independent of each other; therefore, the importance of the right prefrontal cortex was relatively low. The heart rate variability indices LF, HF, and LF/HF, which have been associated with the continuous addition task in previous studies, were used as explanatory vari- ables in the present model, with the expectation that they would reflect the characteristics of learning. This is because the ECG data used as the explanatory variable was 30 s long, which did not adequately capture the characteristics of the heart rate variability indices, and the amount of data was large because the ECG data were acquired at 1 kHz. Moving for- ward, we aim to conduct further research to determine whether the heart rate variability index can be used to forecast long-term work efficiency and whether the estimation accuracy can be improved through the downsampling of ECG data.
CONCLUSION
The objective of this study was to assess work efficiency during a cognitive load and to estimate work efficiency using the biological information and to build an estimation model of work efficiency during a continuous addi- tion task. The experimental results suggest that cerebral blood flow in the prefrontal cortex can predict work efficiency with high accuracy and that the dorsomedial prefrontal cortex and the left dorsolateral prefrontal cortex may be particularly useful in this estimation. Future prospects include the possi- bility of using heart rate variability indices to estimate work efficiency over long periods of time, and whether downsampling the ECG data improves the accuracy the estimate.
REFERENCES
Matunami, K., Naito, E. (2000). Latest Exercise and the Brain-Brain Mechanisms that Move the Body. Tokyo, SAIENSU-SHA, pp. 95–106. Mishima, K. Matsuyama, K. Kato, T., Suetsugu, T. Aramaki, S. Irie, K. Mishima, K.
Fujiwara, M. Ai, H. Abiru, M. (2010). “Measurement of cerebral blood flow in the prefrontal cortex during a verbal fluency task using fNIRS”, Fukuoka University review of technological sciences, Volume 84, No. 84, pp. 49–52 (in Japanese). Uchida, Y. (1957). “New Aptitude Test Method - Uchida-Kraepelin Mental Test”, in: Nikkan Kogyo Shimbun (in Japanese). Yamaguchi, K., (2010). “Analysis of Mental Load Stress by Heart Rate Variabil-
ity”, Research bulletin, Shigakukan University, Volume 31, No. 1 pp. 1–10 (in Japanese).
LISTED IN THE AHFE DIGITAL BOOKSTORE CATALOGUE
Explore the complete digital volume
Affective and Pleasurable Design
Read this individual research paper free through the original publisher, or explore the full digital proceedings book.
ISBN 978-1-958651-99-5
Explore this ISBN in the AHFE Bookstore ↗Listed in the July 2026 bookstore catalogue; search by ISBN to confirm current availability · Digital book purchase optional