Muyi Li, Ren-Ke He, Yuan Yuchen, Chaomin Ma (2022). The Effect of Timing of Non-Driving Task Takeover Request Messages on Novice Drivers’ Driving Trust. In: Applied Human Factors Research. AHFE Open Access, vol. 67, pp. 548–553. https://doi.org/10.54941/ahfe1002698
The unpredictable behavior patterns of self-driving vehicles in SAE level 3 autonomous driving can be untrustworthy to the driver. In self-driving vehicles, vehicle actions must be fed back to the user so that they are aware of the vehicle's actions. Otherwise, opaque information can lead to distrust of the vehicle by the driver. Flat-view displays (HUDs) provide an opportunity to visually and effectively inform drivers about vehicle perception and interpretation of the driving environment. Research has illustrated the importance of where and when HUD information is displayed. In "warning" situations, the timing of the display of necessary information can have a significant impact on driving safety; if warning messages are not properly placed or timed, drivers may have difficulty (or even fail to detect) the warning, thereby seriously endangering their safety and that of others. Drivers must detect and understand vehicle action messages when they are first displayed and turn their attention to the road as soon as possible so that they can take over the vehicle, react to potential hazards ahead or around them, and successfully avoid an accident. As a result, where/when the HUD is placed to display this dynamic information is critical; otherwise, the HUD's benefits will be negated. In this work, a driving experiment divided 26 participants into two groups (conservative drivers and novice drivers) and focused on the impact of HUD information presence timing on user experience and trust, measuring the impact of three HUD information presence timings (50m/70m/90m) on novice driver trust across four driving tasks (steer/stop/start/change lanes). The experimental setup was conducted in a simulated cockpit with a screen placed in front of the cockpit and a record of real driving displayed on a canvas screen. Subjects completed the User Experience Questionnaire (UEQ), the Trust Scale (TS), and the Preference for Overall Driving Experience (PREF) scale by watching a video. After completing the scales, user interviews were conducted to understand the reasons for the users' subjective preferences and other additional information. The results showed that the HUD message display enhanced the user experience and trust in the automated system. Significant differences were found in the timing of HUD messages by driving scenario as well as in preferences for the timing of HUD messages by driving style. The interaction of driving style with the driving environment and HUD complexity warrants further study. We present optimized design strategies for the timing of HUD information appearance based on the research.
As technology advances, automated vehicles (abbreviation: AVs) are beco- ming more capable. This has led to an increase in the non-involvement of humans in driving tasks and uncertainty about the future actions of the veh- icle. Studies have shown that when automation increases, passengers’ trust in the system decreases. Collaboration between humans and robots will be more effective if the system communicates its intentions (Rödel et al., 2014, Walch et al., 2017).
As part of the in-vehicle information system, the vehicle’s Head-up display (HUD) system presents various information items, such as driving and non- driving information, directly in the driver’s forward field of view (FFOV). By doing so, it allows the driver to get the information they need while keeping their eyes forward, rather than taking their eyes off the road scene in front of them as they would with a conventional Heads-down display (HDD) (Doshi, 2009, Yang et al., 2018). Well-designed automotive HUDs are considered to have advantages over HDDs, including less gaze and focus shifts between the road scene and the display, and potentially faster detection of displayed information and external events (Gish et al., 1995, Liu et al., 2003, Liu et al., 2004, Oh et al., 2016, Sojourner et al., 1990).
The Effect of Timing of Non-driving Task Takeover Request Messages 549
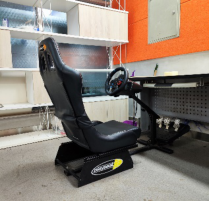
Figure 1: Experimental environment and experimental procedure.
According to the research, current automotive HUD systems can be further improved in terms of system functionality and interface/interaction design to match the driver’s needs and preferences to provide a better user experience (Charissis et al., 2010, Beck et al., 2019). Also, the visibility of the system state is one of Jakob Nielsen’s usability heuristics for user interface design and the system should always pass appropriate feedback within a reasonable time (Nielsen, 1994). Therefore, it is particularly important how the HUD displays the non-driving task takeover request message for user experience when it appears. In this paper, we investigate when the HUD message appears will not affect the user experience and user trust through user testing and user interviews.
In this paper, when using the term “timing of information”, we are refer- ring to when the vehicle HUD system tells the user about the vehicle’s intent, i.e, when the user is aware of the vehicle’s intent.
USER STUDIES We investigated how the timing of information cues for automated vehicle intent affects user experience and trust, and how these factors correlate with other factors such as the driving experience.
Participants We invited 26 participants (M13, F13) with a mean age of 23.5 years (SD 1.73) to the College of Design and Arts, Hunan University. Participants drove less than 5,000 km per year, meeting the criteria for a novice driver (Gerber et al., 2019). To answer how the visualization of vehicles’ motion intentions.
Materials
The experimental setup was performed in a simulated cockpit (see Figure 1). We placed a screen (65-inch) in front of the cockpit and displayed the recor- dings of real driving on to the canvas screen (see Figure 2). To control for variable driving material without sound, the videos were not similar. The subjective scales used in the experiment - User Experience Question- naire (UEQ), Trust Scale (TS) and Preference for Overall Driving Experience (PREF).
Figure 2: Experiment video.Table 1. Subjective scales used in the experiment and their internal consistency.
The driving task involved in the video is vehicle turning. We created the video in Adobe Photoshop and Adobe After Effects. In addition, we designed a control condition i.e, the information is always displayed. We told the par- ticipants that the car was self-driving and therefore they had no option to intervene during the viewing process. After viewing each video, we measured participants’ perceptions of user experience and trust. For user experience, we used the User Experience Questionnaire (Laugwitz et al., 2008) and for trust, the Trust Scale (Jian et al., 2000, Pöhler et al., 2016). Finally, the overall driving experience was rated (short: PREF, 7-point Likert scale). In addition, we asked them through interviews about what they liked or disliked about the timing of the information and whether they made any suggestions.
RESULTS
First, we checked the internal reliability of all scales (see Table 1). We found unacceptable values for the UEQ sub-scale efficiency, stimulation, novelty, so we excluded this part of the scale from further reporting and interpretation. For all other (sub) scales, the consistency ranged from acceptable to excel- lent. To find differences between conditions, we used univariate ANOVA. To analyze correlations between factors, such as user experience and timing preferences, we used a bivariate correlation analysis after Pearson.
The Effect of Timing of Non-driving Task Takeover Request Messages 551
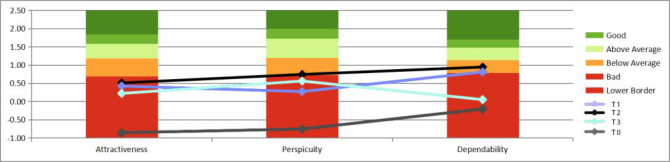
Figure 3: Mean values for UEQ factors, in all experimental conditions (lines)-The colorscale represents UEQ benchmark against other system (401 studies).Table 2. Post-hoc comparison of experimental conditions for UEQ factors, TS, and PREF.
User Experience We found a significant main effect of the visualization condition on 2 factors: dependability (F(2) = 6.08, p<0.05 = 0.004, η2 = 0.15), Perspi- cuity (F(2) = 6.08, p<0.05= 0.004, η2 = 0.15), therefore it is considered that at least one of the 3 groups is significantly different from the other group.
We found that there is a significant difference between these three groups (T2>T1>T3). the timing of the HUD message presence affects the user dependability experience (see Table 2).
Automation Trust We found a significant effect of the timing of message appearance on trust (F(2)=3.87, p<0.05=0.026, η2 =0.10), thus concluding that at least one of the 3 groups was significantly different from the other.
We found a significant main effect of timing of information appearance on trust (F(2)=3.76, p<0.05=0.029, In other words, the timing of the appe- arance of all three types of information leads to higher trust (see Figure 3, Table 2), and the inappropriate timing of the information can lead to distrust of the system.
Overall Driving Experience and Preference The timing of message presence did not affect participants’ ratings of the overall driving experience.
Overall Driving Experience and Preference To identify additional factors, we analyzed the effects of driving style and gender on the dependent variable. There was no correlation between them.
Qualitative Feedback During the interviews, we asked users about the reasons for their message appearance timing preferences, as well as other noteworthy information.
The majority of users chose T2 as the optimal message appearance time, believing that too long an interval between message appearances would cause anxiety and too short a time would result in too little time to react. Three users also indicated that the optimal message appearance time would change with long-term use. Preferences may change depending on the driving environment, e.g., traffic jams, bad weather conditions.
ADVICE ON DESIGN We summarize the design implications of message timing that can help improve future HUD designs for automated vehicles.
D1. Design different timing for different messages. D2. Design different message appearance timing for different driving envi- ronments. D3. Information appearance should be configurable or adjustable depen- ding on the user’s driving skills for the automated vehicle.
CONCLUSION AND LIMITATIONS As the actions of automated vehicles become more complex, their intent beco- mes more difficult to communicate. In this paper, we evaluate three different timing of message appearance to communicate vehicle intent. Users percei- ved that message appearing at T2 time provided the best safety and reliability. However, given the small sample size and the simplicity and homogeneity of the driving environment studied, the findings of this study may not be appli- cable to a broader driving environment. Further work will be conducted in more depth for different driving tasks and driving conditions.
REFERENCES
Charissis, V. and Papanastasiou, S., 2010. Human–machine collaboration through vehicle head up display interface. Cognition, Technology & Work, 12(1), pp. 41–50. Doshi, A., Cheng, S.Y. and Trivedi, M.M., 2008. A novel active heads-up display for
driver assistance. IEEE Transactions on Systems, Man, and Cybernetics, Part B (Cybernetics), 39(1), pp. 85–93. Gerber, M.A., Schroeter, R. and Vehns, J., 2019, September. A video-based automated driving simulator for automotive UI prototyping, UX and behaviour research. In Proceedings of the 11th International Conference on Automotive User Interfaces and Interactive Vehicular Applications (pp. 14–23). Gish, K.W. and Staplin, L., 1995. Human factors aspects of using head up displays
in automobiles: A review of the literature. Jian, J.Y., Bisantz, A.M. and Drury, C.G., 2000. Foundations for an empirically determined scale of trust in automated systems. International journal of cognitive ergonomics, 4(1), pp. 53–71.
The Effect of Timing of Non-driving Task Takeover Request Messages 553
Laugwitz, B., Held, T. and Schrepp, M., 2008, November. Construction and evaluation of a user experience questionnaire. In Symposium of the Austrian HCI and usability engineering group (pp. 63–76). Springer, Berlin, Heidelberg. Liu, Y.C., 2003. Effects of using head-up display in automobile context on attention
demand and driving performance. Displays, 24(4-5), pp. 157–165. Liu, Y.C. and Wen, M.H., 2004. Comparison of head-up display (HUD) vs. headdown display (HDD): driving performance of commercial vehicle operators in Taiwan. International Journal of Human-Computer Studies, 61(5), pp. 679–697. Oh, H.J., Ko, S.M. and Ji, Y.G., 2016. Effects of superimposition of a head-up display
on driving performance and glance behavior in the elderly. International Journal of Human-Computer Interaction, 32(2), pp. 143–154. Park, J. and Park, W., 2019, November. A review on the interface design of automotive head-up displays for communicating safety-related information. In Proce- edings of the Human Factors and Ergonomics Society Annual Meeting (Vol. 63, No. 1, pp. 2016–2017). Sage CA: Los Angeles, CA: SAGE Publications. Pöhler, G., Heine, T. and Deml, B., 2016. Itemanalyse und Faktorstruktur eines
Fragebogens zur Messung von Vertrauen im Umgang mit automatischen Syste- men. Zeitschrift für Arbeitswissenschaft, 70(3), pp. 151–160. Rödel, C., Stadler, S., Meschtscherjakov, A. and Tscheligi, M., 2014, September.
Towards autonomous cars: the effect of autonomy levels on acceptance and user experience. In Proceedings of the 6th international conference on automotive user interfaces and interactive vehicular applications (pp. 1–8). Sojourner, R.J. and Antin, J.F., 1990. The effects of a simulated head-up display speedometer on perceptual task performance. Human Factors, 32(3), pp. 329–339. Walch, M., Mühl, K., Kraus, J., Stoll, T., Baumann, M. and Weber, M., 2017. From car-driver-handovers to cooperative interfaces: Visions for driver–vehicle intera- ction in automated driving. In Automotive user interfaces (pp. 273–294). Springer, Cham. Yang, Z., Shi, J., Zhang, Y., Wang, D., Li, H., Wu, C., Zhang, Y. and Wan,
J., 2019. Head-up display graphic warning system facilitates simulated dri- ving performance. International Journal of Human–Computer Interaction, 35(9), pp. 796–803.
LISTED IN THE AHFE DIGITAL BOOKSTORE CATALOGUE
Explore the complete digital volume
Applied Human Factors Research
Read this individual research paper free through the original publisher, or explore the full digital proceedings book.
ISBN 978-1-958651-43-8
Explore this ISBN in the AHFE Bookstore ↗Listed in the July 2026 bookstore catalogue; search by ISBN to confirm current availability · Digital book purchase optional