Wenxiu Yang, Ren-Ke He, Tingshu Chen, Wang Haining, Richard Goossens, Toon Huysmans (2022). Soft tissue thickness estimation for head, face, and neck from CT data for product design purposes. In: Ergonomics In Design. AHFE Open Access, vol. 47, pp. 558–565. https://doi.org/10.54941/ahfe1001983
Analysing the contact area between head-related products and the corresponding craniofacial profile is necessary to make such products more comfortable. The study of soft tissue biomechanical experiments provides a reliable perspective for understanding such contact areas and improving the comfort. In order to obtain more accurate and visualized craniofacial biological information that can be used to guide product design, CT data of the head, face, and neck of 50 Chinese aged 18-35 years were obtained in this paper. For each subject, an individual thickness map is calculated by segmentation of the soft tissue layer and wall-thickness calculation via Mimics. The individual maps superimposed on the outer surface area of the head, face, and neck are brought into correspondence using a non-rigid iterative closest point technique. From the correspondence an average head, face, and neck geometry and soft tissue thickness map was calculated. Statistics of the overall soft tissue thickness of the head, face, and neck is extracted, and an accurate soft tissue thickness map of the Chinese head, face, and neck is generated. This study not only lays the groundwork for future simulation experiments on head-related product design, but it also has significant implications for the fields of facial reconstruction in China.
“Comfort” is a key indicator in the field of product design, particularly in the design process of wearable products, to evaluate whether a product can achieve a good user experience while performing its basic functions. And “pressure” is one of the key factors that cause discomfort in wearable pro- ducts. Researchers have shown that the constant application of force to a specific area can cause spots, rashes, skin irritations, or ulcers on the skin (Callaghan et al. 1998). Zhuang’s research also pointed out that if a device needs to be worn continuously for a long time, the pressure will increase with the wearing time (Dai et al. 2001), which leads to an increase in discomfort. This means that the degree of deformation of the soft tissue under force will affect the user’s assessment of the comfort.
Soft Tissue Thickness Estimation for Head, Face, and Neck from CT Data 559
However, the application of soft tissue deformation research in the field of ergonomics has not received extensive much attention. Most of the resea- rch on soft tissue is to solve medical problems, such as orthodontic surgery (Gisotti et al. 2022), tumor tissue (Hayes et al. 2004) and other biomechani- cal properties research. Luximon (Shah et al. 2021) has developed soft tissue deformation maps of pressure discomfort threshold (PDT) and pressure pain threshold (PPT) of the Chinese head and face in the field of ergonomics rese- arch. The degree of soft tissue deformation is proportional to the thickness of the corresponding soft tissue. It can be seen that in order to improve the pressure comfort of wearable products, anatomical and biomechanical stu- dies on the soft tissues of the corresponding parts are critical. Because the focus of this research is on the head, face and neck, and the target product is the head-mounted product, the research will concentrate on soft tissue of the craniofacial region.
A large number of studies have measured the soft tissue thickness of the head and face among the existing facial soft tissue measurement studies. The facial soft tissue thickness data of Northern China (Shui et al. 2013), South- Korean (Cha et al. 2013), Brazilian (Tedeschi et al. 2009), White (Sahni et al. 2008) have been collected and analyzed. However, these studies only measure the thickness of soft tissue at a limited number of landmarks in the craniofa- cial region. There is no way to obtain accurate soft tissue thickness data of the head and face with a limited number of landmark measurements because there are countless feature points on the craniofacial part. Furthermore, the soft tissue thickness data obtained in the preceding studies are primarily pre- sented in the form of data tables, which cannot directly display the thickness of the soft tissue of the head and face, nor can it be effectively applied in the design of head-mounted products.
Furthermore, in terms of measurement technology and application, tra- ditional soft tissue thickness measurements typically use the needle depth probing method on cadavers (He et al. 2021). However, the measurement method and the cadaver’s condition have a significant impact on the accu- racy of the measurement results. This problem is effectively solved by the use of medical imaging techniques such as Computerized Tomography (CT).
Because of the scarcity of accurate and well-illustrated Chinese head and face soft tissue thickness structural data. CT data of the head, face, and neck of 50 Chinese aged 18–35 years were obtained using CT measurement tech- nology in this paper. Later, the overall soft tissue thickness of the head, face, and neck is extracted, and an accurate soft tissue thickness map of the Chi- nese head, face, and neck is created. This study lays the groundwork for the head-related ergonomic product design.
MATERIAL AND METHODS
Materials
In this study, 50 subjects (24 males and 26 females) were selected for CT scans (the resolution of each CT data is 0.49*0.49*0.625) at the Third Xiangya Hospital of Central South University. All of the study participants were Han Chinese from China’s Hunan Province. Between the ages of 18
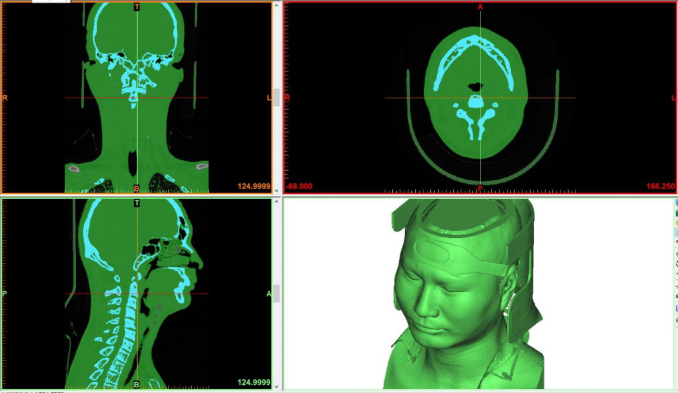
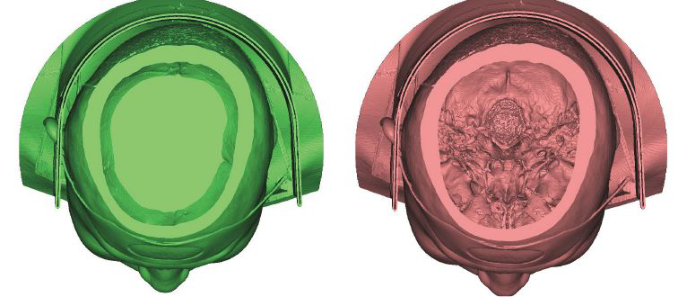
Figure 1: Soft tissue structure in Mimics (Green part represents soft tissue, blue part represents bone).Figure 2: Model with brain (left) and without brain (right).
and 35. Subjects with a history of facial fractures, swelling, deformity, distor- tion, and pathological asymmetry, or any other pathology that might affect normal craniofacial features prior to measurement were barred from parti- cipating in the study. Before participation, all samples were given informed consent.
Methodology
The model processing procedure is as follows. The acquired CT data was first processed using Mimics 20.0 software in this study. The scan data is impor- ted into the Mimics 20.0 software, the skull and soft tissue were separated using the system default threshold. Soft tissue Hounsfield units range from −700 to 225. Figure 1 shows the soft tissue in green and the skull in blue. Then, since the focus of this study is on soft tissue and the skull, and a large
Soft Tissue Thickness Estimation for Head, Face, and Neck from CT Data 561
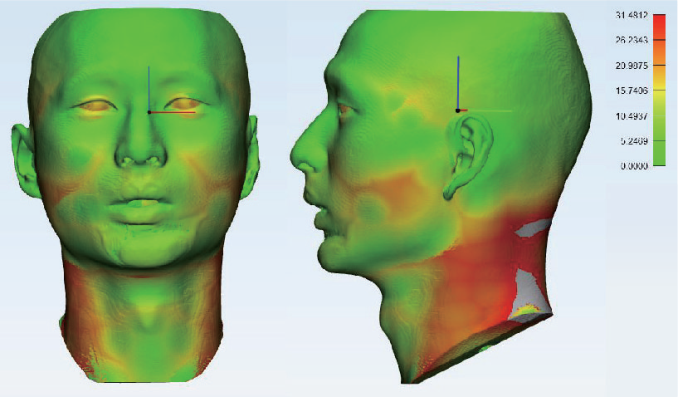
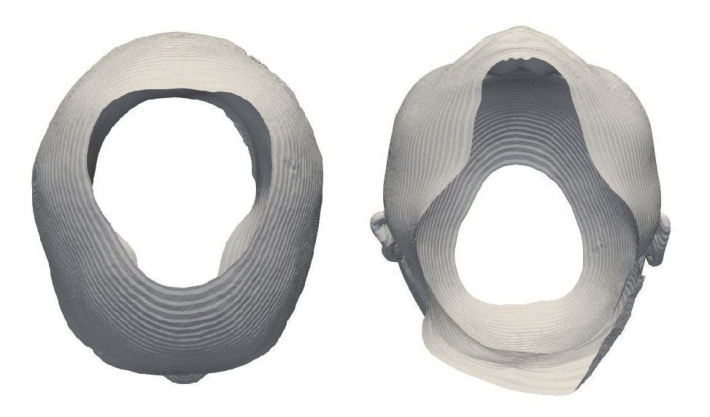
Figure 3: Soft tissue model with soft tissue thickness color coded for individual subject.Figure 4: Skn part, top (left) and bottom (right) view.
number of intracranial structures will affect the speed of later model proces- sing, most of the intracranial structures and band need to be removed at this stage (Figure 2).
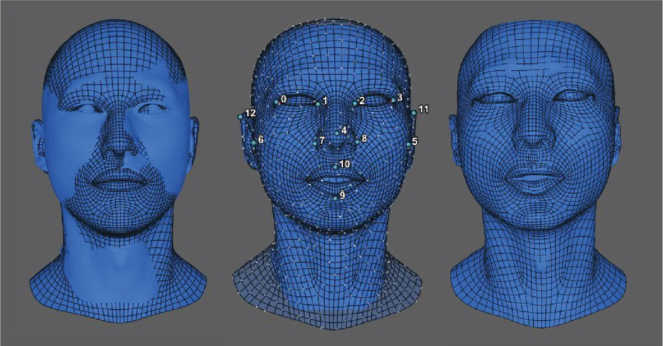
After completing the model processing in Mimics 20.0 software, the model needs to be imported into 3-matic Research 12.0 for the calculation of the overall thickness of soft tissue (Figure 3). After that, the model and soft tis- sue thickness data were exported separately. Futhermore, all CT head models were extracted skin parts for importing in Paraview (Figure 4). R3DS Wrap (Dyke et al. 2020) was used to establish a correspondence between a tem- plate head model and the skin surface of the individual subjects (Figure 5).
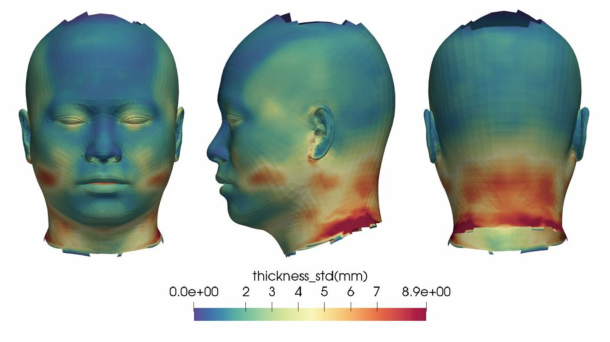
Figure 5: CT headform (skin) and template headform after alignment (left), CT head model is being wrapped by the template head model (middle), Computed model (right).Figure 6: Soft tissue thickness map (unisex).
The resulting homological head representations for each subject were equip- ped with individual soft tissue values at all vertices, derived from the soft
Soft Tissue Thickness Estimation for Head, Face, and Neck from CT Data 563
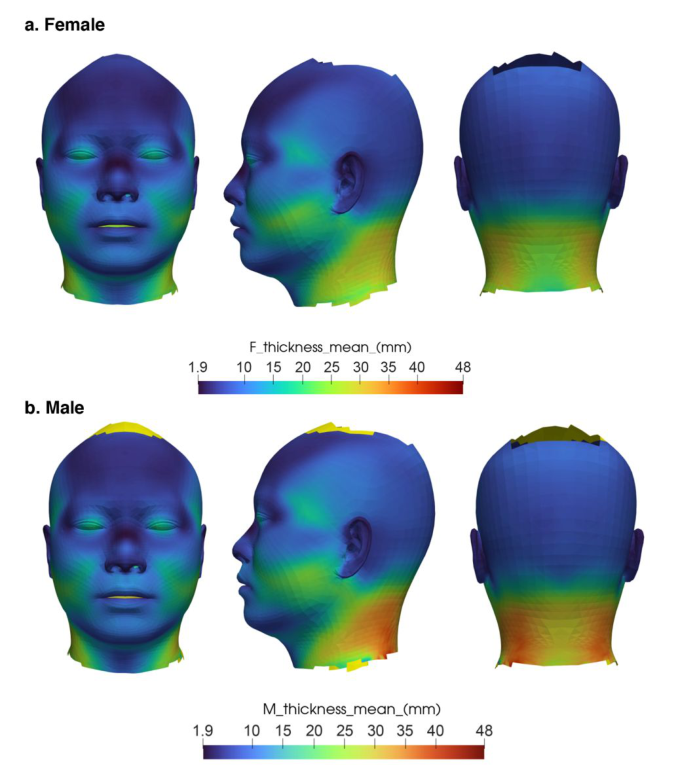
Figure 7: Soft tissue thickness map for male and female.
tissue thickness that was calculated in 3-matic. The resulting homological head models could then be averaged in geometry and soft-tissue thickness. In addition, the head model was clipped to that region for which thickness data was available for a minimum of 40 subjects (Figures 6 and 7).
RESULT
Soft Tissue Thickness Map With High Accuracy Overall, soft tissue thickness is significantly thinner in regions with skull or teeth support compared to another craniofacial region. Furthermore, com- pared to the head and face, the neck, particularly the back of the neck, has the thickest soft tissue. In contrast, the soft tissue thickness of the scalp is the thinnest (Figures 6 and 7). Moreover, the soft tissue thickness for male is thicker than female (p < 0.05) (Table 1).
Application of Soft Tissue Research in Head-Related Product Design The craniofacial soft tissue data obtained in this experiment can be used to create a model in the simulation experiment, which can then be used to run the simulation experiment. The traditional large-scale recruitment of users to evaluate the fit and comfort of the head-related product is relatively expensive, while the user test results of a small sample are not representative. The simulation experiment such as finite element force simulation experi- ment and fluid mechanics simulation experiment has many advantages. The simulation experiment can not only control the experiment cost, but it can also obtain specific information about each point of product, which has a wide range of applications in head-related product design.
CONCLUSION
3D anthropometric data are commonly used in ergonomics for comfort studies. However, this method is difficult to obtain specific and objective information of the contact part between the product and the human body. The biological characteristics of soft tissue can be further analyzed through the study of soft tissue anatomy. For example, the data collection in our paper, not only looking at averages but variations in soft tissue distribution by doing a Principal components analysis on the soft tissue thickness maps over the sample, which is beneficial to improving the design of head-related products.
Soft Tissue Thickness Estimation for Head, Face, and Neck from CT Data 565
ACKNOWLEDGMENT
The authors would like to acknowledge the support of School of design Hunan University, the Third Xiangya Hospital of Central South Univer- sity and the Faculty of Industrial Design Engineering, Delft University of Technology.
REFERENCES
Callaghan, S., & Trapp, M. (1998). Evaluating two dressings for the prevention of nasal bridge pressure sores. Professional nurse (London, England), 13(6), 361–364. Cha, K. S. (2013). Soft-tissue thickness of South Korean adults with normal facial
profiles. The korean journal of orthodontics, 43(4), 178–185. Dai, J., Yang, J. J., & Zhuang, Z. (2011). Sensitivity analysis of important parameters affecting contact pressure between a respirator and a headform. International Journal of Industrial Ergonomics, 41(3), 268–279. Dyke, R. M., Lai, Y. K., Rosin, P. L., Zappalà, S., Dykes, S., Guo, D., ... & Yang, J.
(2020). Shrec’20: Shape correspondence with non-isometric deformations. Com- puters & Graphics, 92, 28–43. Gisotti, M., Lops, D., & Valente, N. A. (2022). Esthetic management of space and soft tissue deficiencies in implant therapy: combined orthodontic-mucogingival approach. The international journal of esthetic dentistry, 17(1), 42–56. Hayes, A. J., Alexander, N., Clark, M. A., & Thomas, J. M. (2004). Elastofibroma:
a rare soft tissue tumour with a pathognomonic anatomical location and clinical symptom. European Journal of Surgical Oncology (EJSO), 30(4), 450–453. He, R., Yang, W., Wu, D., & Wang, H. (2021). Age- and Sex-Related Measurements of Total Craniofacial Soft Tissue Thickness and Fat in a Central Chinese Population. The Journal of craniofacial surgery, 32(8), 2626–2630. Sahni, D., Singh, G., Jit, I., & Singh, P. (2008). Facial soft tissue thickness in northwest
Indian adults. Forensic science international, 176(2-3), 137–146. Shah, P., & Luximon, Y. (2021). Assessment of pressure sensitivity in the head region for Chinese adults. Applied ergonomics, 97, 103548. Shui W, Zhou M, Ji Y, et al. (2013). Measurement of facial soft tissue thickness
and application to facial reconstruction. Acta Anthropologica Sinica. 2013:32: 345–353. Tedeschi-Oliveira, S. V., Melani, R. F. H., de Almeida, N. H., & de Paiva, L. A. S.
Read this individual research paper free through the original publisher, or explore the full digital proceedings book.
ISBN 978-1-958651-23-0
Explore this ISBN in the AHFE Bookstore ↗Listed in the July 2026 bookstore catalogue; search by ISBN to confirm current availability · Digital book purchase optional