Tingshu Chen, Ren-Ke He (2023). The Effects of Communication Cues on Group Decision Making in Online Conferences. In: Usability and User Experience. AHFE Open Access, vol. 110, pp. 527–536. https://doi.org/10.54941/ahfe1003228
Online conferencing has become one of the most common tools we use in our lives and at work today. As a result of the coronavirus disease (COVID-19) pandemic, social mobility was limited, and people around the world had to use computer-mediated communication to connect and collaborate remotely instead of face-to-face interaction. The outbreak led to a surge in the use of online meetings, which are still actively used by a large number of people. However, prolonged or excessive use of online meetings can cause some negative feelings, a phenomenon known as "Zoom Fatigue." The lack of communication cues in online meetings compared to face-to-face interactions can lead to undesirable experiences such as easy distraction or low engagement. Previous research has found that the root causes of zoom fatigue include a lack of non-verbal cues such as spatial voice, facial expressions, eye contact, and body language. It is unclear to what extent these cues influence participants' experiences of social interactions in meetings and the relationship between them. We designed a between-group study to compare the performance and experience of different interaction conditions with different communication cues on meeting teamwork. The communication cues we focused on were spatialized voice (SV), eye contact (EC), facial emotions (FE), and body language (BL). By reducing communication cues, we designed five interaction conditions, namely: an online meeting A1 (no SV), normal face-to-face A2, face-to-face with a mask A3 (no FE), face-to-face with a hidden head A4 (no FE and EC), and face-to-face with a hidden whole body A5 (no FE, EC, and BL). Using the hidden profile paradigm, we set up a fictitious personnel selection case to test group decision-making and investigated whether communication cues made a difference to the cognitive load and social presence in the meeting. In groups of four, we tested 20 participants in different interaction conditions and observed and recorded their behavioral performance. For all participants, we collected their demographic information as well as online meeting usage. To assess the experience of social interactions in meetings, we recorded task completion times and used the Networked Mind Measure of Social Presence Questionnaire (SPQ), the NASA Task Load Index Questionnaire (NASA-TLX), and the System Usability Scale (SUS). Our results found a decrease in task completion time after integrating eye contact. For social presence, spatial voice and facial expressions led to a significant increase. Eye contact and gestures increased attention but decreased perceived information comprehension. Eye contact had no significant effect on joint presence, while gestures enhanced joint presence. For cognitive load, eye contact and facial expressions make it lower, while other cues enhance it. The integration of gestures substantially enhances the usability of social interactions in meetings. In summary, our findings suggest that spatial voice significantly enhances social connection with others in meetings; facial expressions and eye contact help improve the understanding of interactions; and gestures improve the perception of social interactions. The way communication cues are presented in future virtual environments and remote collaboration will determine whether the feeling of real-life face-to-face interactions can be met or exceeded.
Online conferencing was created as a result of the rapid development of the Internet and communication information technology (Messenger, 2016). Online conferences allow participants to collaborate remotely using their computers or mobile devices, and they provide a cost-effective alternative to spatially distributed teams in modern business. Online conferencing, on the other hand, is currently being debated as to whether it is truly effective in improving team collaboration performance and its extent, particularly
when it comes to identifying the best solution for decision-making tasks (Tur- ner, 1998). The current main solution for online conferencing is voice-video conferencing. As these solutions lack face-to-face interaction and implied non-verbal cues, most people still prefer direct face-to-face communication.
The adoption of online conferencing has increased dramatically in recent years due to the impact of the new influenza pandemic (Gartner, 2020). Due to the advantages of online conferencing in terms of flexibility, affordability, and accessibility, it has now become a common tool in people’s work and lives (Palmer, 2021). Among them, online meeting systems, represented by Zoom, have been widely implemented in various industry sectors, allowing people to stay in communication and helping society and the economy to continue functioning (Toney, 2021). However, the overuse of online meeting tools can cause fatigue and burnout, which is known as “Zoom Fatigue.” Scientists from various disciplines have defined this phenomenon differently (Abdelrahman, 2022; Wiederhold, 2020; Lee, 2020), while there are studies that confirm the importance of this problem (Asgari, 2021; Rump, 2020;). There are two main causes of zoom fatigue: (1) cognitive load: online confere- ncing require participants to constantly maintain eye contact while constantly switching between visual and auditory information, which leads to higher cognitive load. (2) Without a social presence, online conferencing are missing nonverbal cues and social cues that exist in interpersonal interactions, which may lead to communication difficulties and a sense of disconnection (Bailen- son, 2021; Fauville, 2021). Riedl derived six root causes of Zoom Fatigue based on media naturalness theory: the asynchronous nature of communica- tion (e.g., poor internet connection), the lack of nonverbal cues (e.g., body language and facial emotions), the lack of eye contact, mirroring anxiety (e.g., the need to maintain eye contact), unnatural interactions with multiple faces (e.g., excessive screen time), and multitasking during online conferencing (e.g., blurred boundaries between work and personal life) (Riedl, 2020).
To address the limitations of online conferencing, some researchers have proposed that low-immersion virtual reality (VR) can be displayed on a computer to enable social interactions close to those in 3D space (Fruch- ter, 2018). For example, some have proposed gestures and eye sharing in the form of visual augmentation on head-mounted displays (HMDs) (Tecchia, 2012; Higuch, 2016). One can also use spatial auditory cues to convey inte- ractive information in human-computer interaction (HCI) (Tikander, 2008). Sensory stimulation may help reduce the cognitive load of certain features. There is evidence that cognitive load is better in stereovision compared to non-stereovision online sessions (Reiner, 2017). Online conferencing lacks the ability to convey nonverbal cues, which may affect the sense of social pre- sence (Smith, 2018), such as the inability to convey facial cues with emotional states to other attending members. These nonverbal auditory and visual cues are mainly spatialized voice, facial emotions, eye contact, and gestures. How- ever, current research has only revealed that these cues can have an impact on online conferencing or remote collaboration; their specific effects on the cognitive load and social presence of online conferencing and the relationship between them are not yet clear. Therefore, the purpose of the present study was to explore how these four communication cues affect team collaboration
The Effects of Communication Cues on Group Decision Making 529
in a group decision-making task. We designed a between-group study to compare and analyze the performance and experience of meeting discussi- ons under different interaction conditions in order to understand the specific effects and differences of these cues on teamwork in online conferencing.
METHORS Participants
In the study, we recruited 20 university students from Hunan University to form the sample (11 males and 9 females, ages ∈[20, 30], mean = 22.5, SD = 1.12). We asked participants to sign up for the experiment in groups of four who knew each other. We eventually recruited five groups of partici- pants, and these groups were randomly assigned to five interaction conditions with different communication cues. We collected demographic information about the participants and their use of online meetings. Participants all had experience with online meetings, with 80% of them indicating that they were for classes and other uses such as group work discussions, academic lectures, and interviews. Participants signed an informed consent form, which was approved by the local ethics committee. We did not provide any financial incentives for study participation.
Experimental Design To investigate how different communication cues (spatialized voice, facial emotions, eye contact, and gestures) affect participants’ performance and experience of face-to-face or online meeting communication in a group decision-making task, the experiment was designed as a between-groups study. We designed the following five interaction conditions with different communication cues (Table 1):
A1. Non-spatialized voice + gestures + eye contact + facial emotions: Participants communicate in different rooms using computers and videoconferencing software with the camera on. A2. Spatialized voice + gestures + eye contact + facial emotions: Parti- cipants communicate face-to-face in a conference room in a normal manner.
Table 1. Five interaction conditions with different communication cues.
Face to Face Normal Spatialized voice, gestures, eye contact, facial emotions With Mask Spatialized voice, gestures, eye contact Hidden Head Spatialized voice, gestures Hidden Body Spatialized voice
530 Chen and He
A3. Spatialized voice + gestures + eye contact: Participants communicate in a conference room while wearing a mask (only the eyes are exposed). A4. Spatialized voice + gesture: Participants communicated in a conference room across a screen, but the screen only covered their heads. A5. Spatialized voice: Participants communicate in a conference room across a screen that obscures their entire body.
In simple terms, A1 is an online meeting and A2 is a face-to-face commu- nication; the difference between the two is whether the voice is spatialized or not. A3, A4, and A5, on the other hand, are progressively less of a com- munication cue based on A2. The differences between them are shown in Table 2.
Material and Experimental Task The experimental task was a group decision task in which each group member had to select the best candidate in a personnel selection case. We prepared a paper profile consisting of information about the four candidates. We used the hidden profile paradigm from the study of Schulz-Hardt et al. (2018) to set up the candidate information, where the complete information of each candidate describes the personal characteristics through seven attributes that have positive or negative values. And among these candidates, only one is the best, so this requires the panelists to consider the positive and negative attributes of all the candidates together.
Each panelist receives a different candidate profile. Candidate profiles contain both shared information (provided to all panelists) and unshared information (provided only to individual panelists). At the same time, some of the candidate information is in parts that are intentionally misleading, which obscures more favorable information about the best candidate than other candidates. Therefore, the panelists need to discuss and exchange enough valid information with each other for them to make the right decision.
Measurements We recorded task completion time as an objective measure to gauge parti- cipants’ performance in each interaction condition. We used questionnaire scales to quantify participants’ experiences and measure subjective feedback. We measured social presence using the Networked Mind Measure of Social Presence Questionnaire (SPQ) (Harms, 2006), which was employed to assess whether different communication cues influenced participants’ perceptions of social connectedness with others. We measured cognitive load using the NASA Task Load Index Questionnaire (NASA-TLX) (Sandra, 2006) to assess whether different communication cues affected participants’ workload on a group decision-making task. We also used the System Usability Scale (SUS)
Table 2. The missing cues between the pairing interaction conditions.
The Effects of Communication Cues on Group Decision Making 531
(Brooke, 1996) to assess the usability of different interaction conditions and the combined effect of communication cues on the group decision-making task. Also, we fine-tuned these questionnaire scales according to the experi- mental tasks provided in this experiment to make it easier for participants to understand our questions. We recorded the entire experiment for each group using HD camera equipment, which was allowed by all participants.
Procedure We divided the experimental process into two phases: a preparation phase and a testing phase. In the preparation phase, the cohort members of groups A1–A4 (face-to-face communication) were brought into a conference room, while the four members of group A5 (online meeting) were brought into a different room and sat in front of a computer. Before starting the experiment, we would introduce the experimental procedure and precautions to the parti- cipants and familiarize them with the meeting environment (for the A5 group, participants were allowed to adapt to using the videoconferencing software and equipment in advance). During the testing phase, we first distributed paper materials with information about the candidates to the participants and asked them to read the materials in their hands quietly. Five minutes later, we prompted the participants to finish reading and start their discussion. Then, participants were asked to communicate and exchange information with each other, and finally to choose the candidate they thought was the best, with no time limit on the process. The test can only end if the group members select the best candidate; otherwise, they are prompted to continue the discussion. At the end of the test, participants are invited to fill out a questionnaire about their experience of the session. We recorded the entire experiment for each group using cameras, which was allowed by all participants.
RESULT
In this section, we report the results of tests in which participants completed a group decision-making task under five interaction conditions, incorporating statistical analysis (significance level = 0.05) and effect values (ES). Statistical significance indicates the probability that the observed differences are due to systematic factors rather than chance, while effect values are values that quantify the strength of this differentiation phenomenon, with larger absolute values indicating more significant differences. ES ∈[0, 1] interprets 0.1 as a small effect, 0.3 as a moderate effect, and above 0.5 as a strong effect.
Task completion time Since the core task of our experiment was group decision-making, we focused on the time taken by the members of the group from the beginning of the discussion to the process of making the correct decision. As shown in Table 2, we counted the task completion times of five groups: A1 = 418s, A2 = 1265s, A3 = 1718s, A4 = 713s, and A5 = 988s. Their magnitude relationships were A3>A2>A5>A4>A1. The differences in task completion times for each of the two adjacent interaction conditions were A1-A2 = −847, A2-A3 = −453, A3-A4 = 1005, and A4-A5 = −275.
532 Chen and He
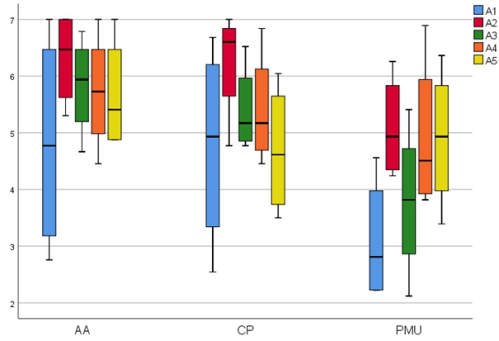
Social Presence As we focused on the effects of different communication cues on participants’ attention and presence perceptions, we used three subscales from the SPQ (Harms and Biocca, 2006): attention allocation (AA), co-presence perception (CP) and perceived message understanding (PMU). A 7-point Likert scale (1: strongly disagree—7: strongly agree) was used for these subscales. We counted participants’ social presence in the five interaction conditions and plotted box plots (Figure 1).
Figure 1: Results of the social presence questionnaire.
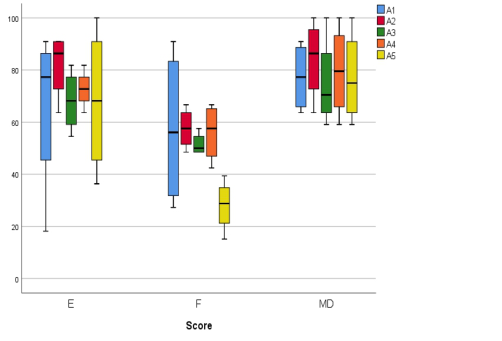
Cognitive Load In order to compare participants’ cognitive loads in different interaction con- ditions, we used the NASA-TLX questionnaire (Sandra, 2006) to assess their cognitive loads. In the current experiment, we focused on the three most rele- vant scoring items of the NASA-TLX questionnaire: mental demand, effort, and frustration. Each scoring item has a full score of 100 on a 5-point scale (0:
Figure 2: Results of the NASA-TLX questionnaire.
The Effects of Communication Cues on Group Decision Making 533
very low load; 100: very high load, with higher scores being worse). We coun- ted and plotted box plots of cognitive load for the five interaction conditions (Figure 2).
System Usability We used the SUS questionnaire (Brooke et al., 1996) to assess the usabi- lity of different communication cues for the group decision-making task. We summarize the results in Table 3.
Table 3. The SUS mean score, median score, and SD value of the 5 interaction conditions.
According to the task completion time results for the five interaction condi- tions, participants wearing masks for face-to-face communication (A3) took the most time to complete the task, while the online meeting (A1) required the least time to complete the task, with a significant difference between the two. Comparing task completion times for adjacent interaction conditions in turn, the time difference was negative, except for A3-A4, where the time dif- ference was positive. This indicates that the integration of eye contact reduces task completion time, while other communication cues slow task completion Since A2 was a normal face-to-face interaction, we used A2 as a refe- rence for all scores. According to the Shapiro-Wilk test, the scores of all items of the social presence scale followed a normal distribution with a sati- sfied chi-squareness. We, therefore, used a one-way ANOVA test to examine the overall differences between groups, and we found significant differences between interaction conditions for all rated items but with smaller ES: AA (F (4, 15) = 0.764, p < 0.05, ES = 0.169), CP (F (4, 15) = 1.062, p < 0.05, ES = 0.221), and PMU (F (4, 15) = 2.049, p < 0.05, ES = 0.353). To look for pairwise differences, we used the Bonferroni post hoc test. For AA, we found a significant difference only for A1-A2 (p < 0.05), with a significant increase in the mean score value. The mean score values for A2-A3, A3-A4, and A4-A5 decreased gradually, but none of them were significant (p > 0.05). This sug- gests that spatialized voice significantly improves attention allocation, while other communication cues also exist to improve attention. For CP, there was a significant increase in the mean score for A1-A2 (p < 0.05) and a decrease for A2-A3 and A4-A5 (p < 0.05), while there was no significant difference for A3-A4 (p > 0.05). This indicates that spatialized voice, facial emotions, and gestures increased participants’ sense of co-presence, while the effect of
534 Chen and He
eye contact was not significant. For PMU, we found significant pairwise dif- ferences for all adjacent interaction conditions. The mean ratings for A1-A2, A3-A4, and A4-A5 were increasing, while A2-A3 ratings were decreasing. This suggests that spatialized voice and facial emotions are more conducive to the degree of understanding of interactive information between participants. Combining the three rating items of the Social Presence Scale, we found that the integration of spatialized voice and facial emotions significantly improved the participants’ social presence.
For cognitive load, all interaction conditions followed a normal distribu- tion based on the Shapiro-Wilk test. We used a one-way ANOVA test to investigate overall differences, and the results showed significant differences in the small ES across interaction conditions for all rating items: e (F (4, 15) = 0.362, p < 0.05, ES = 0.088), F (4, 15) = 2.562, p < 0.05, ES = 0.406), and MD (F (4, 15) = 0.175, p < 0.05, ES = 0.45) We then used Bonfer- roni post hoc tests to look for pairwise differences that were significant (p < 0.05) for each pairwise condition. Overall, the change in all rating means was approximate, with A1-A2 and A3-A4 being up and A2-A3 and A4-A5 being down. This implies that spatialized voice, facial emotions, and gestures increase the physical and mental load of participants, while eye contact pro- vides some relief for them. In particular, for F of A4-A5, there is a significant decrease in the mean score, which indicates that gestures can significantly reduce participants’ frustration with the task. Combining the three scored items of the NASA-TLX scale, we found that the integration of eye contact was effective in reducing cognitive load.
For usability, a one-way ANOVA test revealed no significant differences between interaction conditions (F (4, 15) = 3.033, p > 0.05, ES = 0.447). However, as shown in Table 3, the usability of A5 was much lower than the other interaction conditions, suggesting that gestures were helpful for participants’ social interactions during the meeting.
CONCLUSION
Nonverbal cues improve the social interaction experience of online meetings, and we can intervene with auditory or visual sensory stimuli. Building on the literature on remote collaboration, we further demonstrate that different communication cues have different effects on team collaboration. Spatialized voice can significantly increase users’ social presence, and facial emotions can help them understand interactive information, but these cues may incre- ase the cognitive load on the interactive task. Eye contact, on the other hand, can reduce cognitive load. Gesture communication has a positive effect on social presence and interaction. These findings will help to achieve spa- tial interactivity in virtual environments. The combination of virtual reality and augmented reality technologies prompts remote collaboration in online meetings to approach the immersive effects of live face-to-face interaction.
ACKNOWLEDGMENT
The authors would like to acknowledge the support of the School of Design at Hunan University. Furthermore, the authors would like to thank Wenxiu
The Effects of Communication Cues on Group Decision Making 535
Yang, Ziling Feng, Jiaxin Zhou, and Gantian Bian for their great assistance in implementing the experiment.
REFERENCES
Abdelrahman, M.. (2022). The indefatigable worker: from factory floor to zoom avatar:. Critical Sociology, 48(1), 75–90. Asgari, S., Trajkovic, J., Rahmani, M., Zhang, W., Lo, R. C., & Sciortino, A.. (2021).
An observational study of engineering online education during the covid-19 pandemic. PLoS ONE (4). Bailenson, J. N. (2021). Nonverbal Overload: A Theoretical Argument for the Causes of Zoom Fatigue. Technology, Mind, and Behavior, 2(1). Brooke J et al (1996) SUS-a quick and dirty usability scale. Usability Eval Ind
189(194):4–7 Fauville, G., Luo, M., Muller Queiroz, A. C., Bailenson, J. N., & Hancock, J..
Nonverbal mechanisms predict zoom fatigue and explain why women experience higher levels than men. Social Science Electronic Publishing. Fruchter, R.. (2018). M3R: Transformative Impacts of Mixed Media Mixed Reality Collaborative Environment in Support of AEC Global Teamwork: Innovative Computer-Mediated Learning Technologies. Gartner. (2020). Gartner says worldwide end-user spending on cloud- based web conferencing solutions will grow nearly 25% in 2020. https://www.gartner.com/en/newsroom/press-releases/2020-06-02-gartner-sa ys-worldwide-end-user-spending-on-cloud-based-web-conferencing-solutions-w ill-grow-nearly-25-percent-in-2020 Harms, C., & Biocca, F. (2006). Internal Consistency and Reliability of the
Networked Minds Measure of Social Presence. Higuch, K., Yonetani, R., & Sato, Y.. (2016). Can Eye Help You?: Effects of Visualizing Eye Fixations on Remote Collaboration Scenarios for Physical Tasks. the 2016 CHI Conference. ACM. Lee, J. (2020). A neuropsychological exploration of Zoom fatigue. Psy- chia-
tric Times. https://www.psychiatrictimes.com/view/psychological-exploration-zo om-fatigue Messenger, J. C., & Gschwind, L.. (2016). Three generations of telework: new icts and the (r) evolution from home office to virtual office. New Technology Work & Employment, 31(3), 195–208. Mojzischb, S. H. &. A.. (2012). How to achieve synergy in group decision making:
lessons to be learned from the hidden profile paradigm. European Review of Social Psychology, 23(1), 305–343. Palmer, C.. (2021). Are virtual conferences here to stay?. Engineering. Reiner, D. M.. (2017). Eeg-based cognitive load of processing events in 3d virtual worlds is lower than processing events in 2d displays. International jour- nal of psychophysiology: official journal of the International Organization of Psychophysiology, 122. Riedl R. (2022). On the stress potential of videoconferencing: definition and root
causes of Zoom fatigue. Electronic markets, 32(1), 153–177. Rump, J., & Brandt, M. (2020b). Zoom-Fatigue – Phase 2. Bericht des Instituts für Beschäftigung und Employability. IBE. https://www.ibe-ludwigshafen.de/zoom_f atigue-phase2/ Sandra HG (2006) Development of NASA TLX: result of empirical and theoretical
research. San Jose State University, California
536 Chen and He
Smith, H. J., & Neff, M. P.. (2018). Communication Behavior in Embodied Virtual Reality. the 2018 CHI Conference. Tecchia, F., Alem, L., & Huang, W. (2012). 3D helping hands: a gesture based
MR system for remote collaboration. Acm Siggraph International Conference on Virtual-reality Continuum & Its Applications in Industry. ACM. Tikander, M., Karjalainen, M., & Riikonen, V.. (2008). AN AUGMENTED REALITY VOICE HEADSET. Toney, S., Light, J., & Urbaczewski, A. (2021). Fighting Zoom fatigue: Keeping the
zoombies at Bay. Communications of the Associa-tion for Information Systems, 48(6), 40–46. Turner, M. E., & Pratkanis, A. R. (1998). Twenty-Five Years of Groupthink Theory and Research: Lessons from the Evaluation of a Theory. Organizational behavior and human decision processes, 73(2/3), 105–115. https://doi.org/10.1006/obhd .1998.2756. Wiederhold B. K. (2020). Connecting Through Technology During the Coronavirus
Disease 2019 Pandemic: Avoiding “Zoom Fatigue”. Cyberpsychology, behavior and social networking, 23(7), 437–438.
LISTED IN THE AHFE DIGITAL BOOKSTORE CATALOGUE
Explore the complete digital volume
Usability and User Experience
Read this individual research paper free through the original publisher, or explore the full digital proceedings book.
ISBN 978-1-958651-86-5
Explore this ISBN in the AHFE Bookstore ↗Listed in the July 2026 bookstore catalogue; search by ISBN to confirm current availability · Digital book purchase optional