Yujia Du, Wang Haining, Yuxin Ju, Meng Qiu (2022). The Effects of Physical Load and Clamping Force on Prolonged Wearing of AR Glasses. In: Ergonomics In Design. AHFE Open Access, vol. 47, pp. 105–112. https://doi.org/10.54941/ahfe1001926
The wearing comfort of augmented reality (AR) glasses is of great importance to achieve prolonged and immersive experience. This study proposed an evaluation method for long-term wearing comfort of AR glasses. A frame prototype that can adjust the frame width smoothly was designed in this study. The effects of physical loads (30g, 45g, 60g, 75g) and clamping forces (0.3N, 0.6N, 0.9,N 1.2N, 1.5N) on subjective discomfort were also investigated. The results show a linear relationship between subjective discomfort, added physical load and increasing clamping force within an hour. It was found that the inflection point of subjective discomfort occurred when the physical load on the nose was 60g and the clamping force on the headside was 1.2N.
Augmented reality (AR) glasses have become the popular head-worn produ- cts in the consumer market (Zhuang et al., 2018). The future smart glasses are required with high comfort in daily wearing (Janssen et al., 2017). How- ever, customers usually feel uncomfortable or squeezed on the nose, ear and other support region of the head (Zhuang et al., 2018).
(Amft et al., 2015) claimed that weight was a key factor in smart glasses design. Since the center of the gravity usually concentrate on the front of the temples (Chang et al, 2018), nose discomfort is easily caused during long- term use. (Chang et al., 2014) found that the discomfort on nose decreases as the center of gravity of glasses moving toward the ear. According to (Spitzer et al., 1997), weight gain of glasses can significantly increase the pressure on ears and nose bridges. Since the center of gravity is close to the lens, it is normal to prevent the glasses from sliding down by increasing the clamping force on both sides of the head. (Mashima et al., 2011) claimed that reducing clamping force by adjusting the frame to fit the head could relieve ear pain and discomfort.
All in all, it is important to explore the influence of the pressure on the nose and the clamping force of temples on the headside during prolonged wearing of AR glasses. Three aspects were investigated in this study. (1) The relationship of physical load on the nose and corresponding subjective
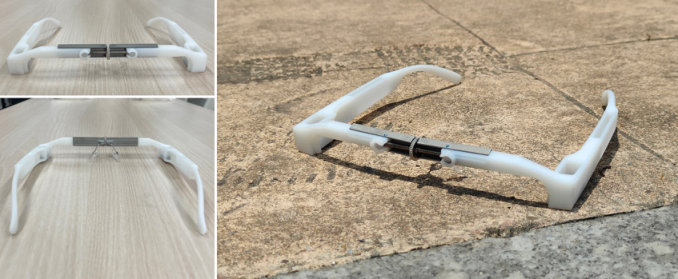
Figure 1: The frame prototype designed for this study.
discomfort. (2) The relationship of clamping force and corresponding sub- jective discomfort. (3) Weighting coefficient of wearing discomfort on the nose and headside.
MATERIALS
Prototype Design Considering the variety of subjects’ head shapes and sizes, a frame prototype that can implement smooth adjustment on temple width was designed in this study (see Figure 1). The frames were connected by a screw containing both left-hand and right-hand threads, moving conversely when turning the screw. Both temples were designed based on mainstream AR glasses on the market between 2019-2021. A weight slot was designed in the center of mass for weights to be added in the following experiment. For Chinese adults with a medium head width of 158mm (Wang et al., 2018), the adjustable range of the maximum clamping force for both temples were between 0N~2.0N.
Apparatus Two force sensing resistor (FSR) film sensors (FlexiForce A201 1lbs, Tekscan Inc, USA; ±3% accuracy) were used to continuously measure the clamping force on the headside.
The original weight of the glasses is 35g and the physical contact load on the nose area is approximately 30g. Magnetic weights were used to increase the pressure on the nose by adding into the weight slot in the frame prototype.
The Borg’s CR-100 scale (0 = no discomfort, 100 = extreme discomfort, Borg, 1998) was adopted in this study to measure and evaluate the subjective discomfort.
EXPERIMENTS Pre-experiment
(Bergstrom et al., 2000) and (Syberfeldt et al., 2017) proposed that the upper limit for the weight of smart glasses was 100g. (Kim. Y et al., 2021)
The Effects of Physical Load and Clamping Force 107
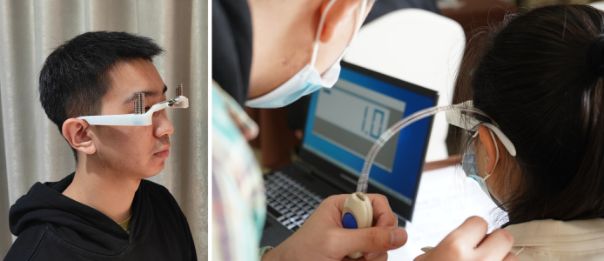
Figure 2: The process of experiment. (Left: The participant was wearing weighted prototype. Right: The clamping force was being measured).Table 1. The information of the 35 participants.
Table available in the original PDF paper.
In Total
Age Male Female Percentage of Wearing Glasses
Number of Wearing Glasses 18-25 6 6 64.2 8 12 26-35 6 6 71.2 9 12 36-45 6 5 63.8 7 11 In Total 18 17 68.57 24 35
emphasized that 39.13g±14.16g was the threshold levels for the perception of weight increase. According to previous studies and user feedback, four weight levels including 30g, 45g, 60g and 75g were adopted in this study.
Three types of glasses with clamping force levels of loose, medium and tight were utilized in the experiment. Eight participants (Head width: 157.88 ± 1.36mm) were recruited. The maximum clamping force that occurred in temple area was measured when wearing the frame. Finally, five clamping force levels were determined as: 0.3N, 0.6N, 0.9N, 1.2N, and 1.5N.
Main Experiment Thirty-five adults were recruited to participate in this research. The demo- graphic profiles are shown in Table 1.
At the beginning of the physical load experiment, the experimenter kept adjusting the glasses width for each participant until the maximum clam- ping force on the headside was 0.3N, which was measured by FSR film sensors. Weights were used to increase the pressure during the experiment (see Figure 2).
At the beginning of the clamping force experiment, the experimenter adju- sted the frame width to change maximum clamping force on the headside using FSR film sensors (see Figure 2) and kept the glasses weight the same as before.
To ensure that the subject was in a calm state, the emotion assessment was also conducted using the Self-Assessment Manikin (SAM) scale (Bradley and Lang, 1994) before the experiment. Each frame was worn for an hour and
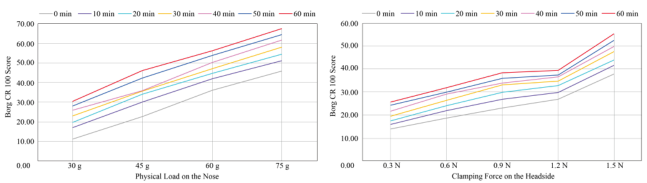
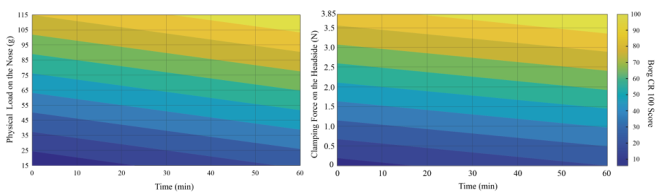
Figure 3: The mean scores of subjective discomforts of 35 participants (Left: the mean scores of nose discomfort. Right: the mean scores of headside discomfort).Figure 4: The illustration of the multiple linear regression (Left: subjective discom- fort ratings, physical load on nose and wearing duration. Right: subjective discomfort ratings, clamping force on the headside and wearing duration).
all discomfort ratings on the nose, ear, head and overall were measured every 10 minutes using the Brog-100 scale.
RESULTS
Physical Load on the Nose The mean scores of subjective nose discomfort of 35 participants are shown in Figure 3. A linear regression analysis was performed to assess a possible correlation that may exist between the subjective discomfort and physical load. It was found that all slopes over subjective discomfort ratings and phy- sical load were statistically significant at α=0.05 (0min: k = 0.787, 10min: k = 0.751, 20min: k = 0.753, 30min: k = 0.774, 40min: k = 0.811, 50min: k = 0.799, 60min: k = 0.808). It was proved that the subjective nose discom- fort also increased linearly with time (p<0.001). The nose discomfort caused by 30g weights had the slowest growth rate with time (30g: k = 0.303, 45g: k = 0.335, 60g: k = 0.319, 75g: k = 0.352).
A multiple linear regression was used to predict the nose discomfort ratings for different wearing duration and physical loads (refer to Figure 4). The mathematical representation of functional relationships can be expres- sed as (N: nose discomfort, t: wearing duration, g: physical load on the nose): N = −8.934 + 0.314*t + 0.775*g, (F = 445.731, p < 0.001, R2 = 0.485)
The Effects of Physical Load and Clamping Force 109
A multiple linear regression was conducted to assess the correlation betw- een the overall discomfort, nose discomfort and ear discomfort. The effect was found to be statistically significant and the functional relationship can be expressed as (S: overall discomfort, N: nose discomfort, E: ear discomfort): (1) 30g: S = 2.492 + 0.699*N + 0.265*E, (F = 358.365, p < 0.001, R2 = 0.770) (2) 45g: S = 0.319 + 0.848*N + 0.183*E, (F = 919.903, p < 0.001, R2 = 0.893) (3) 60g: S = 0.724 + 0.794*N + 0.200*E, (F = 809.449, p < 0.001, R2 = 0.872) (4) 75g: S = 2.840 + 0.785*N + 0.152*E, (F = 534.425, p < 0.001, R2 = 0.819)
The coefficient of N in the formulas above can be estimated as the weight of nose discomfort to overall discomfort. It can be found that the highest weight coefficient of nose discomfort was obtained when the physical load on the nose was 45g.
Clamping Force on the Headside The mean ratings of subjective headside discomfort of 35 participants are shown in Figure 2. It was found that discomfort ratings on the headside were positively and significantly associated with the clamping force except 0.9N and 1.2N. At every moment, the relationship of linear regression (0min: k = 0.383, 10min: k = 0.384, 20min: k = 0.408, 30min: k = 0.427, 40min: k = 422, 50min: k = 0.461, 60min: k = 0.460) were also signi- ficant. The wearing duration was also examined in line regression analysis with the subjective ratings and the relationship is also statistically significant (p < 0.001).
A multiple linear regression was performed to predict nose discomfort for different wearing duration and clamping forces (see Figure 3). The functional relationship can be expressed as (H: headside discomfort, t: wearing dura- tion, f: clamping force): H = 6.012 + 0.231*t + 20.813*f, ( F = 370.800, p < 0.001, R2=0.382) A linear relationship between overall, headside and ear discomfort ratings was observed (p<0.001). The functional relationship can be expressed as (S: overall discomfort, H: heaside discomfort, E: ear discomfort):
(1) 0.3N: S = 3.165 + 0.583*H + 0.445*E, (F = 198.022, p < 0.001, R2 = 0.644) (2) 0.6N: S = 1.066 + 0.867*H + 0.152*E, (F = 709.477, p < 0.001, R2 = 0.861) (3) 0.9N: S = 1.439 + 0.749*H + 0.241*E, (F = 752.106, p < 0.001, R2 = 0.870) (4) 1.2N: S = 1.839 + 0.612*H + 0.390*E, (F = 396.987, p < 0.001, R2 = 0.781) (5) 1.5N: S = 5.207 + 0.619*H + 0.309*E, (F = 335.281, p < 0.001, R2 = 0.752)
The coefficient of H in the formula can be defined as the weight of the headside discomfort in the overall discomfort. The largest proportion of discomfort on the headside was found when the clamping force was 0.6N.
DISCUSSION
Physical Load on the Nose During one hour of wearing the frame prototype, the subjective discomfort was increasing linearly with the added physical load on the nose. Accor- ding to the slopes at different wearing duration, it can be seen that the physical load has the least effect on nose discomfort at 10min (k = 0.751) and 20min (k = 0.753). At 40min (k = 0.811), it was found that physi- cal load had the greatest effect, which indicated subjects showed a sensitive perception of increasing pressure at 40min after a relatively steady growth. According to the subject interviews after the experiment, they usually experi- enced a numb nose period during the prolonged wearing. The differences in the sensitivity of nasal skin and soft tissue were caused by prolonged compression.
The increasing rate of nose discomfort decreased relative to 45g when wearing the prototype glasses with a physical load of 60g. The discomfort returned to a state of rapid growth when the load was increased to 75g. It can be explained that subjects were adapted to nasal pressure at 60g. The adaptation state was interrupted when the nose load continued to increase.
According to the weighting coefficient of nose discomfort in overall discomfort, the ear discomfort has the greatest impact when the nose load is the lowest. The discomfort on ear was gradually weakened with the incre- asing physical load until 75g. Nose discomfort had the greatest impact on overall discomfort at 45g and began to decrease with the added load. It is consistent with the previous conclusion that subjects go through a period of adaptation to nasal pressure when the physical load on the nose was 60g.
Clamping Force on the Headside According to the slope of the line regression over the subjective discomfort and clamping force, the data presented a steady period at the first ten minutes and between 30 min and 40 min. It indicated that clamping force have more influence on subjective discomfort at 20 min and 60 min.
The significance of the linear relationship between the clamping force and headside discomfort over time was observed. The slope (k = 0.004) when the clamping force is 1.2N is lower than that at 0.9N (k = 0.005), indicating that the subjects had a certain sense of adaptation to headside compression at 1.2N. After paired t-test results, there was no significant difference in head- side discomfort between 0.9N and 1.2N within one-hour wearing, which indicated that the discomfort on the headside did not increase significantly due to the increase of clamping force.
According to the weight coefficient, the headside discomfort is higher than that on the ear. This may be caused by the center of mass of the prototype front located. The weight coefficient of headside discomfort has a maximum
The Effects of Physical Load and Clamping Force 111
value when the clamping force is 0.6N and an inflection point occurred when the force is 1.2N which verifies the existence of an adaptive state when the clamping force is increased to a certain extent. It can be considered that 1.2N may be the critical point.
CONCLUSION
This study demonstrated the significance of the linear increase of subjective discomfort ratings with the physical load on the nose, the clamping force on the headside with the increasing time. In this paper, reference suggestions for weight and clamping force of AR glasses are given. The smaller the nose phy- sical load and the smaller the clamping force, the less discomfort. However, it can be considered to control the nose physical load no more than 60g and the temple clamping force within 1.2N if limited by technical conditions and production costs.
REFERENCES
Amft, O., Wahl, F., Ishimaru, S., & Kunze, K. (2015). “Making regular eyeglasses smart.” IEEE Pervasive Computing, 14(3), 32–43. Bergstrom, N., Chuang, C. L., Curley, M., Hildebrand, A., & Li, Z. W. (2000, May).
49.4: Ergonomic Wearable Personal Display. In SID Symposium Digest of Techni- cal Papers. Volume 31 No. 2., pp. 1138–1141. Oxford, UK: Blackwell Publishing Ltd. Borg, G. (1998). “Borg’s perceived exertion and pain scales.” Human kinetics. Bradley, M. M., & Lang, P. J. (1994). “Measuring emotion: the self-assessment manikin and the semantic differential.” Journal of behavior therapy and experimental psychiatry, 25(1), 49–59. Chang, J., Jung, K., Kim, W., Moon, S. K., Freivalds, A., Simpson, T. W., & Baik,
S. P. (2014). “Effects of weight balance on a 3D TV shutter type glasses: Subje- ctive discomfort and physical contact load on the nose.” International journal of industrial ergonomics, 44(6), 801–809. Chang, J., Moon, S. K., Jung, K., Kim, W., Parkinson, M., Freivalds, A., ... & Baik, S. P. (2018). “Glasses-type wearable computer displays: usability considerations examined with a 3D glasses case study.” Ergonomics, 61(5), 670–681. Janssen, S., Bolte, B., Nonnekes, J., Bittner, M., Bloem, B. R., Heida, T., ... & van
Wezel, R. J. (2017). “Usability of three-dimensional augmented visual cues deli- vered by smart glasses on (freezing of) gait in Parkinson’s disease. ” Frontiers in neurology, 8, 279. Kim, Y. M., Bahn, S., & Yun, M. H. (2021). “Wearing comfort and perceived heaviness of smart glasses.” Human Factors and Ergonomics in Manufacturing & Service Industries, 31(5), 484–495. Mashima, M., Yoshida, H., & Kamijo, M. (2011, September). “Investigation of
wearing comfort of eyeglasses with emphasis on pain around the ears.” In 2011 International Conference on Biometrics and Kansei Engineering. pp. 228–231. Spitzer, M. B., Rensing, N. M., McClelland, R., & Aquilino, P. (1997, October).
“Eyeglass-based systems for wearable computing.” In Digest of papers. First international symposium on wearable computers. pp. 48–51. Syberfeldt, A., Danielsson, O., & Gustavsson, P. (2017). “Augmented reality smart glasses in the smart factory: Product evaluation guidelines and review of available products.” Ieee Access, 5, 9118–9130.
Wang, H., Yang, W., Yu, Y., Chen, W., & Ball, R. (2018). “3D digital anthropometric study on Chinese head and face.”In Proceedings of 3DBODY.TECH 2018–9th Int. Conference and Exhibition on 3D Body Scanning and Processing Technologies. pp. 287–295. Zhuang, J., Liu, Y., Jia, Y., & Huang, Y. (2018, July). “User discomfort evaluation
research on the weight and wearing mode of head-wearable device. ” In Inter- national Conference on Applied Human Factors and Ergonomics. pp. 98–110. Springer, Cham.
LISTED IN THE AHFE DIGITAL BOOKSTORE CATALOGUE
Explore the complete digital volume
Ergonomics In Design
Read this individual research paper free through the original publisher, or explore the full digital proceedings book.
ISBN 978-1-958651-23-0
Explore this ISBN in the AHFE Bookstore ↗Listed in the July 2026 bookstore catalogue; search by ISBN to confirm current availability · Digital book purchase optional