Obiageli Lawrentia Ngwu, Anika Rimu, Shuchisnigdha Deb (2022). How to Design Traffic Infrastructure to Support Cyclists’ Interaction with AVs: Teenage Cyclists’ Perceptions. In: Human Factors and Systems Interaction. AHFE Open Access, vol. 52, pp. 156–164. https://doi.org/10.54941/ahfe1002151
Cycling is a popular transportation mode for teenagers; however, statistics show that bicyclist fatalities on minor roads are higher for teenagers (44%) as compared to older bicyclists (28%). The implementation of automated vehicles (AVs) is expected to make roads safer. Nevertheless, very few studies have focused on cyclist-AV interaction, especially on teenage cyclist population. This study examines teenagers’ perceptions on infrastructures necessary to share roads with AVs. A virtual focus group study with twenty four participants evaluated six potential traffic infrastructure designs using discussion and survey questions. Participants’ data on demographics, generic cycling behavior, and personal innovativeness were collected. Results show that participants showing risky cycling behaviors on roads were more flexible in design guidelines compared to teenagers exhibiting positive cycling behaviors. Teenagers mentioned coherent, direct, safe, and comfortable being the most important factors to design supporting infrastructures for AVs. They preferred spacious bike lanes, clear markings, clearance between cyclist and vehicle lanes, and physical barriers separating AVs and cyclists.
Since its introduction as a form of mobility, the bicycle has remained an inte- gral part of the transport system. In recent decades, its acknowledgment as one of the most sustainable modes of transport has brought it to the forefront of the mobility landscape. Cycling provides inherent, incredible, and indefinite benefits in the form of zero dependence on energy sources, zero greenhouse gas emissions and pollution, and improved health arising from increased physical activity (Dekoster & Schollaert, 1999). Additionally, bicycles can provide critical support to the urban and rural people who do not have access to essential mobility for livelihood, education, and other neces- sary activities (The Energy and Resources Institute, 2018). Even with these positive effects of cycling in the city, the overall safety of the cyclist has con- tinued to elicit concern; this concern is mainly due to the fact that the cyclist is not as physically secured as drivers of vehicles. It is argued that, unlike the conventional vehicles, entirely driven by a human driver, autonomous vehi- cles (AVs) will be programmed to avoid traffic collisions and improve overall
How to Design Traffic Infrastructure to Support Cyclists’ Interaction with AVs 157
road safety. However, it is reasoned that the implementation of AVs will pose many challenges for those who plan and design transportation infrastructure (Lutin & Kaunbauser, 2013). Lyon et al. (2017) averred that, since all AVs are designed to interact with their surrounding environment, it is likely that enabling infrastructure of some form will be needed over time, as and when AVs enter the road network. They emphasize that irrespective of which AV technologies level (Level 0 – Level 5) enter the traffic system, there will be a need for ongoing consideration of the changes needed to allow road infra- structure and related systems to manage mobility best. This is to say that the traffic infrastructure may not remain the same; the present infrastructure suits the conventional vehicle, and therefore adjustments and modifications would need to be made to accommodate the driverless car.
Lyon et al. (2017) raised a significant concern with how AVs and tra- ditional vehicles interact on the road network. They wondered about the pattern of traffic restructuring, especially if road lanes or parts of a city will be solely designated for AV use, or if AVs and traditional vehicles along with other road-users will be allowed to operate on the same road segments. The interaction between automated vehicles and cyclists is of utmost importance because cyclists represent a significant population of road traffic. More cri- tical is the fact that cyclists are not a homogenous group; all cyclists are not the same as there are differences concerning age, gender, experience, as well as with their cycling behaviors and willingness to interact with new techno- logies. The target population of the present study is teenage cyclist. As this future population will interact with these automated vehicles, their input in designing supporting infrastructure for AVs is crucial. This paper discusses teenage cyclists’ preference for traffic infrastructures based on their cycling behavior and personal innovativeness. The outcome of this research can be used by practitioners and policy makers to bring necessary changes to make interaction with AVs easier and safer.
LITERATURE REVIEW
Cyclist Behavior Based on the past literature and accidents, National Highway Traffic Safety Administration (NHTSA) reported many common causes contributing tow- ard bicycle-related crashes (NHTSA, 2019). These causes may include lack of proper infrastructures assigned for bicyclists; wrong choice of bike that does not properly fit the cyclist or has mechanical failure; bicyclists not wea- ring a helmet while cycling and not wearing reflective clothing while cycling in dark; poor compliance with traffic laws and improper use of facilities for cycling or crossing roads; riding at high speeds or engaging in competitive riding; losing control of the bicycle; unfamiliarity with cycling route or area; riding under the influence of alcohol or illicit substances; riding with distra- ction from mobile devices; and riding despite environmental hazards like road anomalies or adverse weather conditions (NHTSA, 2019). For most of these cases, it is up to the cyclists to evaluate safety measures and take proper pre- cautions to avoid accidents. When there is a motor vehicle crash involving cyclist(s), it is most likely that the cyclist will suffer severe consequences.
However, there are still many instances when cyclists show risky behaviors and become involved in a fatal crash or severe injury incidents. Therefore, it is very important to understand cyclists’ behavior on roads and investigate their suggestions on supporting infrastructures based on this behavioral clas- sification to make these designs inclusive, safe, and effective. The researchers seek to identify whether cyclists with frequent positive behaviors feel more comfortable sharing roads with AVs compared to cyclists showing frequent risky behaviors.
Personal Innovativeness Personal innovativeness is the individual’s propensity to act or react towards an object or idea (Agarwal and Prasad, 1998). In terms of this research, per- sonal innovativeness is the teenage cyclist’s willingness to accept AVs and supporting changes in the traffic environments. The goal is to test if tee- nagers with higher innovativeness prefers to share roads with AVs without additional supporting infrastructures.
Designing Traffic Infrastructure for Cyclists According to The Stationery Office (TSO, 2020), there are five design pri- nciples which represent the core requirements for people wishing to travel by cycle or on foot: coherence, directness, safety, comfort, and attractive- ness. Designers must provide infrastructure that meets these principles and therefore caters to the broadest range of people.
Coherent. Cycle networks should be planned and designed to allow people to reach their day-to-day destinations easily, along routes that are connected, simple to navigate, and consistently of high quality. Direction signs, road markings, and colored surfacing combined with physical design features can help provide coherence. In the context of this research, well-connected and weak-marked routes with designated spaces for AVs and cyclists will enhance navigation, especially for teenage cyclists who are interested in cycling but confused about traffic rules and safety.
Direct. Directness is measured in both distance and time. To make cycling a preferable option to driving short distances, cycling routes should be more direct compared to routes available for private motor vehicles. They should provide the shortest and fastest way of traveling from place to place by redu- cing the effort required to cycle. Automatically, such direct routes can make the road safer for teenage cyclists.
Safe. Implementation of AVs can reduce motor traffic volume and speed which may allow to develop separate, continued, and safer facilities for cycli- sts. Safety can be ensured by providing well-designed crossings and facilities at intersections where most casualties occur. Dedicated and protected spa- ces are reasonable means of safeguarding teenage cyclists in the automated environment.
Comfortable. Comfortable conditions for cycling require routes with good quality, well-maintained smooth surfaces, and adequate width for the users. Cycling is a social activity, and many people will want to cycle side by side and overtake another cyclist safely. Designers should consider convenience for all
How to Design Traffic Infrastructure to Support Cyclists’ Interaction with AVs 159
users such as children, families, and older and disabled people using three or four-wheeled cycles. Wider cycle lanes with clearance imply that cyclists are at a safe distance from automated vehicles, especially teenagers who most likely would like to showboat with their cycles occasionally.
Attractive. Cycling provides a more sensory experience than driving. Peo- ple are more directly exposed to the environment they are moving through and value attractive routes through parks, waterfront locations, and well- designed streets and squares. The environment should be attractive, stimu- lating, and free from litter or broken glass. Cycle infrastructure should help deliver public spaces that are well designed, include peaceful natural scenes, and places people want to spend time.
This study focuses on designing traffic infrastructure that suits the inte- raction between cyclists and automated vehicles. This study is vital because of the interaction between conventional non-motorized transports, such as the cycles, and unconventional or AVs can be confusing at the beginning of the implementation of AVs. In this regard, designers should consider cycli- sts’ generic cycling behavior and their personal innovativeness to understand their perception towards interacting with AVs and they should adhere strictly to the standard design parameters.
METHODOLOGY
Participants The study used a virtual focus group discussion with twenty four teenage participants, four to five in one group. The participants included ten male and 14 female teenagers aged from 13 to 19 years. There were seven middle- school, sixteen high-school, and one college aged teenagers who mostly use cycling for exercise purposes. Around half of them are frequent cyclists while the other half cycles less than 30 minutes a week. The inclusion criteria invo- lved having a computer with adequate internet connection, and being English speaker and experienced cycle rider.
Survey Instruments At the end of the discussion, participants answered survey questions using an online survey link. Survey instruments selected in this study included cyclist behavior questionnaire (Useche et al., 2018) and personal innovativeness scale (Agarwal and Prasad, 1998). These standard and valid surveys were modified for this study. The demographics information were collected for age, sex, education, cycling experience, etc. Additionally, survey items were used to collect rating data on cyclists’ preference of different infrastructu- res to share roads with AVs. The entire study lasted for an hour and each participant was compensated with $10 e-gift card.
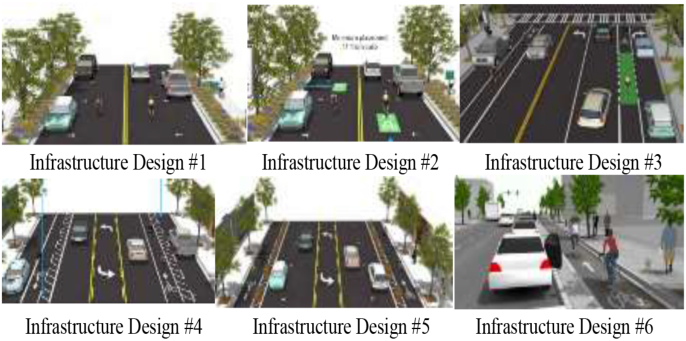
Potential Infrastructure Designs The infrastructure designs that were shared with participants are listed below (see Figure 1), in sequence. Different designs show different lane structures, markings, clearance, and separation styles. In infrastructure design #1, the
Figure 1: Potential traffic infrastructures for AVs and cyclists.
cyclists are sharing lane with AVs with no markings for cyclists. There are no clearances between the cyclists and the parked vehicle lanes. If someone comes out of the vehicle, the cyclist must stop and wait for the passenger to move out of the way. In infrastructure design #2, the cyclists are sharing lane with AVs with marked space for cyclists. There is clearance of three feet betw- een the cyclists and the parked vehicle lanes. For infrastructure design #3, there is a separate lane for the bicyclist, and they are separated by markings. There is clear separation between the vehicle and cyclist lane. Infrastructure design #4 has clear separation and markings for the vehicle and bicycle lane. It has clearance between the parked vehicle and bicycle lanes. Infrastructure design #5 has physical barriers separating vehicle and bicycle lanes. However, these barriers are not continuous; sometimes the cyclist can ride in the vehi- cle lane. Infrastructure design #6 has separate lanes for cyclists and vehicles. This design has a continuous physical barrier that cannot be crossed over by either cyclists or the vehicles.
Sources: KOA Corporation (2015); National Association of City Transpor- tation Officials. (n.d.)
RESULTS AND DISCUSSIONS Cyclist Behavior
A cyclist’s cycling behavior includes error and violation, aggressive behaviors, and positive behaviors. Each item is coded as 1(very infrequently or never) to 7 (very often or always). A higher score means that participants are more supportive to the statement. Mean and standard deviations are given in the tables below for each survey items. These behaviors have implications for the safety of the cyclist and other road users. Such behaviors include approaches to crossing the road, braking, relating with other road users, and using of gadgets in the course of cycling. The results of the inquiry are presented below in Table 1.
How to Design Traffic Infrastructure to Support Cyclists’ Interaction with AVs 161
Table 1. Means and standard deviations for cyclist behavior questionnaire items.
Table available in the original PDF paper.
Equation reproduced from the original PDF.
Errors and Violations
2.60 (1.90)
I go against the direction of traffic 2.35 (1.57) I cross over from the bicycle lane into the motor vehicle traffic lane 1.85 (1.37) I cross roads when it appears to be a clear crossing, even if traffic light is red
1.80 (1.24)
I cross the road without looking properly 1.55 (1.15) I brake suddenly to where I almost cause accidents 2.30 (1.78) I fail to notice the presence of pedestrians crossing when turning 1.65 (0.88) I do not brake on a “stop/yield” and come close to colliding with road-users 3.75 (2.22) I unintentionally hit a parked vehicle 1.45 (0.83) When crossing roads, I stay on my bike instead of getting off and walking
1.30 (0.47)
I cycle alongside friends and hold their hand/mess with them while cycling I talk over phone while cycling 1.70 (1.30) I listen to audio (news or music) while cycling 3.85 (2.37)
1.35 (0.93)
Aggressive Behaviors I yell at other road users if they do not follow the rules. 1.35 (0.93) I cycle around other road-users and “cut them off”, forcing them to brake
5.45 (1.47)
Positive Behaviors I try to move at an appropriate speed to avoid sudden collision or braking I usually keep a safe distance from vehicles and other road users 5.95 (0.95) I always use designated area to cycle and to cross. 5.70 (1.38)
For errors and violations and aggressiveness, most of the scores were below 3 (neutral point is 4), which indicate that teenage cyclists understand the traf- fic rules and follow them while cycling on the road. Only two statements under risky behaviors showed higher scores: however, they were still below the neutral point 4. These are the behaviors that are very common in inexperi- enced and teenage cyclist populations. The teenagers stay on their bikes while crossing a road and they like to listen to the music while cycling for recre- ation or exercise. These results confirm that although teenagers may think that they are well aware of most of the traffic rules, they still need to learn more to confirm their safety and safety of other road users. Aside from these statements on risky behaviors, few statements (positive behaviors) represent acceptable and responsible behavior in traffic. The participants, on average, rated them with higher scores (above the neutral point 4). The results indi- cate that, generally, the teenage respondents were against violating traffic rules, but also were more in favor of the questionnaire statements that focu- sed on complying with traffic rules, all for the sake of their personal safety.
Table 2. Means and standard deviations for personal innovativeness scale items.
Table available in the original PDF paper.
Personal Innovativeness Scale Items: 7-Point Likert Scale (N = 24) Mean (SD) 5.40 (1.19) If I heard about a new technology, I would look for ways to experiment with it
Among my peers, I am usually the first one to try out new technologies 4.20 (1.54) In general, I am hesitant to try out new technologies (reverse-scaled) 3.25 (1.21) I like to experiment with new technologies 5.60 (1.31)
These results are consistent with self-reported behaviors from other vulnera- ble road users in past studies (Deb et al., 2017; Granie et al., 2013) which showed people mostly shows positive behaviors on the road.
For each of the three factors in the cyclist behavior questionnaire, a sub- scale score was calculated by taking averages of the all the item scores under each factor. The composite score for cyclist behavior was calculated by adding together the three subscale scores, considering error and violation and aggres- sive behavior items as reverse scaled. Overall, all teenagers mostly preferred designs #4, #5, and #6 which not only provide separate lanes for cyclists but also provide additional space as clearance or barriers. Interestingly, teena- gers expressing frequent risky behaviors were more flexible toward sharing roads with AVs in the absence of physical barriers. Teenage cyclists show- ing mostly positive cycling behaviors were more stringent about keeping AV and cycle lanes separated with continuous physical barriers. In general, vul- nerable road users showing positive behaviors are conservative and are not willing to take risks. Therefore, it is obvious that they will trust AVs, but will still want separate cycling facilities for safe travel.
Personal Innovativeness Items in the personal innovativeness scale are coded from 1 (strongly disa- gree) to 7 (strongly agree). Mean and standard deviations are presented in Table 2. Most of the scores are higher than the neutral point 4 and for the reverse-scaled item, the score is lower than the neutral score 4. These results show that teenage cyclists would mostly agree to explore new technologies and would appreciate the deployment of AVs on the road given that they will safely share roads with the cyclists. This finding can be supported by previous research (Hartman and Samra, 2006; Park and Lee, 2011), which have found teenagers being significantly interested in accepting and adopting new technologies. A personal innovativeness score was calculated by avera- ging responses for each item, considering the third item as reverse scaled. Personal innovativeness did not show an influence on teenagers’ choice of traffic infrastructures. Limited sample size should be the reason for not fin- ding any significant difference on participants’ rating of infrastructures based on personal innovativeness.
Focus group discussion on potential infrastructure designs and ratings on these infrastructure designs (see Figure 1) confirm that teenagers highly pri- oritized traffic infrastructures with coherent, direct, safe, and comfortable features: spacious lanes; separated lanes for cyclists and AVs, most preferably
How to Design Traffic Infrastructure to Support Cyclists’ Interaction with AVs 163
with physical barriers; markings and signage for AVs and cyclists; necessary designated places for pickup/drop offs.
The inquiry on teenage cyclists’ suggestions on traffic infrastructure high- lighted the design principles considered in this research. Teenagers showed their concern about the presence of continuous bicycling facility to enable them to reach their destinations without being exposed to potential traf- fic crashes. Cyclist population who likes to cycle but are concerned about their safety consists of thre majority of the bicyclist group. They want AVs to be on separate lanes in order to make them distinguishable from traditional traffic. On general, teenagers want cyclists to be separated from any vehicu- lar lanes with wide clearance or continuous physical barriers. They did not show any significant difference in their perceptions about interacting with traditional and AVs. Direct, simple, and safe route for bicyclists was requi- red for these teenagers to trust sharing roads with AVs. The environmental attraction can be important to the bicyclists who like to enjoy comforting views during their physical activities. Teenagers mostly preferred disconne- cted bicycle lanes, away from traffic, and direct route to their destination as influencing factors for them to choose cycling over other transportation. They do not feel comfortable yet sharing roads with AVs despite all the safety features removing human errors.
CONCLUSION
As transportation needs are all changing, ongoing research is needed to design mobility landscape and build environments. These deign considerations need to involve the opinions and requirements of people of all ages and abilities. In order to encourage more people in active transportation, future researchers should give priorities to crosswalk and signal design at intersections. Due to COVID-19 pandemic, this study was not able to recruit more participants. Researchers will continue their effort collecting data from additional partici- pants and involve underrepresented populations to move their research effort to be more inclusive.
REFERENCES
Agarwal, R., & Prasad, J. (1998). A conceptual and operational definition of personal innovativeness in the domain of information technology. Information Systems Research, 9(2), 204–215. Deb, S., Strawderman, L., DuBien, J., Smith, B., Carruth, D. W., & Garrison, T. M.
(2017). Evaluating pedestrian behavior at crosswalks: Validation of a pedestrian behavior questionnaire for the US population. Accident Analysis & Prevention, 106, 191–201. Dekoster, J & Schollaert, U. (1999). Cycling: the way ahead for towns and cities. European Commission, DG XI — Environment, Nuclear Safety, and Civil Protection. Granié, M.A., Pannetier, M., Guého, L., 2013. Developing a self-reporting method
to measure pedestrian behaviors at all ages. Accid. Anal. Prev. 50, 830–839. Hartman, J. B., & Samra, Y. M. (2006). Employees of Tomorrow: How do Teenagers Interact with Technology and the World Wide Web Today?. Association on Employment Practices and Principles, 58.
KOA Corporation. (2015). Bicycle Transportation Action Plan. Available at https://ww5.cityofpasadena.net/transportation/wp-content/uploads/sites/6/2016/ 05/Pasadena-Bike-Action-Plan-08-17-2015.pdf. Lutin, J and Kaunbauser, A. (2013). The Revolutionary Development of Self-Driving
Vehicles and Implications for the Transportation Engineering Profession. Lyon, B; Nick Hudson, Michael Twycross, Dennis Finn, Steve Porter, Zoltan Maklary, Travis Waller. (2017). Automated vehicles do we know which road to take?. Infrastructure Partnerships, Australia, University of New South Wales School of Civil and Environmental Engineering. National Association of City Transportation Officials. (n.d.). One-Way Protected Cycle Tracks. Available at https://nacto.org/publication/urban-bikeway-design- guide/cycle-tracks/one-way-protected-cycle-tracks/. National Highway Traffic Safety Administration. (2019). Bicyclist and Pede-
strian Safety. https://www.nhtsa.gov/sites/nhtsa.dot.gov/files/documents/14046- pedestrian_bicyclist_safety_resources_030519_v2_tag.pdf. Park, B. W., & Lee, K. C. (2011, April). The effect of users’ characteristics and experiential factors on the compulsive usage of the smartphone. In International Con- ference on Ubiquitous Computing and Multimedia Applications (pp. 438–446). Springer, Berlin, Heidelberg. The Energy and Resources Institute (T E R I). (2018). Benefits of Cycling in India:
An Economic, Environmental, and Social Assessment New Delhi: The Energy and Resources Institute. 48pp. (Project Report No. 2017UD04 The Stationery Office. TSO (2020). Cycle Infrastructure Design. The Department of Transport. The United Kingdom. Useche, S. A., Montoro, L., Tomas, J. M., & Cendales, B. (2018). Validation of the
Cycling Behavior Questionnaire: a tool for measuring cyclists’ road behaviors. Transportation research part F: traffic psychology and behaviour, 58, 1021–1030.
LISTED IN THE AHFE DIGITAL BOOKSTORE CATALOGUE
Explore the complete digital volume
Human Factors and Systems Interaction
Read this individual research paper free through the original publisher, or explore the full digital proceedings book.
ISBN 978-1-958651-28-5
Explore this ISBN in the AHFE Bookstore ↗Listed in the July 2026 bookstore catalogue; search by ISBN to confirm current availability · Digital book purchase optional