Rogério Ribeiro, Daniel Raposo, Rita Almendra, João Neves (2022). Using Diagrams to Explain Brand Concepts and Implement Visual Identities. In: Human Factors in Communication of Design. AHFE Open Access, vol. 49, pp. 28–35. https://doi.org/10.54941/ahfe1002032
Most companies subcontract consultants or companies specialised in Design and Branding. In this context, most of the Visual Identity (re)design projects of the brand/corporate end up being developed externally to the companies.The Design and Branding consultant or company usually plays a role in the stages of request, research, concept, strategy, tactics and, tending to disappear during the operationalization or implementation.A brand Visual Identity project implies the participation of several external specialists who intervene in the implementation of tasks and components that must be integrated. In the same sense, it requires the participation and awareness of the company's employees, so that they are active participants in the effective communication of the brand, always ensuring its consistency over time.The operationalization steps of a brand/corporate Visual Identity are crucial for its success, regarding the adequate implementation in terms of graphic quality and coherence, but also in the perspective of brand management, which requires good brand-business integration and the monitoring and correction of actions that impact on people's understanding and experience with the brand.It is recognized the relevance of diagrams in improving the understanding, the accessibility, and the enjoyment of complex information.In this study, we intend to understand how diagrams allow explaining complex concepts in the Brand Design universe, namely business structures, organizations, or methods, with several levels of importance or sequence, with main cores and right or possible declinations or dependencies. The methodology of the study focuses on case studies of explanatory type and literature review.The results consist in identifying the most relevant and useful characteristics of diagrams in the visualisation of information, particularly to explain concepts and assist in the implementation of a brand/corporate Visual Identity.
STUDY FRAMEWORK Considering the brand as a public interface that mediates between the com- pany and the stakeholders, it is essential to understand the variables that influence this interaction.
Using Diagrams to Explain Brand Concepts and Implement Visual Identities 29
Table 1 and 2. Total Percentage (1) and Investment rate (2) of SMEs in Portugal, presented by size (INE. POR- DATA, 12-02-2022).
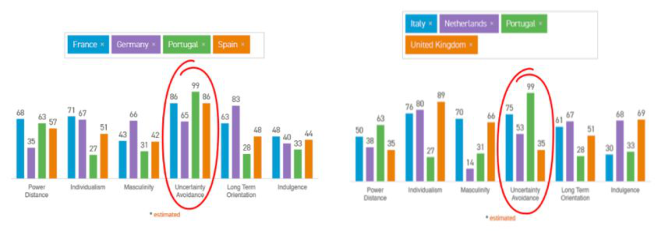
Figure 1: Comparison between the countries: France; Germany; Spain; Italy; Netherlands; United Kingdom and Portugal (HofstedeInsights, consulted on 05-02- 2021).
In small or medium sized companies, design tends to be non-resident, posing greater challenges to the creation and effective management of the brand and its visual identity, especially over a longer time horizon.
In Portugal, the business fabric is composed of 99.9% since 2004 by Micro, Small and Medium Enterprises, which are called SMEs, as confirmed by data from INE, consulted in PORDATA (2021) (see Table 1).
In these cases, the investment power is between 20% and 25% of the wealth they generate (see Table 2), which is perceived as a limitation in taking risks, betting on businesses that guarantee a return. For this same reason, the Portuguese business fabric has little flexibility and poor adaptation to rapid market changes, as we can see by the data that Hofstede Insights (n.d.) pre- sents us, where it is perceived, that Portugal is one of the people who most avoids uncertainty, that is, it looks for safer solutions (see Figure 1).
Most of the products they produce tend to be marketed by large compa- nies, although some of these SMEs invest in their own brands to market their
products or services, making little investment in their identity, being always reticent to any change in visual identity. In both cases, there is a weak relati- onship and consumer knowledge of their products or services, causing them to focus on what they think the consumer needs instead of effectively under- standing what the consumer wants. In addition, design is seen as a service provided to the company rather than as an integral part of any business.
Many companies do not seem to understand the advantages of investing in design and are still unaware of this concept, as already mentioned by several studies such as The Design Ladder (2007), conducted by the Danish Design Center (DDC) and the Danish National Agency for Enterprise in 2003 and 2007, or The Design Management Staircase, conducted by Gert Kootstra in 2009. In these studies, there are 4 stages where companies place themselves in relation to design or design management, being at the first stage, they do not use design; second stage, design as style, imitating or copying other examples; third stage, design as process and an integral part of the company’s function; and fourth level, design as innovation or culture. It can be said that com- panies that do not see design as a process, function, culture, or innovation, tend to resort to external services, which increases the probability of visual inconsistency, besides not contributing to the correct implementation of the brand identity.
Another conclusion, in both studies, was the relationship between inve- stment in design and its return, that is, companies that have an internal design department tend to have more financial return, better reputation and are more competitive at the export level. Both studies show that this relation- ship between investment in design and profit, where Companies that invest in design have a financial return of more than 20% compared to those that do not invest in design. This becomes even more evident if we check the Design Centric Organizations index (which includes, Apple, Starbucks, Stee- lcase, Nike, Herman-Miller, Procter & Gamber, among others), created by the Design Management Institute, which allows us to realize, in ten-year intervals (from 1993 to 2003 and from 2003 to 2013), that the financial performance of this index was three times higher compared to the Standard & Poors index (which includes the 500 largest listed companies in the USA) (Abecassis-Moedas, 2019).
In cases of brand Visual Identity implementation, it may entail the par- ticipation of several external experts who intervene in the implementation of tasks and components that must be integrated within the company. This requires the participation and knowledge of the company’s employees, and that they be active participants for the effective communication of the brand, ensuring its consistency over time.
These operationalization steps of a visual identity are crucial to its success, in terms of proper implementation in terms of graphic quality and consiste- ncy, but also from the perspective of brand management, which requires good brand-business integration and the monitoring and correction of actions that have an impact on the understanding and experience of people, both internal and external to the company, with the brand. Therefore, Design and Bran- ding consultants, hired as external services to the company, cannot disappear during the operationalization or implementation of the visual identity, as it
Using Diagrams to Explain Brand Concepts and Implement Visual Identities 31
usually happens, leaving companies more sensitive to the monetary value, valuing the pre-established relationship.
The relevance of diagrams to improve the understanding, accessibility and enjoyment of complex information is recognized. In this study, we intend to understand how diagrams allow explaining complex concepts in the Brand Design universe, namely business structures, organizations, or methods, with several levels of importance or sequence, with main cores and right or possible declinations or dependencies, using the explanatory case study methodology referred to by Yin (1994).
Explanatory Case Studies In 1928, in a post-war scenario, in Ivrea, Italy, the Olivetti advertising service was created, which in 1931, became known as the Development and Adver- tising Department, and was later transferred to Milan, in 1957, playing a key role in the company’s design and management activities (Costa, 2009).
This case is exemplary, demonstrating the importance of opening the com- pany to the outside, in order to start thinking “from the outside in”, creating brand management strategies, aiming to understand and improve the brand image that the public holds of the company. For the celebration of Olivetti’s 75th anniversary (1908–1983), Zorzi et al., (1983) provide us, on the cover, with a diagram that mirrors all the progress that this department had made up to that point, using information design to spread the company’s philoso- phy and aid the understanding of what Olivetti’s past, present and possible future had been, up to that point.
In this diagram (Figure 2) we can see that design, in different aspects, invo- lves the “Cultural Activities”of the company like triangular pieces of a puzzle. The “Cultural Activities” are in the center of the diagram, in a triangular shape, surrounded and occupying the faces of this triangle, we have “Typo- graphic Design”, “Interior Design” and “Exhibition Design”, with a triangle shape cut in half, in a zigzag shape. The “Cultural Activities” therefore sym- bolizes the cultural essence of the company, such as its beliefs and values to the surrounding society, which uses some design disciplines to manage what it delivers, both internally and externally.
On the side of “Typographic Design” and “Interior Design” we have the complete triangle of “Industrial Design”, implying that this discipline in the company was based on these two disciplines, which themselves were part of
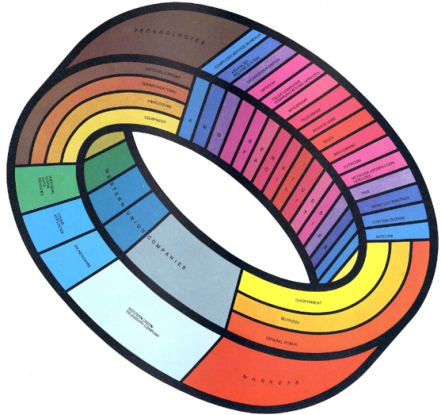
Figure 3: Möbius strip diagram, published in the Western Union annual report, created by Richard Hess & Hiroshi Morishima (Herdeg, 1981).
the “Cultural Activities” essence of the company. The same happens with the sides of “Typographic Design” and “Exhibition Design”, originating “Gra- phic Design and Advertising”, and with the sides of “Exhibition Design” and “Interior Design”, originating “Architectural Design”. Curiously, only filling the spaces left in zigzag of “Typographic Design”, we find the “Identification Systems”, completing the unfinished triangle. In this way, we can conclude that the development so far, already contemplated changes and additions to the structure, leaving space for “Exhibit Design” and “Interior Design” to be completed with other disciplines essential to business management.
Another interesting and important fact to highlight is that this diagram is continuous and growing, conveying the idea of temporal evolution, and transmitting that each lateral stroke represents a year in Olivetti’s history. This idea becomes even clearer in the continuation of this diagram from the back cover, starting smaller and increasing until the cover, with a slight shearing.
This diagram was based on Renzo Zorzi’s Corporate Image Direction (DIC), started in 1969, being a central point of Olivetti’s strategy (Raposo, 2021). It was the cover image and complement to the content of the com- pany’s 75th anniversary celebrations, integrating several types of materials, from brochures, covers or books, disseminated in several countries where the company was present at the time and published in different languages.
Another case is the Möbius strip diagram published in the Western Union annual report, created by Richard Hess & Hiroshi Morishima, as part of the book Graphis Diagrams: The Graphic Visualization of Abstract Data, edited by Walter Herdeg in 1981 (Figure 3). The format of the Möbius strip is integral and understandable, since it is a strip that is obtained by gluing the two ends of a tape together, after making a half-turn in one of them. It is
Using Diagrams to Explain Brand Concepts and Implement Visual Identities 33
named after the mathematician August Ferdinand Möbius, who studied it in 1858, publishing his work only in 1865. In this diagram, we have two ends with horizontal divisions and two others with vertical divisions. In the latter, we can perceive the “Western Union Companies” group and the “Services and Facilities” group, each of which is subdivided among several other fields, respectively, “Western Union Telegraph Company”, perhaps the size of the next three groups mentioned below, “PR Newswire”, Western Union Data Services”, “Other Affiiates”, and within “Services and Facilities” we find a series of possible tools to be used or even necessary to be able to perform the services it had provided until then.
In the horizontal divisions we have present two large groups, “Technolo- gies”, being subdivided between “Equipment”; “Processing”; “Communica- tions”and “Systems Support”; and the “Markets”group, which is subdivided between “Government”; “Business” and “General Public”. These link the “Western Union Companies” group to the “Services and Facilities” group, suggesting that it is thanks to this universe that Western Union can perform its services and that it gives them back to society in a way that it receives them back, in a constant, three-dimensional loop.
This format has a unique characteristic that, when we examine, with the pretension of understanding this diagram, we realize that all the phases of the track come together. In other words, if we run the strip from any point in the center of one of the faces of the strip, we realize that we take two loops of the strip, running it from one end to the other, returning to the same starting point. The same does not happen with cylindrical strips, glued without a half-turn at one end. In these, the path is internal or external.
From this point of view, we can perceive the intention of transmitting that in the management of the Western Union brand, there is not an internal route and an external one, all the elements being necessary and essential to the cul- ture, not only of the company but also of the operation of all those involved, not placing the company at the center of the process, but in the middle of the process.
If we do the exercise of building a Möbius strip and cutting strips along the strip, following, for example, the line that divides the “Government” from the “Business”, we get a circular strip longer than the previous one and with the particularity of being intertwined with the strip in question, we can conclude that the choice of this Möbius strip was not random and conveys the entire branding of Western Union.
CONCLUSION
More recently, due to the worldwide crisis generated by the SARS-CoV-2 virus pandemic, forcing people to be working remotely and companies to close down. Many businesses lost their source of income, and many others were forced to change the way they think and market their products and services.
Since 2010, the European Union has started its process, which is called “Closing the Loop - An Action Plan for the Circular Economy”. This Action
Plan for the Circular Economy presents a set of measures to promote the transition to a Circular Economy across Europe, and there are targets to be achieved such as a reduction in CO2 emissions, a reduction in the use of virgin materials, or an increased use of recycled materials (Sobre economia circular, 2019). Such challenges put even more pressure on SMEs to modify ways of thin- king, managing, acting and, most importantly, communicating. While on the one hand, large companies tend to have the structure and liquidity to address market and societal challenges with greater agility, the truth is that the problems increase proportionally in terms of complexity and size. An example of this is the number of partnerships, departments, branches, langu- ages, and markets, which require customization or local adjustments, making brand management even more difficult, reflected in the context of creating and implementing a brand or its visual identity. In both large companies and SMEs, and among their employees or external partners, resistance to change tends to arise, but also difficulties in understanding brand conce- pts and design principles, which can cause detours or losses in the brand program.
The relevance of diagrams to improve the understanding, accessibility and enjoyment of complex information is recognized, making the design task essential to explain complex concepts in the Brand Design universe, such as business structures, organizations, or methods, with various levels of impor- tance or sequence, with main cores and right or possible declinations or dependencies.
The most effective visual communications result from a care between stan- dardized and non-standardized approaches, because excessively conventional communications risk not captivating the viewer’s attention, as well as excessi- vely innovative communications may not be fully understood. In other words, the form and effectiveness of a visual communication depends on the vie- wer’s interpretation of the communicator’s intent in a specific environment. With technological evolution, it already becomes possible to start building an idea from concepts or diagrams, making these ideas travel through syner- gies between various fields of knowledge, and where technology assists in the process of this information, producing a visual form, as a starting point for the creation process (Franceschi, 2022).
As exposed, the identified cases demonstrate that the more varied and com- plex the structures and data are, the greater becomes the designer’s task and responsibility in finding and using, visual mechanisms capable of transmitting the messages inherent to the diagrams. Making the design to be understood not only as an aid in the sense of knowledge itself, organization, structure or flow, but also as a supplier of specific working tools, contributing to the decoding of knowledge, transforming it into information, either to materi- alize hypotheses, immaterial scenarios or interpersonal or multidisciplinary relationships, particularly to explain concepts in order to be possible to see the process, passing the message of the current or the evolution, in order to be possible to idealize future scenarios, helping in the implementation of a more efficient and understandable brand management by all stakeholders.
Using Diagrams to Explain Brand Concepts and Implement Visual Identities 35
ACKNOWLEDGMENT
The authors would like to acknowledge CIAUD, Lisbon School of Archite- cture, Universidade de Lisboa, Portugal and FCT – Foundation for Science and Technology, for their financial support. This paper is part of the research for doctorate in design carried out by Rogério Ribeiro.
REFERENCES
Abecassis-Moedas, C. (2019) O papel do design na inovação. Universidade Católica Editora. Costa, J. (2009) Imagen corporativa en el siglo XXI. Cuarta edi. Buenos Aires: La
Crujía Ediciones. Country Comparison - Hofstede Insights (no date). Available at: https://www.ho fstede-insights.com/country-comparison/italy,the-netherlands,portugal,the-uk/ (Accessed: 5 February 2021). Franceschi, R. B. (2022) The Archetype of Graphic Thinking. Visual Graphic Tool
that Analyses the Graphic, Creative and Project Thinking of the Product Designer, Perspectives on Design II, Research, Education and Practice. Edited by D. Raposo, J. Neves, and J. Silva. Cham: Springer International Publishing (Springer Series in Design and Innovation). doi: 10.1007/978-3-030-79879-6. Herdeg, W. (1981) Graphis Diagrams: The Graphic Visualization of Abstract Data.
Graphis Press (Graphic Press publication). Available at: https://books.google.pt/ books?id=kAAlAQAAIAAJ. Kootstra, G. L. (2009) The Incorporation of Design Management in Today’s Business Practices. An Analysis of Design Management Practices. Rotterdam. PORDATA - Pequenas e médias empresas em % do total de empresas: total e por
dimensão (2021). Available at: https://www.pordata.pt/Portugal/Pequenas+e+m édias+empresas+em+percentagem+do+total+de+empresas+total+e+por+dimen s~{a}o-2859 (Accessed: 5 January 2022). Raposo, D. (2021) ‘Cultura, Design, Competitividade e Inovação Empresarial’, IPCB CAMPUS, October, pp. 32–43. Available at: https://www.ipcb.pt/sites/default/file s/upload/cultura/files/ipcb_campus_2021_out.pdf. Sobre economia circular (2019) Circular Economy Portugal. Available at: https://ww
w.circulareconomy.pt/?page_id=413 (Accessed: 10 November 2020). The Design Ladder (2007) Copenhagen: Danish Bussiness Authority. Available at: ht tps://issuu.com/dansk_design_center/docs/design-ladder_en (Accessed: 13 Febru- ary 2021). Yin, R. K. (1994) Case Study Research-Design and Methods. 2nd ed., Applied Social
Research Methods Series - Volume 5. 2nd ed. SAGE Publications, Inc. Zorzi, R. et al. (1983) Design Process Olivetti 1908–1983. Olivetti. Available at: https://books.google.pt/books?id=J_hlnQAACAAJ.
LISTED IN THE AHFE DIGITAL BOOKSTORE CATALOGUE
Explore the complete digital volume
Human Factors in Communication of Design
Read this individual research paper free through the original publisher, or explore the full digital proceedings book.
ISBN 978-1-958651-25-4
Explore this ISBN in the AHFE Bookstore ↗Listed in the July 2026 bookstore catalogue; search by ISBN to confirm current availability · Digital book purchase optional