Ching I Chen, Meng-Cong Zheng, I Wen Yen (2022). The Achievement of Using Research Results from Mixed Methods in Design Workshop within Educational Scenario. In: Interdisciplinary Practice in Industrial Design. AHFE Open Access, vol. 48, pp. 34–40. https://doi.org/10.54941/ahfe1002013
We often combine several methods and tools when running a design workshop, e.g., brainstorming and affinity diagram. Suppose participants have many divergent ideas without fully understanding the design subject matter's users, behaviors, and scenes, although many ideas can be collected. In that case, the result is often difficult to focus on the problem they originally intended to solve. Therefore, this research wants to know whether the innovative ideas of participants are restricted by providing the same background material. And how to use different design thinking tools in combination to improve the effectiveness of the workshop. The design subject of this workshop is a recycling vehicle currently operated and managed by the government. The design goal is to design additional modules that can be used flexibly in the existing recycling vehicles to improve waste separation and recycling efficiency.Before implementing the design workshop, we collected many objective facts and subjective opinions through qualitative and quantitative investigation methods such as field observation, questionnaire survey, interview, and symposium. We visualized the survey results (photos, behavioral mapping, statistic chart, etc.) to form the materials for the design workshop. The workshop ran for eight hours in one day, and a total of 10 industrial design master class students were divided into two groups. Four stages guided the two workshop hosts in sequence: the KJ method, empathy map, user journey, and design sketch. There are four stages to guide the process. During the period, the two groups each reported an affinity diagram, two user journeys (one for cleaning staff and one for a citizen), and four empathy maps. Finally, a professor from the Industrial Design Institute will comment on the sketch.As a result, participants created ten sets of sketches focusing on problem-solving but with different innovative ideas. Participants also learned various design thinking tools in a short period. Using the mixed method research results as materials and combining different method tools to guide the process of the workshop will ultimately help the design workshop produce specific achievements.
The human-centered design thinking method consists of five stages: empathy, define, ideate, prototype, and test (Brown, 2008). The moderator can flexibly combine different methods to achieve design goals at different scales, appli- cation scenarios, and design schedules. One of the ways is to hold design workshops. Depending on the workshop’s goal, the moderator can use dif- ferent methods and tools. For example, brainstorming is practically applied in various fields. The purpose is to promote active discussion and enhance the generation of ideas (Gogus, 2012). The KJ method (or affinity graph) is thought to be collaborative, interpretive, and aimed at generating ideas for objective answers (Harboe & Huang, 2015) and insights into categorizing, identifying. Group qualitative data to shape design direction (Gkatzidou, Giacomin & Skrypchuk, 2021). However, suppose the participants do not understand the design object’s users, behaviors, and scenarios. In that case, although they can collect many ideas under many divergent ideas, the result is often difficult to focus on the original problem they want to solve.
The design object of this design workshop is a waste recycling vehicle under the operation and management of the current government. The design goal is to design additional modules that can be used flexibly in the exi- sting waste recycling vehicle compartment to improve the sorting efficiency. This workshop aims to produce design sketches that provide solutions to design problems. The workshop process combines different methods and tools to achieve the goals effectively. In addition, the workshop program
The Achievement of Using Research Results from Mixed Methods in Design Workshop 35
team prepared the results of previous mixed-method surveys of the public and cleaning staff on the recycling process and visualized the data as mate- rial for the workshop and looking forward to more insights from workshop participants. In addition to achieving the goals mentioned above, this study also wanted to understand how the visual materials in the five different rese- arch findings guided or influenced the participants’ thinking; and how the combination of various design thinking tools could improve the workshop’s effectiveness.
METHODS
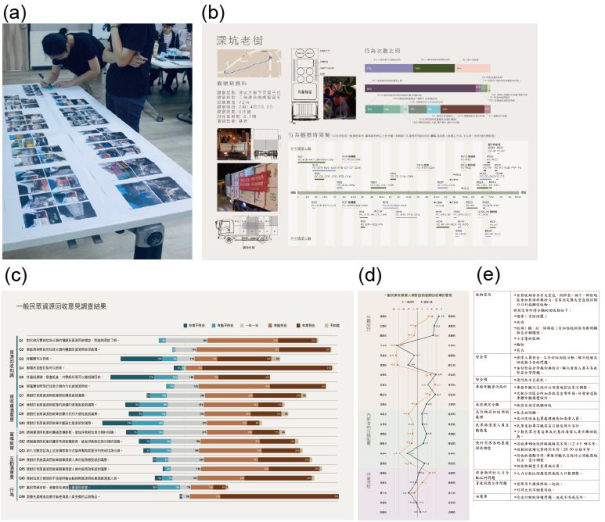
The members participating in the Waste Recycling Vehicle Innovation Module Workshop are ten master students from the Master Program of Innovation and Design, aged 21–25, four males and six females. The mode- rators divided the participants into A and B groups before the workshop started. The workshop planning team provided some visual materials, inclu- ding the following five items (see Figure 1): photos of actual conditions (a), behavioral mapping graph of observation results, (b), questionnaire stati- stics charts (c), semantic differences scale graph(d), and text list (e) of pros and cons from interviews (6 cleaners; 6 publics)/symposium (cleaners sessi- ons). The above five visual materials are obtained by the user-research team mixing qualitative and quantitative research methods. Including field obse- rvation of the use of waste recycling vehicles (observing road sections in seven different areas), the attitude scale and semantic difference scale of the cle- aning staffs (177 people) and the public (183 people) regarding the waste recycling process and vehicle design, and two results of the symposium and 12 semi-structured interviews (half of the cleaning staffs and half of the public) were compiled by item. The above materials are printed in A3 and arran- ged in the workshop space so that participants can refer to each phase at any time.
The workshop is planned in three phases within eight hours (see Table 1): 1) Each group uses the KJ method to produce an affinity map to focus on the problems and classify them. 2) Each group is required to complete the empathy map, Persona, and user journey map in a group. The goal is to empathize with users’ pain points and concretize the behavioral context of cleaning personnel and the public. After the above two phases are completed, the group’s representative must present the briefing results. 3) Each person must complete three design sketches (top view, side view, and 45-degree angle view), which will be reviewed by a professor of the Department of Industrial Design. Before each phase, the moderator will explain the ways and critical points of using various methods and tools. The entire workshop process is videotaped.
For educational purposes and the workshop’s outcomes, it also pays atten- tion to the “fermentation”process of the participants in the process. After the workshop, a Likert five-point attitude scale was provided for ten participants to fill out. The dimensions of the questions include evaluating the degree of agreement of the various visual materials provided on-site and the methods and tools used at each phase to the design thinking, interest, and expectation.
Figure 1: Five printed visual materials for participants to refer to.Table 1. Sample human systems integration test parameters (Folds et al. 2008).
Table available in the original PDF paper.
Phase I Phase II Phase III
The moderator explains the goals of the stage and how to use the tools
The moderator explains the goals of the stage and how to use the tools
Length of time 2 hours 3 hours 3 hours Main activities
The moderator explains the goals of the stage and how to use the tools
Sketch
Conduct KJ method
Conduct Empathy Map, Persona, and user journey map
Each group will be briefed on the results within 7 minutes
In the last 20 minutes, the professor will comment on the sketch
Each group will be briefed on the results within 10 minutes
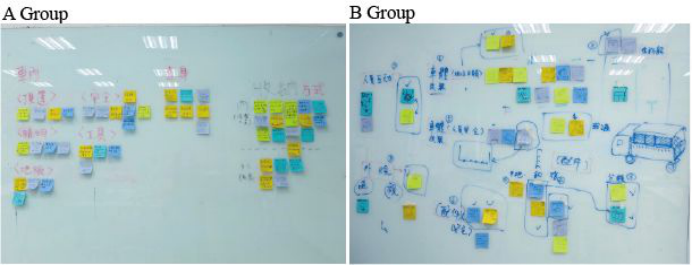
WORKSHOP OUTCOMES In Phase I, the KJ method, two groups of participants refer to the visual mate- rial of the research findings and write their thoughts on a sticky note, one piece of paper to write/draw only one thought. Then stick the sticky notes on the wall and categorize and name the categories. In the absence of other restri- ctions, the affinity graphs of the two groups A and B are presented differently (see Figure 2). Group A is classified by the compartment’s internal modules, appearance, and storage accessories; group B is organized by the waste clas- sification, personnel safety, and accessories. Judging from the affinity map
The Achievement of Using Research Results from Mixed Methods in Design Workshop 37
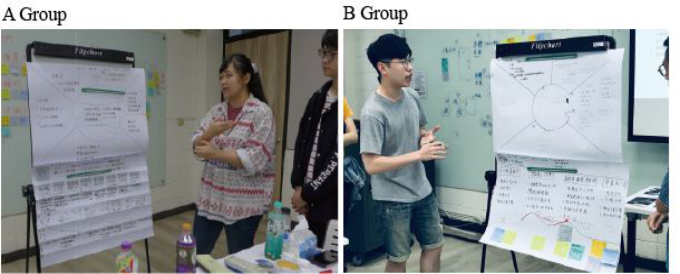
Figure 2: The different induction modes of groups A and B are presented in the affinity diagram.Figure 3: The Empathy Map and User Journey of cleaning staff-oriented with the two groups.
posting status, group B showed the context of waste recycling, which was different from group A.
Phase II is to empathize with the user. Each group completed one empathy map for the cleaning staff and one for the public (see Figure 3). Participants should think about the people and things they might see, say, do, hear, think, and feel in their work process and empathize with the users’ pain and needs. On the other hand, each group must complete the user journey map, starting from the personas (for the cleaning staff and the public). Simulate a period and situation of waste recycling to describe the events, touchpoints, pain, and feelings users encounter during a task. Each group completed two empathy maps and two user journey maps within 3 hours.
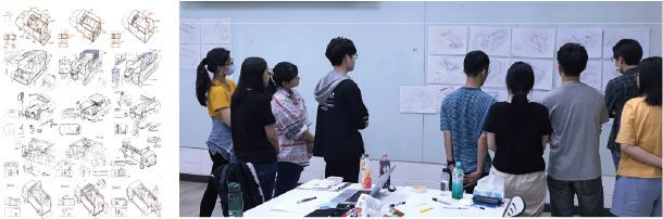
After the participants went through the first two phases of the design thin- king method, from the divergent ideas to the convergence into the design conditions, the Phase III of sketch design began. Each person completed one sketch each for the top view, side view, and 45-degree angle view, resulting in a total of 30 sketch designs. Finally, the Department of Industrial Design professors will evaluate the drawings and classify the design conditions of the sketches (see Figure 4).
Figure 4: The left is a part of the sketch design, and the right is the evaluation process by the professor.
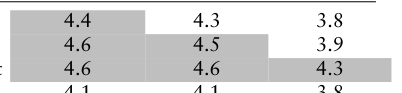
PARTICIPANTS’ QUESTIONNAIRE RESULTS After the workshop, ten participants completed the questionnaire. A five- point scale is used to score the degree of agreement, with 1 point for strongly disagree, 2 points for somewhat agree, 3 points for neutral, 4 points for some- what agree, and 5 points for strongly agree. Seven of them have attended 3-5 design workshops in the past, and three have attended more than six times. Participants thought that the visual materials provided in this workshop were helpful: “I think the [visual materials] provided in this workshop can help me [assistance item].” The statistics are shown in Table 2, grayed cells meant above average, between somewhat agree and strongly agree.
The visual materials that the participants expected to be used again in the design workshop in the future are the photos of actual conditions (M = 4.8), the user questionnaire statistical chart (M = 4.8), Pros and Cons in Text List (M = 4.7), and the behavioral mapping graph of the observation results (M = 4.6), and the Semantic Difference Scale graph (M = 4.2).
In terms of methods and tools used at various phases of the workshop to assist participants in developing ideas: “I think the process of [methods/to- ols] used in this workshop can help me [assist the items].” Agree Statistics are shown in Table 3. The gray cells are above average, ranging between somewhat agree and strongly agree.
Participants found the three methods interesting and agreed on average, in descending order of user journey (M = 4.9), empathy map (M = 4.7), and KJ method (M = 4.5). The methods/tools that are expected to be used again in the future, the average degree from high to low, is the user journey (M = 4.9), the empathy map (M = 4.8), and the KJ method (M = 4.3). It is worth mentioning that the participants believed that this workshop was more focused on design problems than previous workshops (M = 4.5). At the same time, they thought that the sketches could respond to the workshop’s goal and solve users’ problems (M = 4.7).
DISCUSSION
The results show that the “Questionnaire Statistical Chart”can assist in three aspects: defining problems, empathizing with users, and Inspiring ideas. After interviewing the participants, we learned that the participants could discover
The Achievement of Using Research Results from Mixed Methods in Design Workshop 39
Table 2. Attitude scale’s average of visual materials assisting participants in
Assistance
Empathizing Inspiring Defining problems with users Ideas
each phase. aaaaaaaaaaaa Visual Materials Photos of actual conditions 4.4 4.3 3.8 Behavioral Mapping Graph 4.6 4.5 3.9 Questionnaire Statistical Chart 4.6 4.6 4.3 Semantic Difference Scale 4.1 4.1 3.8 Pros and Cons in Text List 4.3 4.6 4.2 Average 4.4 4.4 4.0
Empathizing Inspiring
Sketch
Assistance Defining problems with users
Ideas
Promote consensus
Table 3. Attitude scale’s average of methods/tools assisting participants in each phase. aaaaaaaaa Methods KJ method 4.3 4.1 4.4 4.6 4.5 Empathy Map 4.4 4.7 4.2 4.6 4.1 User Journey Map 4.6 4.7 4.1 4.4 4 Average 4.4 4.5 4.2 4.5 4.2
the various satisfaction degree of the public in the interaction with the cle- aning staff or vehicles during the resource recycling process. The data can support problem-solving and their priority. In addition, demographic stati- stics such as gender and age can be learned in the questionnaire statistics chart, which can assist in the definition of Persona in the “empathy” phase and develop empathy maps and user journey maps.
The Behavior Mapping also scored high on the defining problem and 4.5 on the empathy aspect. The moderator observed that both groups repeatedly looked at the behavioral mapping as they developed the user journey map during the process. Participants said that since the user journey map inclu- des a timeline to understand the behavior and interaction of the public and the cleaning staff when the recycling vehicle arrives at the community road section, information can be obtained from the behavior mapping. The “Pros and Cons in Text List,” compared with the “Photos of actual conditions,” allows participants to empathize with the user’s situation and feelings more specifically and imagine their use scenario. That’s why “Pros and Cons in Text List” has a high score of 4.6 for Empathizing with Users.
Regarding the methods/tools used in each stage, the participants indicated that the KJ method has a more divergent way of thinking, so it scored higher in “inspiring ideas.”In addition to the text, the participants also hand-painted some pictures on the post-it notes, which is very helpful for the subsequent “concept sketches.” The user journey map is completed before the empa- thy map. The most significant difference between the user journey and the empathy map is that it includes Persona and a timeline so that participants
will consider more details. When the designer stands in the perspective of a precisely defined Persona, it is more empathetic.
The KJ method and the empathy map are higher in terms of “promoting consensus” because each group adds ideas and discusses them in completing these two parts. It takes a lot of effort and time to draw the user journey, and each group must assign members to each of the two graphs. Therefore, the score in promoting consensus is lower than the other two methods. In the end, the “user journey map” was the most exciting tool for participants, with an average of 4.9, and they look forward to using this tool again in human-centered design workshops in the future.
CONCLUSION
This research uses mixed methods survey results as visual materials. In addi- tion to explicitly providing the subjective and objective perspectives of the participants in the human-centered design workshop, it can also be used with different methods/tools to guide the workshop process. It can also satisfy the participants in design thinking development and outcomes in different phases. At the same time, the participants have positive feedback on the process and learn various design thinking tools quickly, which achieves the educational purpose of using design thinking and can be used in the future.
REFERENCES
Brown, T. (2008). Design thinking. Harvard business review, 86(6), 84. Gogus, A. (2012). Brainstorming and Learning. In: Seel N.M. (eds) Encyclopedia of the Sciences of Learning. Springer, Boston, MA. https://doi.org/10.1007/978-1- 4419-1428-6_491 Harboe, Gunnar and Huang, Elaine M. (2015). Real-World Affinity Diagramming
Practices: Bridging the Paper-Digital Gap. Proceedings of the 33rd Annual ACM Conference on Human Factors in Computing Systems, Association for Computing Machinery, 95–104. Gkatzidou, Voula, Giacomin, Joseph and Skrypchuk, Lee. (2021) “2. Affinity Diagram”. Automotive Human Centred Design Methods, Berlin, Boston: De Gruyter, pp. 26–27. https://doi.org/10.1515/9783110677515-003
LISTED IN THE AHFE DIGITAL BOOKSTORE CATALOGUE
Explore the complete digital volume
Interdisciplinary Practice in Industrial Design
Read this individual research paper free through the original publisher, or explore the full digital proceedings book.
ISBN 978-1-958651-24-7
Explore this ISBN in the AHFE Bookstore ↗Listed in the July 2026 bookstore catalogue; search by ISBN to confirm current availability · Digital book purchase optional