Ying Chi Hsu, I Wen Yen, Meng-Cong Zheng (2023). Knowledge Visualization of Earthquake: Impact of Design Format on Readers' Perception and Understanding. In: Usability and User Experience. AHFE Open Access, vol. 110, pp. 465–474. https://doi.org/10.54941/ahfe1003221
To strengthen the seismic intensity and differentiate adaptations to earthquakes in Taiwan, the Central Weather Bureau of the Ministry of Transportation and Communications subdivided the original seismic intensity of 5 Strong and 6 Violent earthquakes of the Seismic Intensity Scale into 5 Lower and 5 Upper, 6 Lower and 6 Upper respectively in 2020.First, we collected 28 infographics from domestic and overseas governmental and private institutions and stock image websites using earthquake intensity as the keyword. Three researchers with design backgrounds classified the infographics into three kinds of types for experimentation: 1) a single-color gradient (semi-circular car dashboard) with an illustration of a cabinet or a house; 2) a 3D geometry (horseshoe type) with illustrations of people and scenes inside and outside the house; 3) a traditional table (horizontal type) with an illustration of a house. The text descriptions of the three infographics were the same. Sixteen respondents (10 of whom had 5-year design background) read through the three infographics sequentially and did a 7-Point Likert Scale Questionnaire. The questions included design form (format, logic, and clarity of information), perception and understanding (distinguishing seismic hazards, perceiving intensity differences, and rapid understanding), risk perception, and personal preference. Finally, semi-structured interviews were to gain a deeper understanding of what factors influence readers' priorities in reading the earthquake intensity infographics.This study found that: 1) a semi-circle speed gauge with one color gradient using light to dark orange had the highest perception and understanding score (mean = 5.19); 2) 3D geometry with horseshoe shape with illustrations and information richness had the highest design form score (mean = 5.13) and highest personal preference ranking; 3) formatting tables with stereotypical image and only one house illustration could not determine the difference had the lowest design form score (mean = 4.65) and lowest perception and understanding score (mean = 4.93) and lowest personal preference ranking. The lowest scores for design form (mean = 4.65), perception and understanding (mean = 4.93), and personal preference were the lowest. In addition, 80% of the respondents were concerned about earthquakes and prepared for them, but more than half would not evacuate quickly during an earthquake. Suggestions for the future are that the earthquake infographics could use color gradients and 3D geometry so that the public can differentiate the danger in different intensity scales.
Taiwan is in the seismic zone between the Eurasian Plate and the Philippine Sea Plate. The Seismic Observation Annual Report of Taiwan Central Wea- ther Bureau (2020) shows that from 2010 to 2020, more than 20,000 to 40,000 earthquakes were observed in Taiwan each year, and more than 700 to 2,000 felt earthquakes. In the past, earthquakes were from 0 to 7 seismic intensity, and seismic intensity 5 and 6 had a wide range. Occasionally, the smaller magnitude with higher intensity values was observed, or the distri- bution of high intensity was not correlated highly with the location of the disaster. The range of high-ground motion may confuse the public in distin- guishing the degree of a disaster and cause a decrease in the effectiveness of disaster response (National Taiwan Science Education Center, 2022). As the advancement of instruments and the construction of a high-density sei- smic network. To strengthen the seismic level distinction in disaster relief
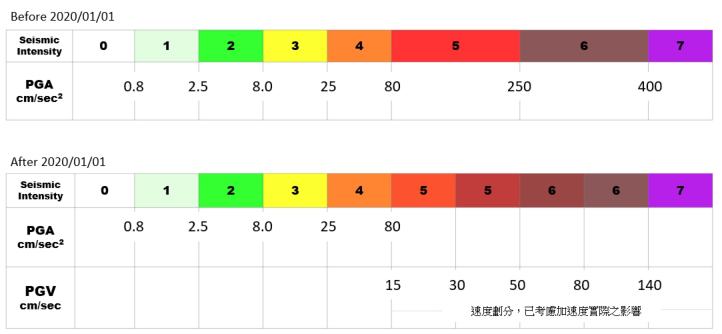
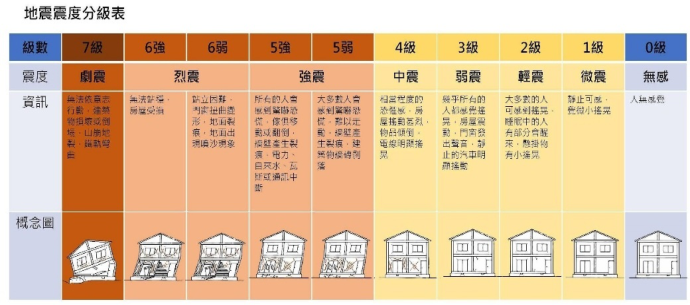
Figure 1: Comparison of the old and new seismic intensity scales (Taiwan Central Weather Bureau, 2019).
and response, as well as avoid public confusion about the familiarity of the original intensity from 0 to 7, and reduce the social cost of amending the regulations, in 2020, the Central Weather Bureau of the Ministry of Tran- sportation and Communications subdivided the original seismic intensity of 5 Strong and 6 Violent earthquakes of the Seismic Intensity Scale into 5 Lower and 5 Upper, 6 Lower and 6 Upper (Taiwan Popular Science of Central Weather Bureau, 2022) (see Figure 1).
The intensity of earthquakes is the different degrees of vibration on the Earth’s surface and includes what people feel and the damage to objects inside and outside the house. In the risk perception of earthquake hazards, the expected effects are people’s fear of earthquakes and building collapse. Communicating earthquake risk to individuals can be difficult because of the scientific and technical information involved. If people had reference data on the different levels of earthquake risk, it would improve risk awareness and disaster prevention (Savadori et al., 2022).
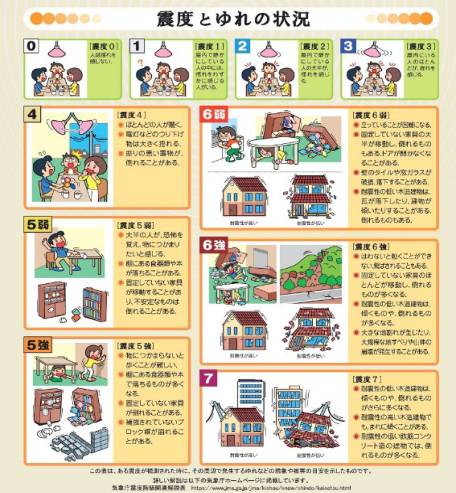
Neußner (2021) suggests that a consistent scheme of warning messages should be used, including color codes (e.g., yellow, orange, red, for increased hazard), text, pictograms, and other features such as audible signals. In 2012, the Japan Meteorological Agency standardized the guidelines for setting the color scheme of weather information on its website to provide consistent information for the public, also taking into account color blindness and the elderly (Japan Meteorological Agency, 2012) (see Figure 2).
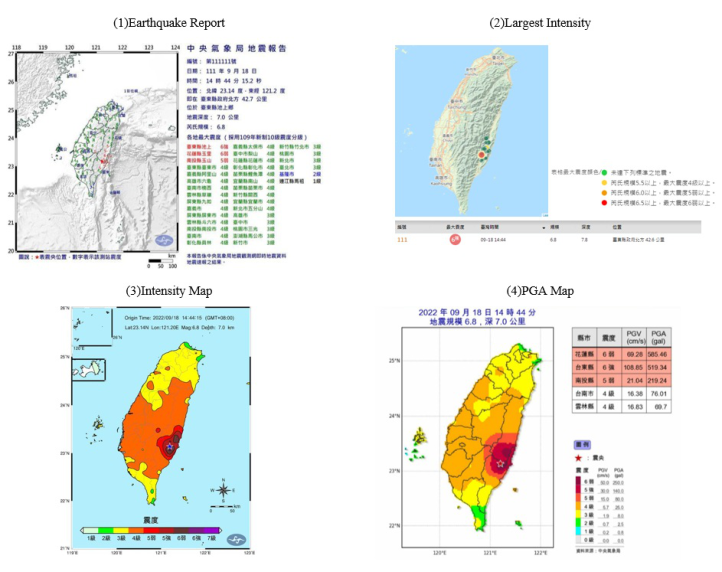
To provide disaster relief, reduce public panic, and understand the degree of the disaster, the Taiwan Central Weather Bureau and National Science and Technology Center for Disaster Reduction have released four types of graph- ical earthquake information on their website, social media, and the Taiwan Central Weather Bureau earthquake forecast App respectively: 1) black, blue, green, and red for Earthquake Report; 2) red, orange, yellow, and green for Largest Intensity; 3) multicolor for Intensity Map; 4) multicolor for PGA Map. Figure 3 shows the four types of Strong 6 of earthquake information
Knowledge Visualization of Earthquake: Impact of Design Format on Readers’ Perception and Understanding 467 (1) Japan Meteorological Agency earthquake information color scheme
(2) Japan Meteorological Agency description of seismic intensity
Figure 2: 1) Japan Meteorological Agency earthquake information color scheme (Japan The Headquarters For Earthquake Research Promotion, 2018); 2) Japan Meteorological Agency description of seismic intensity (Japan Meteorological Agency, 2019).
on September 18, 2022, announced with different designs and colors, which may cause confusion or be difficult for the public to read.
Regarding the relevance of color to perception, Bryant et al. (2014) studied color studies of the weather map and found that the monochromatic tempe- rature scale was more intuitive and easier to understand than the rainbow scale. Yang et al. (2020) suggested that designers should avoid reddish and bluish colors such as dark pink, magenta, brown, aqua, dark blue, and dark cyan when accurate color perception is required. Therefore, this study aims to find: 1) whether color affects the perception and understanding of people of earthquake hazards; 2) which design format of seismic intensity scale help to improve the ability of people to recognize when earthquakes occur.
METHODS
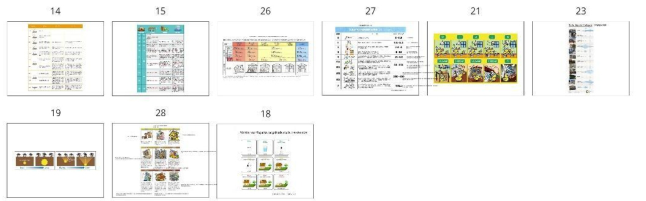
First, we collected 28 infographics with seismic intensity as the keyword from domestic and overseas government agencies, private institutions, and stock image websites (see Figure 4). Three researchers with design backgrounds
Figure 3: The four types of Strong 6 of earthquake information on September 18, 2022: 1) Earthquake report; 2) Largest intensity; 3) Intensity map; 4) PGA map. (Taiwan Cen- tral Weather Bureau, 2022) and (National Science and Technology Center for Disaster Reduction, 2023).
classified the infographics into three types: 1) a single-color or multicolor gradient; 2) a 3D geometry; 3) a vertical or horizontal table. Each researcher selected three from each type, and after discussion, (1) (2) (3) each selected one infographic.
Three selected infographics are: 1) a single-color gradient (semi-circular car dashboard) with an illustration of a cabinet or a house; 2) a 3D geo- metry (horseshoe type) with illustrations of people and scenes inside and outside the house; 3) a table (horizontal type) with an illustration of a house. All three infographics used the new version of the seismic intensity scale, including what people feel and the damage to objects inside and outside the house. In addition, there was a Traditional Chinese translation and the title of the Seismic Intensity Scale(see Figure 5). Sixteen participants, aged 20–59 years, with a bachelor’s degree or higher, 10 of whom had a 5-year design background. They read through the three infographics sequentially and did a 7-Point Likert Scale Questionnaire. The questions included design format (format, logic, and clarity of information), perception and under- standing (distinguishing seismic hazards, perceiving intensity differences, and rapid understanding), risk perception, and personal preference. Finally, semi- structured interviews were to gain a deeper understanding of what factors influence readers’ priorities in reading the seismic intensity infographics.
Knowledge Visualization of Earthquake: Impact of Design Format on Readers’ Perception and Understanding 469
(1) Single-color or multicolor gradient
(2) 3D geometry
(3) Vertical or horizontal table
Figure 4: Three types of infographics collected with seismic intensity as the keyword.
RESULT
Design Format The design format questions included capturing the user’s attention, being credible, providing complete information, well-formatted information, logi- cal structure, clarity of information, and relevance of text and images. The results of the study by the t-test found that the overall score was high- est for a 3D geometry (mean = 5.48), followed by a single-color gradient (mean = 5.15), and lowest for a horizontal table (mean = 4.86), with most of the Mean significantly reaching the middle to the upper level. A 3D geome- try scored highest among all questions, followed by a single-color gradient; a horizontal table only outperformed a single-color gradient in well-formatted information (see Table 1).
Perception and Understanding The perception and understanding questions include identification as being related to the earthquake, being used as a risk warning, distinguishing the
(1) Single-color gradient
(2) 3D geometry
(3) Horizontal table
Figure 5: Three types of infographics for the questionnaire.
hazards of different intensity levels, perceiving the difference between dif- ferent seismic levels, the hue and tone affecting risk perception, and being quickly understood. The results of the study by the t-test found that a single- color gradient (mean = 5.19) was better than a 3D geometry (mean = 5.06) and a horizontal table (mean = 4.93), especially in the questions on ear- thquake identification as being related to the earthquake, distinguishing
Knowledge Visualization of Earthquake: Impact of Design Format on Readers’ Perception and Understanding 471
Table 1. Comparison of the design format of the top three infographics.
Table available in the original PDF paper.
Design Format type M SD t df p
1. This infographic captures the user’s attention.
7. This infographic includes related text and images.
(1) 5.75 1.00 7.989*** 15 .000 (2) 5.94 1.06 (3) 5.31 1.45 Description: (1) single color gradient infographic, (2) 3D geometric infographic, (3) horizontal table with sample size N = 16; using T-test: *p<.05, **<.01, ***p<.001.
the hazards of different intensity levels and the hue and tone affecting risk perception. A 3D geometry had the highest scores in terms of risk warning, perceiving the difference between different seismic levels, and being quickly understood. 75% of the participants gave feedback that the colors were too complex to distinguish, and the lowest scores in terms of color hue and tone affected risk perception. A horizontal table uses four colors to identify color differences, so the color hue and tone have higher risk perception scores than a 3D geometry (see Table 2).
Risk Perception The study found that an average of 80% of the participants were concerned about earthquake news and prepared for disasters. Half of the participants said that they are used to earthquakes occurring in Taiwan, so they would not evacuate immediately in the event of an earthquake. 80% of the participants had experienced a violent earthquake, namely September 21, 1999, the Jiji earthquake (at that time the seismic intensity level across Taiwan was 4 to 7). Regarding the new seismic intensity scale, 62.5% of the participants did not know that the intensity has 5 Lower, 5 Strong, 6 Lower, and 6 Strong, nor did
Table 2. Comparison of the perception and understanding of the top three infographics.
Table available in the original PDF paper.
Perception and Understanding type M SD t df p
1. This infographic is immediately identified as being related to the earthquake
(1) 5.06 1.24 5.594*** 15 .000 (2) 5.13 1.67 (3) 5.06 1.06 Description: (1) single color gradient infographic, (2) 3D geometric infographic, (3) horizontal table with sample size N = 16; using T-test: *p < .05, ** < .01, ***p < .001.
they understand the difference and seismic knowledge. In the semi-structured interview, half of the participants described the intensity level, such as the level of the sensation of dizziness or the degree of shaking of objects. They would like to know the information about the damage, casualties, intensity level, the location of the epicenter, whether they need to rush out of their homes, safe evacuation, and emergency relief.
Personal Preference There were accumulated the points of personal preference, 3 points for the first ranking scored, 2 points for the second, and 1 point for the third. The 3D geometry with horseshoe shape was the best, and the main reasons are the content included the epicenter location, the Stereoscopic impression of the illustration, and the difference significantly in the disaster. However, 62.5% of the participants said that the illustrations contained so much information that they read along with the text, which increased the reading time. 75% of the participants said that the colors were too complicated to distinguish. It was unclear what the colors represented in terms of warning. The second one is a single-color gradient, but it required thinking or reading the text because the illustration had too much detail and similarity. In addition, all three
Knowledge Visualization of Earthquake: Impact of Design Format on Readers’ Perception and Understanding 473
infographics used the same text size, but in the single-color gradient, 60% of the participants said there was too much and small text, which affected reading.
DISCUSSION
According to the 7-point Likert Scale and semi-structured interview, the three designed infographics had the same seismic damage content and different for- mat, resulting in inconsistent text layout widths and sentence breaks, which made the participants’ reading discontinuous. When reading the text, the par- ticipants checked the consistency of the text and illustration, and the position of the text located easy to find. The elements of the illustrations also affect earthquake perception and understanding. 75% of the participants thought it was difficult to distinguish the damage to the house only by the number of cracks in the house. 62.5% of the participants thought that the elements of illustrations were too many or too subtle, and it was more important to read and think about the text together, especially if the illustration below intensity 3 looked like daily life or did not distinguish the difference. In addition, the color hue and tone have a degree of influence on risk perception, a single- color gradient, and four colors are better than using multicolors. More than 70% of the participants said that the colors are too complicated, compared to the color usage of four types of earthquake-related information from the Central Weather Bureau is also unclear.
CONCLUSION
This study found that: 1) the single-color gradient using light to dark orange scored higher in perception and understanding; 2) 3D geometry scored higher in design format and personal preference because they provide 3D illustra- tions and are informative; 3) the table with boring stereotypes and only illustrations of houses, unable to identify the vibrational difference, and sco- red the lowest in design format, perception and understanding, and personal preference.
The interview found that too many colors in the 3D geometry would con- fuse the risk perception, and reference to Neußner (2021) that the warning information should adopt a consistent design scheme. The finding suggests that the design of earthquake information should consider using a single- color or three to four gradations of colors to enhance the public’s ability to quickly distinguish the risk caused by different earthquake intensities with colors. The illustrations attracted the attention of the participants. 3D geo- metry was the most popular, but the illustrations were too complicated, along with the text placement, which influenced participants’ readability and required more time to read. In addition, the illustrations of each level of damage are too similar, the public can feel the urgency by emphasizing the impact of the difference on buildings or landscapes, such as intensity 4 or higher.
REFERENCES
Bryant, B., Holiner, M., Kroot, R., Sherman-Morris, K., Smylie, W., Stryjewski, L., Thomas, M., & Williams, C. (2014). Usage of color scales on radar maps. Journal of Operational Meteorology, Volume 2 No. 14, 169–179. Japan Meteorological Agency. (2012). Guidelines for Setting Color Schemes for Wea-
ther Information on the Website of the Japan Meteorological Agency. The Website: https://www.jma.go.jp/jma/press/1205/24a/120524hpcolor.html Japan Meteorological Agency. (2019). Seismic Intensity Scale. The Website: https://www.jma.go.jp/jma/kishou/know/shindo/index.html Japan The Headquarters For Earthquake Research Promotion. (2018). In the deliverables of the Headquarters for Earthquake Research Promotion-Report on the Study of the Color Scheme Policy. The Website: https://www.jishin.go.jp/main/se isaku/hokoku19d/sg73-s2.pdf National Science and Technology Center for Disaster Reduction. (2023). The
Website: https://www.ncdr.nat.gov.tw/ National Taiwan Science Education Center. (2022). Taiwan New Seismic Intensity Scale. The Website: https://www.ntsec.edu.tw/LiveSupply- Content.aspx?cat=6841&a=0&fld=&key=&isd=1&icop=10&p=1&lsid=16214 Neußner, O. (2021). Early warning alerts for extreme natural hazard events: A review of worldwide practices. International Journal of Disaster Risk Reduction, 60, 102295. Savadori, L., Ronzani, P., Sillari, G., Di Bucci, D., & Dolce, M. (2022). Communica-
ting Seismic Risk Information: The Effect of Risk Comparisons on Risk Perception Sensitivity. Frontiers in Communication, 7. Taiwan Central Weather Bureau. (2019). Ministry of Transportation and Communications Central Weather Bureau (R. O. C) press release: New Seismic Intensity Scale, Strain More Practical. The Website: https://www.cwb.gov.tw/Data/service/ Newsbb/CH/1081218earthquakepress.pdf Taiwan Central Weather Bureau. (2020). Seismic Observation 2020 Annual Report. The Website: https://www.cwb.gov.tw/Data/service/notice/download/Pu blish_20210924102802.pdf Taiwan Central Weather Bureau. (2022). The Website: https://www.cwb.gov.tw/V8/C/ Taiwan Popular Science of Central Weather Bureau. (2022). Earthquake new
indicator-How much do you know about the seismic intensity scale. The Website: https://edu.cwb.gov.tw/PopularScience/index.php/earthquake/460- %E5%9C%B0%E7%89%9B%E7%BF%BB%E8%BA%AB%E6%96%B0%E6 %8C%87%E6%A8%99%E2%80%94%E9%9C%87%E5%BA%A6%E5%88 %86%E7%B4%9A%E7%9F%A5%E5%A4%9A%E5%B0%91 Yang, H., Li, Y.-N., & Zhang, K. (2020). Interactive influences of color attributes on color perception bias. The Visual Computer, 36(5), 925–937.
LISTED IN THE AHFE DIGITAL BOOKSTORE CATALOGUE
Explore the complete digital volume
Usability and User Experience
Read this individual research paper free through the original publisher, or explore the full digital proceedings book.
ISBN 978-1-958651-86-5
Explore this ISBN in the AHFE Bookstore ↗Listed in the July 2026 bookstore catalogue; search by ISBN to confirm current availability · Digital book purchase optional