Michael Schwartz, Irin Nizam, Cortnee Stainrod (2022). Pedestrian Modeling for Mitigation of Disease Transmission in a Simulated University Environment. In: Global Issues: Disease Control and Pandemic Prevention. AHFE Open Access, vol. 24, pp. 46–54. https://doi.org/10.54941/ahfe1001358
Understanding the spread of COVID-19 through mathematical modeling is an effective method of evaluating control interventions and the impact of infectious diseases. It is important to understand how individuals move and gather within indoor spaces as early awareness of specified strategies act as decision-making tools to riskier alternatives. On university campuses, indoor spaces pose unique threats due to high traffic spaces in the building hallways, restrooms and bottleneck points that lead to mass congregation and therefore increased risk of transmission. Evaluation of infectious diseases transmission as a result of pedestrian dynamics (e.g., pedestrian density, crowding, queue and wait times) was used to determine time-varying social distancing during pedestrian interactions/movements. Multiple campus buildings were modeled to demonstrate environments with varying size and complexity. Building models were constructed using the pedestrian features of AnyLogic. The proposed solution makes the following contributions by tracking the control measures of pedestrian dynamics at the microscopic level through temporal and spatial separation. This is done by enforcing social distancing through reducing the number of individual occupants at one time (i.e., segmented student population) and staggering start and end arrival times.The two greatest risk factors in the models were time and space. Entrances and exits to buildings, classrooms, and restrooms, and other queues forced simulated agents to cross the danger threshold as these building features were physical bottlenecks. Model results demonstrated sharp, but brief increases in transmission due to not staggering class arrival and departure times. Results indicated that controlling scheduling or forcing space assignments/social distancing were effective in reducing contacts and risk of spreading disease; however, the greatest reduction in risk of disease transmission occurred when both methods were used in conjunction. When class arrival and departure times are staggered, transmission between people not in the same class is only possible during chance encounters due to restroom visits, late arrivals, or early departures.
Pedestrian Modeling for Mitigation of Disease Transmission 47
INTRODUCTION
COVID-19 has taken a significant toll on the global economy leading to social consequences, strained healthcare systems, school and workplace clo- sures, and disruptions in supply chains and production. Due to the quick worldwide spread of Covid-19, and ineffective implementation of mitigation strategies across many areas, the virus has reshaped many individuals’ daily lives. Updated data consistently reports new cases, and news agencies report what individuals can do to protect themselves and vulnerable populations (e.g., handwashing, personal protective equipment, social distancing). While this serves to inform the public about the status and ways to decrease the spread of COVID-19, there remains a commonly overlooked component – that of the role of building focused mitigation strategies against the spread of the disease.
Deterministic and stochastic epidemiological models including Susceptible- Infected-Recovered (SIR) models are effective tools for understanding epide- mic spread at a macroscopic level. However, the aggregated models do not account for discrete human interactions at the microscopic level in pedestrian crowds; rather, they often provide a simplification of how transmission takes place (Hethcote, 2009). Individual-based, small community models study approaches to control the spread of disease, however there is still a research gap at the level of individual buildings where social distance and isolation is not fully possible (Milne et al., 2008).
Pedestrian-based epidemic models that evaluate person-to-person beha- viors at the microscopic level can be altered using time or location-based variables. However, to focus on particularly crowded areas, such as where queues form (i.e., entry points to buildings, restrooms, service/break areas) mathematical models must be adopted to incorporate approximations related to the transmissibility of the disease, as well. Indoor spaces must be carefully evaluated due to increased changes in physical distancing leading to overcro- wding. Evaluating similar problems at the operational level has shown to support improved travel patterns and wait times and better evaluation of transmission risk (Qu et al., 2014).
The objective of this paper is to investigate how pedestrians move and gather within indoor spaces relevant to mass congregation, crowding, and bottleneck traffic areas to understand the increased risk of COVID-19 tran- smission within the indoor space. Modeling and simulation techniques are applied to illustrate and assess pedestrian dynamics in various indoor spaces on the University of Central Florida (UCF) main campus in Orlando, Florida. Use of these applied techniques will allow for the experimental assessment and analysis of Covid-19 transmission in the modelled spaces, without imple- menting potential multiple and costly changes in the real world. Simulated, data-driven solutions will then be suggested to improve the safety of UCF’s built spaces in the context of disease transmission. Evaluation of the pede- strian dynamics (e.g., pedestrian density, crowding, queue and wait times) are used to determine optimal solutions for pedestrian interactions/movements in these buildings. The proposed solutions are based on the results of pedestrian dynamics at the microscopic level through temporal and spatial separation.
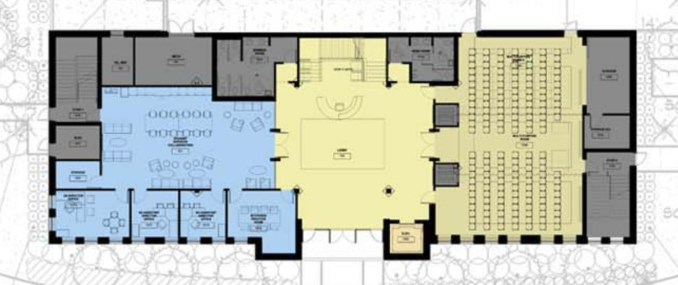
Figure 1: Wayne densch center for student athlete leadership floorplan.
This is done by enforcing social distancing through reducing the number of individual occupants at one time (i.e., segmented student population) and staggering class start and end times.
METHOD
Models Multiple environmental models of varying size and complexity were constru- cted: UCF Downtown Library, Research I building, Wayne Densch Student Center, Classroom 1 building, and UCF Global. Due to space limitati- ons, one floor plan model is shown (Figure 1). Service/queue functionalities were added to each model. All environments have similar structure, compo- nents, and behaviors; thus, one structural (object) diagram is noted below to describe the most complex model. A behavioral (use case) diagram for the activities in the built environment is included to describe agent behaviors within the model.
Due to the world-wide coronavirus pandemic our objective is to study pedestrian behavior in indoor environments and how movement in and through spaces may contribute to transmission of infectious diseases. Disease transmission is more likely in closed environments and indoor spaces (Vuorinen et al., 2020).
Building models were constructed using the pedestrian features of AnyLo- gic (ex: walls, nodes, queues). Hallways, classrooms, queue and service areas were added to the model. The critical component of our models was not just to recreate the blueprint foundation, but to create the pedestrian agents and model pedestrian flow through the environment, which was accomplished via detailed pedestrian flowcharts. Pedestrians were created with characteristics, such as speed and width, and released into the system using defined rates and schedules. Heatmaps were added to provide a dynamic visual of the crowding and density as the model progressed. AnyLogic Personal Learning Edition times out at 1 hour of simulation; however, we met that challenge by sca- ling our model time units accordingly. Pedestrian arrivals, service delay time, service recovery time, number of queues, and number of services were just a
Pedestrian Modeling for Mitigation of Disease Transmission 49
few variables that were resolved at initial model creation. Further details are discussed in the relevant sections below.
Once we developed the models, we reduced pedestrian density, crowding and contacts, queue and wait times, and thus overall disease spread. With- out completely shutting down the university, the goal is to find an acceptable middle ground to continue conducting operations. We want to answer the question of how can we reduce disease transmission in built spaces without shutting down the campus entirely. We hypothesized that staggering class intervals, segmenting the student population and enforcing social distancing by forcing space assignment would influence the incidences of Covid-19 tran- smission. Less people would be crossing paths and interacting than normal; thus, disease transmission would be reduced.
To address our research question and test our hypothesis, we analyzed base models in which there were no staggered schedules and no distancing or other rules enforced, variations of staggered schedule models, and variations of forced space assignment models and compared their output data: mean length of queues, mean and distribution of time in queues, and contact/risk assessment.
In summary, we considered these scenarios to see if either a main effect or an interaction effect would reduce the possibility of disease transmission:
1. Staggered arrival rate schedules and class schedules in the simulated populations. This would be akin to in real life if buildings or classes were accessible only to either persons with last names A-M or N-Z every other hour or Freshmen and Sophomores versus Juniors and Seniors. 2. We varied the social distancing feature available in AnyLogic version 8.7 to enforce social distancing in some models. We primarily control- led social distancing by assigning classroom and study space to specific pedestrians, essentially limiting room capacities.
Overall, the model behavior is as follows for the medium/larger classroom spaces on the simulated campus (Classroom 1 and Global buildings): Pedestrians enter the building according to an arrival schedule, and travel to either the restroom queue, the reception desk queue, or neither (accor- ding to a probability variable), and then travel to a study room to wait until their next class starts. When the class time is scheduled to start, pedestrians start walking to their corresponding classroom, and wait in this room for the duration of the class, then leave the classroom. Pedestrians will enter study rooms in between their classes. Pedestrians also have a probability to leave the building and come back during a lunch break. Key model parameters are highlighted below in the parameters section.
Specific to models with varying conditions:
1. The schedule block from the agent palette was used to create diffe- rent staggered schedules and rates of population arrival to the system and into classrooms, which are then tied to the corresponding source blocks. 2. The ped settings block from the pedestrian library palette includes a social distance, or boundary, feature. We selected the checkbox to enable
social distancing and input six feet as the distance required. We also experimented with forcing pedestrians to specific wings or sections of buildings to attend class and study in between classes.
Crowd Dynamics The data are synthetic in the models, and we set up pedestrian arrivals with educated estimates as close to real life as possible to model the real world as scaled to model time units.
Variables We changed arrival to the built environments by rate and staggered schedules. Model performance was measured as a function of disease spread via contact/risk assessment and queue performance.
Simulation Parameters Classroom capacities are fixed based on social distancing space assumptions. Several parameters were created as part of the initial model creation to con- trol pedestrian dynamics, such as average time in bathroom and reception queues or the likelihood that agents will enter these queues. The schedule blocks were used to control pedestrian arrival rate and class schedules; it was critical in our schedule-based analyses to be able to see which settings had what effect.
There are many parameters in the models, but key parameters in the two medium/larger classroom models (Classroom 1 and Global) are as follows:
1. The main model element that makes the biggest impact is the CloseCon- tactDistanceFeet parameter, which defines the social distance radius that counts an agent coming within that radius of another agent. 2. AvgMBathTimeSec, AvgWBathTimeSec, and AvgRecepTimeSec are the averages of how long each respective service time takes, based on a normal distribution, with parameter sigma (the VariabilitySigma para- meters).
The schedule block feature was critical to our experiments as well. We used a series of schedules (meetingRoomXSched) so that all the classrooms have an assigned class schedule. To adjust a class schedule for a particular classroom, meetingRoomXSched was selected, and rows in the Time column were adjusted to be the model time that students start walking to their class- room. To adjust pedestrian arrival schedules, the arrSchedW, arrSchedE, and arrSchedS were selected. In the Time column of the properties windows of these blocks, the desired arrival time of a group of pedestrians was set, and the corresponding Values column was set to the number of pedestrians to arrive at that time. This was done for all three arrival schedules. The three arrival schedules listed are for the three entrance lines in the Classroom 1 model. The combined total of all value columns of all three arrival schedules is the total number of pedestrians inside the building at one time.
Pedestrian Modeling for Mitigation of Disease Transmission 51
Procedure To assess the risk of disease transmission, we counted pedestrians that come into close contact. We ran the larger classroom building models and reported data from one run of each below. Distributions are shown for queue times.
RESULTS
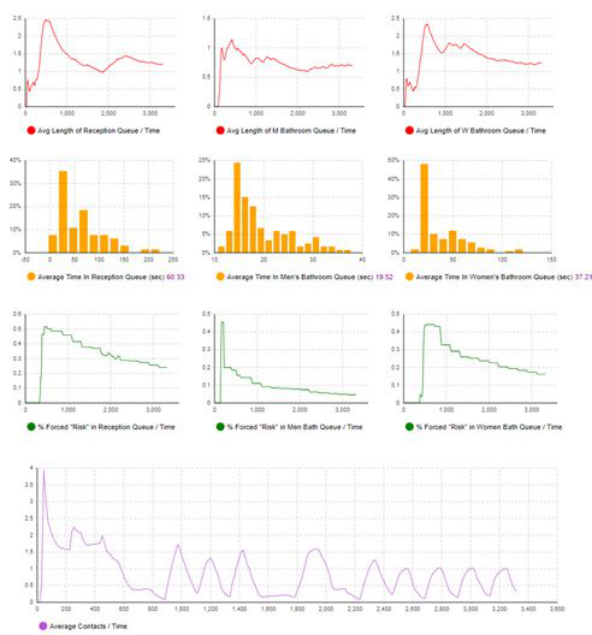
Scenario 1: Base Model - No Staggering of Schedules, No Social Distancing or Forced Spaces Due to publication requirements on page count, only the graphs for the Sce- nario 3 Global model are included. For the Global model, the queue lines had spikes in the average queue length every time that there was a period in betw- een classes when all students in the building had the availability to go to these queues. The queues averaged about one to two people in the queue, with the reception queue reaching over two people averaged in the queue in the last half of the model duration. The reception queue spiked up to 60% of people forced within risk distance in the last half of the model duration, and both bathroom queues spiked up about halfway through the model duration, with the men’s restroom queue reaching 15% of agents crossing the risk distance threshold and the women’s reaching 30%. There were very sharp and brief spikes during the arrival and departure of the class times. Recall, in this sce- nario, the pedestrians are flowing all across the building to get to their classes instead of staying in a particular zone, and all pedestrians in the buildings are moving at once. This caused the spikes to be larger and longer, as pedestrians crossed paths much more often.
For the Classroom 1 model, the queue lines had spikes in the average queue length every time there was a period in between classes when all stu- dents in the building had the availability to go to these queues. The reception queue averaged 1.5 queue lengths, the men’s bathroom averaged 0.8 queue length, and the women’s bathroom averaged 1.2 queue length. The rece- ption queue spiked up to 50% of pedestrians forced within risk distance in the last half of the model duration and in the beginning, the men’s bath- room spiked about a quarter of the way into the model run to 30%, and the women’s restroom averaged about 40% of pedestrians forced within risk distance.
Scenario 2: Staggered Arrivals and Classes For the Global model, various staggered schedules of arrivals and classes were tested. The two Cohorts rarely came in contact with each other because while one Cohort was transitioning from one class to another, the other Cohort was already in the duration of their class (25% to 50% of the way finished with their class). The only contact between the two Cohorts was from the straggler pedestrians that go to the restroom or the reception desk, or during the lunch break arrival/departures. During normal interarrival class time the (Average Contacts / Time) chart fluctuated from an average of 1 to 1.5 contacts. There is one spike at most arrival class times from where the first cohort and the second cohort traveled to their classrooms. All three queue lines (reception,
Figure 2: Results of the Scenario 3 global model.
men’s bathroom, women’s bathroom) stayed at a relatively low average queue length. The reception queue got up to about 40% of people forced into risk distance due to overcrowding in the queue, and the bathroom queues were at about 15%–20% (Figure 2).
For the Classroom 1 model, the two Cohorts rarely came in contact with each other because while one Cohort was transitioning from one class to another, the other Cohort was already in the duration of their class (25% to 50% of the way finished with their class). The only main contact between the two Cohorts was from the straggler pedestrians that go to the restroom or the reception desk, or during the lunch break arrival/departures. During normal interarrival class time, the (Average Contacts / Time) chart fluctuated from an average of 1 to 1.5 contacts. There is one spike at most arrival class times from where the first cohort and the second cohort traveled to their classrooms, as well as the departure times of the classrooms. All three queue lines (reception, men’s bathroom, women’s bathroom) stayed at a relatively low average queue length (1-2 people). The reception queue got up to about 20% of people forced into risk distance due to overcrowding in the queue. The men’s bathroom queue was at about 40%, and the women’s bathroom queue was at about 25% with frequent spikes.
Pedestrian Modeling for Mitigation of Disease Transmission 53
Scenario 3: Social Distancing/Forced Space Assignments For the Global model, multiple forced space assignments/social distancing were tested. The two Cohorts rarely came in contact with each other. The only contact between the two Cohorts was from the straggler pedestrians that go to the restroom or the reception desk, or during the lunch break arriva- l/departures. During normal interarrival class time (900–1400 seconds, and 2300–3200 seconds model-time), the (Average Contacts / Time) chart fluctu- ated from an average of 1 to 1.5 contacts. There is one spike at most arrival class times from where the first cohort and the second cohort traveled to their classrooms. All three queue lines (reception, men’s bathroom, women’s bathroom) stayed at a relatively low average queue length (1-2 people). The reception queue got up to about 40% of people forced into risk distance due to overcrowding in the queue, the men’s bathroom queue was 20%, and the women’s restroom was 25%. Results were similar to the Model 2 scenarios.
For the Classroom 1 model, the two Cohorts rarely came in contact with each other. The only contact between the two Cohorts was from the straggler pedestrians that go to the restroom or the reception desk, or during the lunch break arrival/departures. During normal interarrival class time, the (Average Contacts / Time) chart fluctuated from an average of 1 to 1.4 contacts. There is one spike at most arrival class times from where the first cohort and the second cohort traveled to their classrooms. All three queue lines (reception, men’s bathroom, women’s bathroom) stayed at a relatively low average queue length (1–1.5 people). The reception queue got up to about 20% of people forced into risk distance due to overcrowding in the queue, the men’s bath- room queue was 30%, and the women’s restroom was 40%. Results were similar to the Model 2 scenarios.
CONCLUSION
This study was centralized around the concept of changes in human beha- viors: controlling scheduling and forcing space assignments/social distancing on a simulated university campus. Study results suggest these methods combi- ned were effective in reducing contact and risk of spreading disease. Options tested and presented in our findings did not include other methods that may be effective for reducing disease transmission, including decreasing buil- ding capacity, switching to virtual classes, and modifying interior building structures.
Based on the study results the following recommendations are made about methods to decrease the transmission of an airborne virus in built spaces. The implementation of multiple cohort arrival schedules alongside separa- ted classrooms and/or study rooms, may lead to less transmission between inter-arrival times reducing the overlapping of cohort cross contact between pedestrians. In addition, the implementation of policies to further encou- rage pedestrians to limit multiple designated classroom interactions and stay within their cohort may reduce cross-building travel.
Results indicated increased density and congestion at entryways, exits and some walkways. Therefore, the reconstruction of building spaces through widening doorways or corridors in an effort to create lanes may be an
effective method to ensure alternative paths for pedestrian flow, reducing the probability for pedestrian bottlenecks within hallways, stairwells or high traffic areas on campus. The changes suggested must also consider the cost factor, and downtime of courses associated with the structural change. The- refore, it could momentarily increase congestion at other doors during time of reconstruction.
This study modeled pedestrian movement but did not incorporate the application of PPE, masks, or other prevention measures. Models were illu- strated to demonstrate the impact before the widespread deployment of vaccines. Additional research is needed to investigate the current changes and impacts as vaccine options have become incorporated into the population, altering the susceptibility to contract and/or spread the disease.
Future research is encouraged to leverage data and insights from epide- miologists, infectious disease experts, and public health officials to better understand the spread of disease, effective transmission reduction methodo- logies and incorporate additional variables and parameters into the model. Face mask effectiveness, recommended social distancing, vaccination status, minimizing crowding and contact, mixed virtual and in-person course opti- ons, and screening/testing upon entry are just some of the dynamic factors that can be realized as part of the entire problem, model, and solution.
ACKNOWLEDGMENT
The authors would like to acknowledge Tyler McFadden for his assistance with programming the SIR models and his feedback on an early manuscript of this paper.
REFERENCES
Hethcote, H.W. (2009). The basic epidemiology models: models, expressions for R0, parameter estimation, and applications. In: Mathematical understanding of infectious disease dynamics, pp. 1–61. Milne, G.J., Kelso, J.K., Kelly, H.A., Huband, S.T., McVernon, J. (2008). A small
community model for the transmission of infectious diseases: comparison of school closure as an intervention in individual-based models of an influenza pandemic. PLOS ONE, 3(12). Qu, Y., Gao, Z., Xiao, Y., & Li, X. (2014). Modeling the pedestrian’s movement and simulating evacuation dynamics on stairs. Safety Science, 70, 189–201. Vuorinen, V., Aarnio, M., Alava, M., Alopaeus, V., Atanasova, N., Auvinen, M., ... &
Österberg, M. (2020). Modelling aerosol transport and virus exposure with nume- rical simulations in relation to SARS-CoV-2 transmission by inhalation indoors. Safety Science, 130, 104866.
LISTED IN THE AHFE DIGITAL BOOKSTORE CATALOGUE
Explore the complete digital volume
Global Issues: Disease Control and Pandemic Prevention
Read this individual research paper free through the original publisher, or explore the full digital proceedings book.
ISBN 978-1-958651-00-1
Explore this ISBN in the AHFE Bookstore ↗Listed in the July 2026 bookstore catalogue; search by ISBN to confirm current availability · Digital book purchase optional