Kevin Clark, Richard Carson, Jordan Louviere (2022). COVID Choices: Research and Online System for Main Street Decision Making. In: Global Issues: Disease Control and Pandemic Prevention. AHFE Open Access, vol. 24, pp. 73–80. https://doi.org/10.54941/ahfe1001361
During the spring of 2020 ChoiceFlows Inc. (Choiceflows) researchers document an approach for small and medium-sized businesses to make informed decisions about equitable and resilient reopening after COVID-19 pandemic shutdowns and restrictions. The client is 501(c)(3) chartered Restart Partners in Washington State and their client, the State of Washington Department of Commerce. After several revisions, an agreement is signed on December 30, 2020 to make the approach real with development and deployment in 2021 using Cares Act Grant money from the U.S. Federal Government. The result is Smart WA – and can be freely accessed online here: https://smartwa.us Smart WA is the result of unique primary research conducted by Choiceflows involving citizens and residents of Washington State, and many days of secondary research finding publicly available data sources and bringing them together in one place to provide both comprehensive and easier to use data to make informed decisions. The research behind Smart WA is the first study to comprehensively examine how specific COVID-19 transmission reduction actions influence planned visits to different types of businesses. Data on Smart WA is organized by Human Health, Economic Health, and Community Experience metrics – and displayed as composite scores. The entire online system is powered by Tanjo.ai machine learning, a Choiceflows business partner, and is updated from all data sources daily.The advent of the COVID pandemic disrupts a wide range of businesses that directly serve the public and causes a dramatic fall in visits to these establishments. Businesses face a wide range of options in how to respond ranging from the pre-pandemic status quo and doing nothing to prevent the spread of the virus to shutting down businesses due to a lack of customers.Recognizing this, Smart WA has a “what-if” game-like section that allows a business to model the choices that they can make for reopening, and what they can expect from customers based on real data from people in the state. The relevant question from a small business perspective is: If we take an action or actions that influence COVID-19 transmission and make it known to our customers, how will that influence those customers to visit? The research supporting this function was conducted in four waves of surveys designed and administered during 2021, making it one of the most comprehensive research programs of its type during COVID with snapshots of customer preferences being collected over several month intervals.We document the development of this COVID Choices research using the Choiceflows pioneered Volumetric Choice Experiment (VCE) method and design and in parallel the online system. This provides a platform for projecting how the insights and methods from this work can be used for other issues facing small and medium size businesses to aid in and speed decision making and choice. This includes and dashboards for policymakers and main street for allocating resources for commerce, including economic development, ongoing community health, and supporting quality of life indicators.
Since first emerging in 2020, the global COVID-19 pandemic has caused disruptions to a wide range of businesses. Main street business such as restau- rants, cafes, hair salons, and retail establishments have been particularly disrupted. Depending on the local regulatory environment, owners and ope- rators of small and medium sized businesses (SMB) across the US, sometimes faced a bewildering and not clearly defined range of options in responding to COVID-19. The range of responses went from shutting down entirely, to implementing cleaning, masking, vaccine and other protocols, to no special action and sticking with standard operating procedures. Time, attention, and resource constraints associated with operating smaller businesses along with lack of clarity on what would best protect these businesses and their custo- mers has at times resulted in dramatic reductions in visits to these main street businesses.
During the spring of 2020 ChoiceFlows Inc. (Choiceflows) research- ers documented an approach for small and medium-sized businesses to make informed decisions about how to reopen after COVID-19 pandemic shutdowns and restrictions.
The client for Choiceflows research and the resulting online system for small and medium-size businesses (SMB) is 501(c)(3) chartered Restart
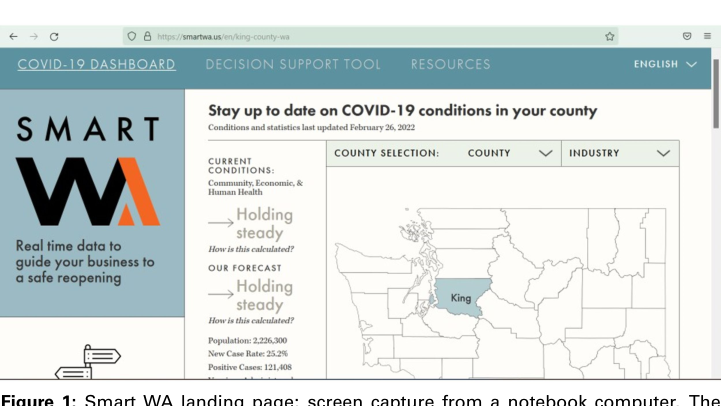
Figure 1: Smart WA landing page; screen capture from a notebook computer. The Smart WA web page address defaults to showing King County, WA, the most populous of the selectable counties on this small business online pandemic support system, which includes Seattle. The top-right pull-down menu allows users to see Smart WA in six different languages.
Partners in Washington State; their client for this initiative was the State of Washington Department of Commerce. After several revisions, an agreement was signed on December 30, 2020 with development and deployment in 2021 taking place using Cares Act Grant money from the U.S. Federal Government.
SMART WA The result is “Smart WA” – a freely accessible dashboard, decision-making tool, and resource hub providing real-time data to guide Washington State businesses to a safe and sustainable reopening.
Smart WA can be freely accessed online here: https://smartwa.us Smart WA is the result of unique primary research conducted by Choiceflows involving citizens and residents of Washington State, extensive secondary research aimed at locating and vetting publicly available data sou- rces and bringing them together in one place to provide both comprehensive and easier to use data to make informed decisions.
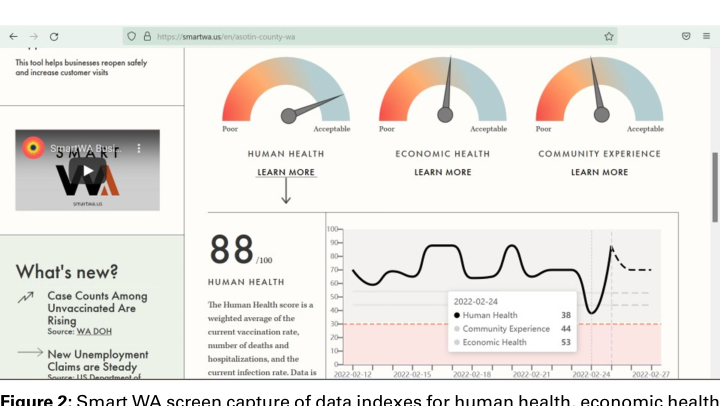
Data on Smart WA is organized by Human Health, Economic Health, and Community Experience metrics – and displayed as composite scores. The entire online system is powered by Tanjo.ai machine learning, a Choiceflows business ecosystem partner, and is updated from all data sources daily.
The research behind Smart WA is the first to comprehensively examine how specific measures designed to reduce COVID-19 transmission influence the number of visits Washington residents planned to different types of busi- nesses. The research looks at 12 different types of businesses across three broad categories: personal services (hair, nails, massage, fitness), restaurants (take out, counter service, table service) and bars, and retail (big natio- nal, specialized national, local, gifts/crafts). For this research Choiceflows uses a methodology pioneered by its founders: the Volumetric Choice
COVID Choices: Research and Online System for Main Street Decision Making 75
Figure 2: Smart WA screen capture of data indexes for human health, economic health and community experience measures. The over 100 data sources that make up the index are available for user inspection via hyperlink.
Experiment (VCE) (Carson, Eagle, Islam and Louviere, “Volumetric Choice Experiments,” Journal of Choice Modeling, 2022).
Businesses also face a wide range of pandemic responses ranging from the pre-pandemic status quo and doing nothing to prevent the spread of the virus to shutting down businesses due to a lack of customers.
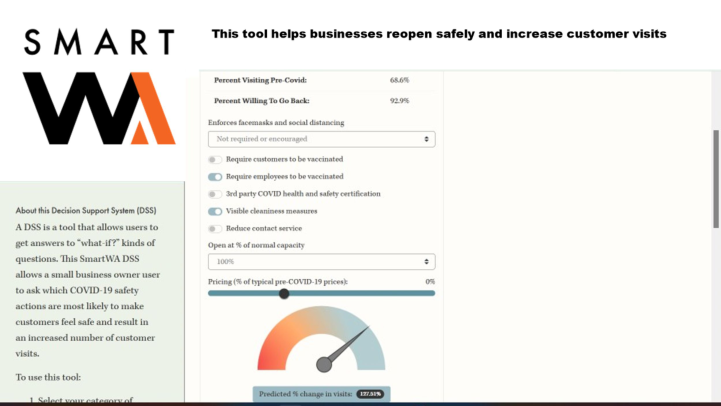
Recognizing this, Smart WA has a “what-if” game-like section that allows a business to explore the choices that they can make for reopening and pre- dict what they can expect from customers as a result of these choices based on real data from people in the state. The relevant question from a small business perspective is: If we take an action or actions that influence COVID-19 tran- smission and make it known to our customers, how will that influence those customers to visit? The VCE research supporting this function was conducted in four waves of surveys designed and administered during 2021, making it one of the most comprehensive research programs of its type during COVID with snapshots of customer preferences being collected over several month intervals.
RESEARCH FINDINGS The key findings from the Volumetric Choice Experiment (VCE) surveys of people in the State of Washington in four waves during 2021 are:
Enforcing facemask and social distancing substantially increased planned visits vs. doing nothing.
Having all employees at a business vaccinated substantively increased planned trips in almost all categories.
Obtaining third party health/safety certification (which includes actions like employee safety training and improved ventilation) and implementing measures of visible cleanliness increases planned visits, although there are substantive differences across business categories.
Figure 3: Smart WA decision support system (DSS) with volumetric choice experiment (VCE) data supporting gamified modeling for reopening several types of businesses on Main Street in the State of Washington. In this case by selecting “Require emplo- yees to be vaccinated” and “Visible cleanliness measures” in this “what if” modeling component of the Smart WA online system increases likelihood of customer visits by 127 percent.
There was little relationship between the percent of capacity at which the business category was operating and planned visits across the four waves.
In wave four of the survey, we added a question that strongly correlates with media preferences and willingness to be vaccinated.
The Volumetric Choice Experiment (VCE) designed by Jordan Louviere was durable for all four (4) waves of the experiment; and data from Waves 1, 2, 3, and 4 are reasonably consistent with each other. Experiment field arch- itecture and assessment by Richard Carson indicates that this consistency is even more pronounced if differences are allowed along predictable (and easily modeled) lines, such as pre-Covid visit patterns. This consistency moves tow- ard the preferences of the vaccinated as their fraction increases, particularly regarding a business having their employees vaccinated.
There was widespread agreement between the exemplars/categories repre- senting one of the three groupings on the sign and rough magnitude of the effects of some attributes. But there were some key differences across the three groups with some interesting and often intuitive divergences in specific categories.
Enforcing facemasks and social distancing substantially increased expected visits relative to doing nothing with few exceptions. The weakest effects were for the fitness services categories which, perhaps not surprisingly, put much less weight on this attribute.
What was somewhat surprising was that introducing two additional levels to the facemask policy (“facemasks not required with proof of vaccination” and “voluntary requirement for those not vaccinated”) did not dominate the original binary yes required/not required. A bit of additional analysis on these
COVID Choices: Research and Online System for Main Street Decision Making 77
data suggested why: For those who are or soon are to be vaccinated, the most preferred level on the Facemask attribute was to require unless proof of vaccination, followed by required of all. The more strongly vaccine hesitant preferred no mask requirement; and to some degree were split between volun- tary for the unvaccinated and requiring of all. Their least preferred option was to require without proof of vaccination. It is easy to see the pattern that the “require of all” level of the Facemask attribute was the most strai- ghtforward compromise. When all four Waves are combined, the “require facemasks” attribute level has by far the largest effect size of all the attribute levels. While we thought it was possible that the rising fraction of vaccinated would push the preferences toward the alternative attribute level: “facemasks required unless proof of vaccination.” This did not happen in Wave 3, but the Wave 4 data suggest somewhat more support for this option as procedures verifying vaccination are becoming widely available and trusted. However, requiring facemasks of all is still uniformly the most preferred option across all 12 categories of businesses examined.
For almost all of the 12 business categories, there was little relationship between the percent of capacity at which the category operated and plan- ned visits across the four waves. This was a bit of a change from using the data from only the first wave, where there was a weak preference for operating at 75% capacity; and in some instances at even lower capacity. Overall, there was a modest increase in planned visits for fitness services, table service restaurants, bars, and specialty national retailers operating at reduced capacity. This result appeared to be driven by a moderately sized group of respondents who preferred to avoid crowds at a business. Because of this finding and the fact that almost all businesses are now operating at 100% of capacity, we stopped refining the estimates of capacity preferences in favor of looking at a new attribute—requiring customers to be vaccinated.
Having all employees at a business vaccinated substantively increases plan- ned trips in almost all categories. The addition of the Waves 2, 3, and 4 data increased the magnitude of the relevant effect sizes for two reasons: 1) most of this effect was driven by those who have been or soon will be vaccinated and this fraction increased between the waves; 2) among those who are or soon will be vaccinated the preference for making more visits when emplo- yees are vaccinated increased. Again, this is largely among those who have or soon will be vaccinated. Data from Wave 3, which was collected during a time of increasing employer mandates for their workers to be vaccinated, most strongly supports the notion that having employees vaccinated increa- ses planned visits. Wave 1 and 2 results may have reflected concerns about some workers not having the opportunity to be vaccinated. Wave 3 results reflect the fact that vaccination now is easy to obtain and that a growing fra- ction of businesses are requiring it of employees. Wave 4 data suggests that while those vaccinated plan more trips when employees are vaccinated (and this fraction of the Washington State adult population is growing over time), there is now active opposition (particularly in some retail categories) by the unvaccinated to a requirement that employees be vaccinated.
In Wave 4, we added a new attribute (“requiring customers to be vaccina- ted”). Our respondents, like the country as a whole, appeared to be quite
polarized on this requirement. Those currently or soon to be vaccinated preferred requiring customers to be vaccinated. Those not vaccinated had negative preferences for requiring customers to be vaccinated, as one would expect. For some categories (e.g., Big National and Local in the retail grou- ping, Hair, Nails, and Gyms in personal services) requiring customers to be vaccinated predicted a clear increase in planned visits. For the restaurant and bar category, the unvaccinated had particularly large negative preferences for requiring customers to be vaccinated, suggesting large drops in planned visits if this requirement is present. The vaccinated have positive preferences for this requirement, but they are often not nearly as large in magnitude, so the net effects are a small positive increase in planned trips; and for Table Service restaurants, there is a small decrease. This points to a difficult situ- ation for businesses where implementing this requirement encourages more trips by the vaccinated but via exclusion, decreases such visits by the unvacci- nated. The higher the fraction of a business’s customers who are vaccinated, the more likely this requirement will be to increase visitation rates, while the converse is true of a business whose customers are largely unvaccinated.
In Waves 3 and 4, we also performed a separate analysis looking at public preferences toward requiring vaccination of all at 21 different types of locations. This analysis is discussed below.
In the first wave, this vaccination status was originally entered in the model as an interaction with the attribute involving having all employees vaccinated. In the report on the first wave, presciently foreseen was that as the fraction vaccinated increased, the overall fraction of the public supporting having employees vaccinated would substantially increase. We use this convention in combining the three waves. The main effects coefficients (which are for the unvaccinated) were all statistically insignificant at conventional levels and tended to be negative but quite small in magnitude. In contrast, for most business categories, the interaction effects with being or soon to be vaccinated were, for the most part, positive, large in magnitude and highly significant. In the decision support system (see below), the fraction vaccinated or indicating they will soon be vaccinated is set to 81%, the weighted sample average for Wave 4. Experience with the three waves suggested this effect is likely to continue increasing as vaccination rates increase.
Preferences for third party health/safety certification (which includes issues like employee safety training and ventilation) and measures of visible clean- liness increased in significance over time. Part of this was due to the larger overall sample size, and part seemed due to modest increases in the magnitude of the preference parameters across waves. For third party certification, this may be the result of increased public awareness due to advertisers of such cer- tifications. Third party health and safety certification was least important for the personal services categories, where implementing visible cleanliness mea- sures generally was more important. Third party certification was statistically significant only for the hair and nail categories. In all of the Restaurant and Bar and retail categories, respondents put substantial weight on both third- party certification and visible cleanliness measures, although the effect for bars was notably weaker for third party certification and for gyms weaker on visible cleanliness measures.
COVID Choices: Research and Online System for Main Street Decision Making 79
Providing a reduced contact service generally did little to increase plan- ned visits. Three categories had modest positive effects, where interesting variants of reduced contact services have developed. One of these was the Bars category. At some bars it is possible for pre-formed groups to go to the bar, suitably social distanced and order off their cell phones. The other cate- gory was hair salons, where the reduced contact aspect appears to be due to eliminating the need to wait in the salon for the stylist.
The last attribute, price change from pre-COVID levels, had a (statistically significant) negative effect on planned visits predicted by economic theory. The survey goes to some length to justify why both positive price incre- ase (e.g., supply chain issues) and negative price changes (e.g., to attract customers back) might occur. Having the price attribute in the model allows a business owner to compare the predicted percentage change in planned visits from implementing or removing one or more of the COVID tran- smission reduction measures to that predicted to occur in response to a well-understood common metric such as a 10 percent decrease in price levels. Here the main finding is that several actions like requiring facemasks of all or requiring employees to be vaccinated leads to a larger increase in planned visits that a 10 percent drop in price levels.
USABILITY AND HUMAN FACTORS Attention to usability and human factors had a strong focus in the develo- pment of Smart WA.
Washington State is diverse, encompassing wide-ranging demographics and micro-regions from the coast to the mountains, and from the Canadian border to shared borders with Idaho and Oregon. Research was performed to understand what the key languages are for small businesses in the State of Washington, and as a result, Smart WA is available with a dropdown menu in English (default), Spanish, French, Korean, Tagalog, Vietnamese, and sim- plified Chinese. The entire site is machine readable for the visually impaired. An overall design review and audit for Americans with Disabilities Act (ADA) usability was performed by Content Evolution federation member company UserWorks, which Choiceflows is also a peer member company.
Resources for small and medium-sized businesses are also available on Smart WA with links to websites for information and action.
DISCUSSION
The Smart WA research and online system demonstrates main street busines- ses can benefit from executive decision style dashboards that due to cost or tactical constraints have long been substantially limited to large enterprise business C-Suites, government, and for-profit platforms. The Smart WA tool breaks the barrier to entry.
The COVID use case points to potential opportunities for additional “main street” dashboards that can be developed, potentially providing groundbre- aking decision support systems (DSS) for small business owners and policy makers. While developed for the COVID pandemic, the Smart WA system is
intentionally designed to pivot to being an economic development and com- munity resilience tool as COVID subsides – and available as a ready-to-use template for future pandemics Choiceflows as a research and policy insights company sees the ability to apply Smart WA learning for research and systems to:
Climate Choices (adaptiveness & resilience)
Economic Choices (economic development dashboard)
Health Choices (data driven decisions support systems for communities)
Pandemic Choices (preparedness)
Vaccine Choices (attitudes and communications) Choiceflows uses different types of choice experiments with a wide variety of tested attributes that allow building and deploying “what-if” simulators (decision support systems, or DSSs) to make informed decisions. A DSS can include lowering energy and resource consumption and the associated resulting lower costs of doing business; or, in the case of attractiveness for customers, which choices that businesses can make, and how this will incre- ase customer choices and loyalty, and potentially support price increases with proper positioning and communication.
Smart WA and the examples listed above are examples of what Choiceflows calls Embodied Research.
Embodied Research is defined by Choiceflows as choice modeling research in which the company has expertise and placing the results of this research into interactive and useable forms for informing and advancing decisions on a distributed basis by large numbers of people – and key resource decision makers.
Embodied Research brings the dashboard and Executive Information Systems (EIS) capabilities that have been available to senior managers and owners in large enterprise organizations to Main Street decision makers. It has the capability to bring choice research to bear on the toughest R&D decisions facing top leadership around the world.
Choiceflows works to serve two underserved extremes of the market: Senior leaders deciding what’s next and SMB decision makers making bet- ter choices in the moment. Choiceflows is working to give both the C-Suite and Main Street the advantages of Embodied Research and gamification of data, allowing people to run “what if” scenarios and have the ability to play with the results of choice research.
SUMMARY The Smart WA dashboard successfully aggregates unique longitudinal volu- metric choice experiment (VCE) research and typically disparate pandemic information and solution sources into a legible and accessible format for Main Street. Smart WA is funded and designed specifically for the needs of time-starved small and medium-sized businesses and proprietors seeking decision support insights and readily available online at no cost.
LISTED IN THE AHFE DIGITAL BOOKSTORE CATALOGUE
Explore the complete digital volume
Global Issues: Disease Control and Pandemic Prevention
Read this individual research paper free through the original publisher, or explore the full digital proceedings book.
ISBN 978-1-958651-00-1
Explore this ISBN in the AHFE Bookstore ↗Listed in the July 2026 bookstore catalogue; search by ISBN to confirm current availability · Digital book purchase optional