Kashif Zia, Muhammad Shafi (2022). Impact of Globally Fair COVID-19 Vaccination: An Analysis based on Agent-Based Simulation. In: Global Issues: Disease Control and Pandemic Prevention. AHFE Open Access, vol. 24, pp. 81–90. https://doi.org/10.54941/ahfe1001362
In this paper, an Agent-Based Model (ABM) is proposed to evaluate the impact of COVID-19 vaccination drive in different settings. The main focus is to evaluate the counter-effectiveness of disparity in vaccination drive among different regions/countries. The proposed model is simple yet novel in the sense that it captures the spatial transmission-induced activity into consideration, through which we are able to relate the transmission model to the mutated variations of the virus. Some important what-if questions are asked in terms of the number of deaths, the time required, and the percentage of population needed to be vaccinated before the pandemic is eradicated. The simulation results have revealed that it is necessary to maintain a global (rather than regional or country-oriented) vaccination provisioning in case of a new pandemic or continual efforts against COVID-19, instead of a self-centered approach.A simplistic agent-based model of virus transmission is used consisting of minimal states of susceptible, vaccinated, infected, and recovered. A moving agent in one of these states is tightly bound to the underlying space, where the space is divided into regions to evaluate the region-based vs. global vaccination drive. Additionally, the virus gets mutated, where the extent of mutation is directly related to spatial activity representing the transmissions. And the inactivity is directly proportional to the mutated variant at a location. The results of the simulation suggest that it is necessary to maintain a global (rather than regional or country-oriented) vaccination drive in case of a new pandemic or continual efforts against COVID-19. It results in a lesser number of deaths, time, and quantity of vaccination required.
After the successful provisioning of COVID-19 vaccination, there had been efforts to achieve a global herd immunity (Moghadas et al., 2019). However, this could not be achieved in time and a variety of new virus variants appea- red. Some of them such as delta variant (Shiehzadegan et al., 2021) and more recently Omicron (Wang and Powell, 2021), (Wang and Han, 2022) were more infectious and apparently infected even the previously infected people (Papanikolaou et al., 2022), (Shrestha et al., 2021). The time turned out to be killer here. The disparity in vaccination drive among different countries turned out be counter-productive, even for the countries which vaccinated
(almost) all of their adult population (Subramanian et al. 2021). General evidence of health disparity in COVID-19 treatments is given in the litera- ture. However, there is a need to analyze the effects of vaccine provisioning disparity at a global scale.
A very few countries are involved in the process of vaccine production. Obviously, these countries would vaccinate their own population first before the vaccine is available to other countries. However, particularly in the case of such a complex global system, the intuitive logic, quite obvious in a situation may not be the optimal choice. Through this paper, we provide evidence to establish it in the context of COVID-19 vaccination drive.
In this paper, an Agent-Based Model (ABM) is proposed to evaluate the impact of COVID-19 vaccination drive in different settings. The simulation results have revealed that it is necessary to maintain a globally “fair”vaccina- tion drive in case of a new pandemic or continual efforts against COVID-19. Here fair means a vaccination drive which is not self-centered (focused on developed countries producing the vaccine), but global (equally distributed right from day 1) across all the regions / countries.
A simplistic model of virus transmission is used consisting of minimal sta- tes of susceptible, vaccinated, infected, and recovered. A moving agent in one of these states is tightly bound to the underlying space, where the space is divided into regions to evaluate the region-based vs. global vaccination drive. Additionally, the virus gets mutated, where the extent of mutation is directly related to spatial activity representing the transmissions. And the inactivity is directly proportional to the mutated variant at a location. Alre- ady, a few agent-based models concerning the vaccination efficiency have been proposed in the literature. Moghadas et al., 2021b have proposed vaccination strategies with a delayed second dose. They have compared dif- ferent vaccination products and provided a projected number of infections, serious cases, and deaths. Matrajt et al., 2021 proposed a mathematical model to estimate the impact on mortality and total infections of comple- tely lifting the COVID-19 restrictions. A qualitative study on who should be prioritized for COVID-19 vaccination is given in (Russell and Gree- nwood, 2020). Another focused attempt is a simulation study to estimate the future infections rates among the vaccinated children (Moghadas et al., 2021a). Closer to our proposed model is (Sah et al., 2021), in which the authors emphasize accelerating the vaccination drive to mitigate high transmissi- bility resulting in more deadly variants. However, the model proposed is population-based without spatial (regional / country-wise) variations. Another similar model is presented by the authors in (Vilches et al., 2021). But the system dynamic model again does not cater for spatial considerati- ons and mobility. Another sound research is published in (Thompson and Wattam, 2021), in which the authors combine the real data with the agent- based model to estimate the impact of lockdown and vaccination against COVID-19. But, this model is about one country only and does not take non- availability of vaccine as an option.
As evidenced by the above, the model proposed in this paper is simple, but, novel in the sense that it captures the spatial virus transmission-related
Impact of Globally Fair COVID-19 Vaccination 83
activity into consideration. This enables us to do inquiry about the effective- ness of the vaccination drive in different settings. In the next section, we have detailed the model, followed by the simulation and results sections. The last section provides a detailed outlook of this research in progress.
MODEL The model represents an individual as a mobile agent, which re-sides on a static cell. The epidemic spread model is based on simple susceptible-infected- recovered/not recovered (SIR) model (Smith and Moore, 2004) to keep focus on the vaccination aspect. In addition to these three states, the fourth state of being vaccinated is added (Topîrceanu, 2021). A few agents in the population are made infected at the start of the simulation. Causally, a susceptible agent can directly be transited to an infected state or it may transit to vaccinated state. An agent may also be transited to an infected state from a vaccinated state. An infected agent may be recovered or may not (die). Even a recovered agent can still be susceptible.
The simulation runs in iterations. At each timestamp, each of the agents makes a causal change in its state depending upon its surrounding. The model is implemented through three sequential modules (procedures), namely tran- smission, recovery, and vaccination, followed by running the module which let the agents move randomly.
Transmission The transmission procedure is executed by all the agents (randomly ordered) which are currently infected. The procedure is dependent on the following variables:
transmission rate of agent a (one of the infected agent) pinned onto the location transmissibility. The location transmissibility depends on how transmission intensive the neighborhood of agent a is. This in turn is handled by cell (patch) variable activity, which is increased as soon as a transmission happens due to the resident agent. The sample activity maps comparing transmission activity of some simulation cases can be seen in Figure 1.
A neighboring agent n which is susceptible.
Neighborhood-based variable ratio vaccinated, which is the ratio of neighborhood agents of agent n that are in vaccinated state.
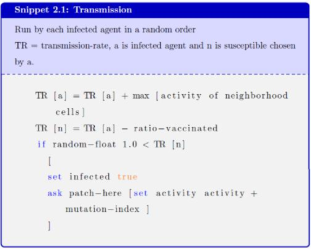
If an agent a has a susceptible agent n in its neighborhood, agent n becomes infected with a probability defined by transmission rate (TR [n]) that is been encountered. TR [n] is equal to difference of transmission rate of the source agent (TR [a]) and the ratio of agents already vaccinated (ratio vaccinated) in the neighborhood of agent n. Hence, the intensity by which the infection is induced by a is depleted based on vaccination. TR [a] is incremented before, depending on how transmission active the neighborhood of a has been. If n is infected, the activity of underlying patch is also increased by a factor mutation index, which represents how effectively mutation is changing the
84 Zia and Shafi
Figure 1: Virus spatial activity: (a) case 1, (b) case 2, (c) case 3, (d) case 4 [description of cases comes later].Figure 2: Virus transmission by an infected agent.
local transmission. The pseudo code given in Snippet 2.1 (figure 2) describes the transmission mechanism run by each infected agent.
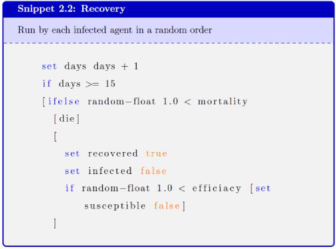
Recovery This recovery procedure applies to those agents which are infected. Each of these agents either remains in the infected state, gets recovered, or dies, depen- ding on the number of days it has been infected and chances (controlled by simulation parameters of mortality and efficacy). The pseudo code given as Snippet 2.2 (figure 3) describes the mechanism run by each infected agent. It is evident that the simulation ticks progress in days. If 15 is the number of days it takes for an infected agent to recover, and the number of days it has been infected is equal to or greater than 15, it may die with probability mor- tality or get recovered. With recovery, some of the agents may be susceptible again based on probability efficacy.
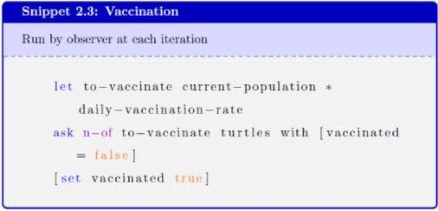
Vaccination According to a vaccination rate, the agents which are not yet vac-cinated are vaccinated. This is a simple procedure just setting the state of an agent to true. The pseudo code given as Snippet 2.3 (figure 4) describes the vaccination process. First the number of agents to be vaccinated are chosen which are not already vaccinated. This depends on the current population of agents and simulation parameter (daily vaccination rate). All these agents are then flagged vaccinated.
Impact of Globally Fair COVID-19 Vaccination 85
Figure 3: Recovery of an infected agent.Figure 4: Process of Vaccination of agents.
SIMULATION Simulation Setup
NetLogo platform (Tisue and Wilensky, 2004) is used to simulate the above model. NetLogo is a discrete-space and discrete-time environment in which the space is divided into cells (called patches) and mobile agents (called tur- tles) move/reside at the top. The simulation can run in iterations (called ticks), where in each of these ticks all agents or a subset of them can perform an action. Both patches are turtles may have user-defined state variables which depend on the overall state of a designated neighborhood. Hence an agent (a patch or a turtle) can be coded in a way that it gets influenced by a set of neighboring agents, thus enabling the model developer to induce a mathematically or socially influenced behavior of the agent.
A cell space of size 160 × 120 is used as the simulation world, wrapped around horizontally as well as vertically. Therefore a population of a maxi- mum of 19200 non-overlapping agents can be generated, each occupying a single patch. We opted to take 50% of the population (9600 agents). Each patch is first initialized with activity 0. As the simulation progresses, all the agents move on patches with a designated speed. They also change their health states (based on the model above), and may end up as dead agents, thus no more part of the simulation world.
In Table 1, the list of global simulation parameters are given. The other parameters such as transmission range (radius of neighborhood), mortality rate, and efficacy of vaccine are also used, however, these acquire static values
86 Zia and Shafi
Table 1. Global simulation parameters.
Table available in the original PDF paper.
Parameter Description Values Population size The total number of Initialized with static agents value of 50% of the space Transmission rate of the virus transmission
Either 0% or 20%
Initialized with 0.50, where all the agents clone the same value initially, which may change later on as given in transmission procedure Mutation index The factor by which Initialized static value of 0.02 Transmission rate is in- creased Vaccination rate The percentage of people who are already vac-cinated (at the start of the simulation) Either true or false blocked? whether the space used is divided into blocks or not
Table 2. Simulation cases.
Table available in the original PDF paper.
Case blocked? Vaccination rate scenario case1 false 0 global ideal case2 false 20 global real case3 true 0 self-centered ideal case4 true 20 self-centered real
of 1.5 patch distance, 0.2, and 0.8, respectively. Whereas, the last two para- meters define the four cases we have considered. These cases are given in Table 2.
Rationale What do these cases mean? Since, in the simulation, the vaccination happens from day 1, the vaccination rate equal to 0% means that the transmission of virus happens along with the vaccination drive. Obviously, this did not hap- pen in case of COVID-19. Hence, 0% vaccination rate depicts a futuristic (ideal) situation in which vaccination is available before the virus outbreak happens. Whereas, a vaccination rate of 20% is about 20% population already vaccinated when the transmission starts. This can be equated to (probably) end of second global wave of COVID-19, when the active cases were quite low and a substantial population was vaccinated. Therefore, the prior represents an ideal and the later represents a real scenario (but an intermediate one).
Since, the vaccination drive (as we have seen in case of COVID-19) was / has been country-centered, where the (mostly) developed countries vacci- nated their own population first, followed by pro-vision of the vaccine to other countries. We term this scenario as self-centered, and it is implemented
Impact of Globally Fair COVID-19 Vaccination 87
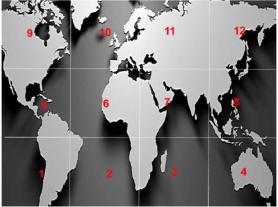
Figure 5: World arranged in vaccination blocks.
in the simulation by introduction of regional blocks (blocks? = true). There- fore, some blocks have more vaccines in comparison to others. An alternate strategy would have been a globally balanced vaccination drive irrespective of country of manufacturing. Thus, that would have been a global drive, in which, all the blocks would have been the same (hence, block? = false).
In fact, there are 12 regional blocks as shown in Figure 5. Al-though, a clear differentiation is enough for modeling purposes, however, the blocks/regions are sorted from left to right and from bottom to top, in terms of availability of vaccine. So for example, region 1 is the worst, followed by region 2, 3, and so on. The last column of Table 2 summarizes the scenarios in terms of the above two dimensions.
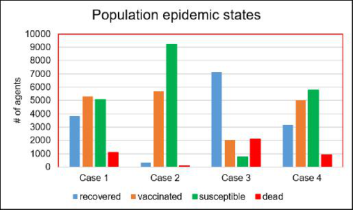
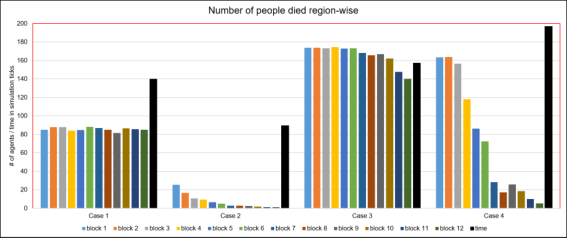
So the idea is to measure the performance of the vaccination drive in all four scenarios and do a comparative analysis. The simulations are average of sufficient number of runs. The results are compared based on the following outcomes. The results shown in graph in Figure 6 represent the number of agents in different states after the simulation ends (there is no more infected agent in the population). The graph in Figure 7 shows the number of people dead and time when the simulation ends, with particular focus on blocks situation.
Simulation Results states (Figure 6):
Starting with the self-centered real scenario (case 4), it can be seen that, we end up with almost 10% of the population dead, whereas, recovered, vaccinated and susceptible follow the same order. If we compare these results with global real scenario (case 2), the dead % drops down to less than 1. It should be noted that a very small fraction of infected agents (taken value of 0.005-0.010%) dispersed randomly across the space at the start of the simulation, does not really represents the reality. However, it can be considered as cancelling the fact that vaccinations are also done at random, not according to the severity of the regional infectiousness. Nevertheless, it does not take away the fact that a global vaccination drive would have helped a lot.
For the ideal scenarios, case 3 represents the self-centered situation. The dead % increases to 22. Whereas, for a global situation (case 1), it could
88 Zia and Shafi
Figure 6: Epidemic states at the end of the simulation.Figure 7: World arranged in vaccination blocks.
be reduced to 9.5%. However, case 3 is much more diversified in terms of distribution of deaths.
dead? (Figure 7): It is clear from the graph shown in Figure 6 that a global vaccination drive, right from the start (in case of availability of vaccine) or whenever it was available, would have resulted in much less deaths.
Now the question is do these deaths happen only in regions which are not self-centered. For this we consult the graph shown in Figure 7. As expected, in case 4, the number of people dead follow almost the same order from 1 to 12. But, if we compare it with case 2, case 2 gives a much improved global picture, in fact 10 times better than case 4. The gain among various blocks range from 5 times (for blocks with availability) to 15 times (for blocks with non-availability). However, this disparity (between blocks) becomes really negligible if we compare case 3 with case 1. But, the global gain of case 1 is almost 2 times that of case 3. So, in future, in case of a pandemic (with availability of vaccine), it will be strategically beneficial to go for a global vaccination drive rather than the self-centered one.
time (Figure 7): A closure happening at a early time is absolutely beneficial as the World is tired and seeking a normal social and economic activity. At the time scale of the simulation, it is evident in the graph shown in Figure 7 that worst case time is for case 4. We gain at least 20% in case 2. When comparing case 3
Impact of Globally Fair COVID-19 Vaccination 89
Figure 8: Vaccination percentage required.
with case 1, the gain is 10%. So global vaccination drive is also beneficial in terms of time needed to eradicate the pandemic.
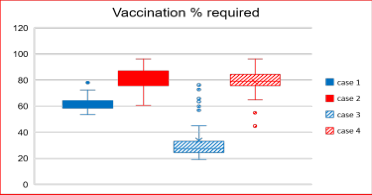
vaccinated? (Figure 8): Finally, we have results of how much population is needed to be vaccinated in each case in Figure 8. Obviously, if the vaccine is invented late (case 2 and 4), it will be required more, almost 85% of the population. And, there is no difference between these two cases. However, the time to achieve this num- ber is lesser in case 4. Whereas, the time to achieve the required percentage between cases representing availability of vaccine right from the start is not much different among case 3 and 1, but, the required % decreases to almost 30% in case 3 when compared to more than 60% in case of case 1.
CONCLUSION
There are implications of lack of fair distribution of COVID-19 vaccine (Wouters et al., 2021), (Sahar et al., 2020). In this paper, we simulated an Agent-Based Model to evaluate the effectiveness of COVID-19 vacci- nation drive based on its provision to different regions of the world. The model proposed is simple yet novel in the sense that it captures the spa- tial transmission-induced activity into consideration, through which we are able to relate the transmission model to the mutated variations of the virus. The results of the simulation suggest that it is necessary to maintain a glo- bal (rather than regional or country oriented) vaccination drive in case of a new pandemic or continual efforts against COVID-19. It results in a lesser number of deaths, time, and quantity of vaccination required.
REFERENCES
Moghadas, S.M., Fitzpatrick, M.C., Shoukat, A., Zhang, K. and Galvani, A.P., (2021). Simulated identification of silent COVID-19 infections among children and estimated future infection rates with vaccination. JAMA network open, 4(4). Matrajt, L., Janes, H., Schiffer, J.T. and Dimitrov, D., (2021), July. Quantifying the
impact of lifting community nonpharmaceutical interventions for covid-19 during vaccination rollout in the united states. In Open forum infectious diseases (Vol. 8, No. 7, p. ofab341). US: Oxford University Press.
and Galvani, A.P., (2021). Evaluation of COVID-19 vaccination strategies with a delayed second dose. PLoS biology, 19(4), p. e3001211. Moghadas, S.M., Vilches, T.N., Zhang, K., Wells, C.R., Shoukat, A., Singer, B.H., Meyers, L.A., Neuzil, K.M., Langley, J.M., Fitzpatrick, M.C. and Galvani, A.P., (2021). The impact of vaccination on coronavirus disease 2019 (COVID-19) out- breaks in the United States. Clinical Infectious Diseases, 73(12), pp. 2257–2264. Papanikolaou, V., Chrysovergis, A., Ragos, V., Tsiambas, E., Katsinis, S., Manoli, A.,
Papouliakos, S., Roukas, D., Mastronikolis, S., Peschos, D. and Batistatou, A., (2022). From Delta to Omicron: S1-RBD/S2 mutation/deletion equilibrium in SARS-CoV-2 defined variants. Gene, p.146134. (Papanikolaou et al., 2022) Russell, F.M. and Greenwood, B., (2021). Who should be prioritised for COVID-19 vaccination?. Human vaccines & immunotherapeutics, 17(5), pp. 1317–1321. Shiehzadegan, S., Alaghemand, N., Fox, M. and Venketaraman, V., (2021). Analy-
sis of the delta variant B. 1.617. 2 COVID-19. Clinics and Practice, 11(4), pp. 778–784. (Shiehzadegan et al., 2021) Shrestha, N.K., Burke, P.C., Nowacki, A.S., Terpeluk, P. and Gordon, S.M., (2021).
Necessity of COVID-19 vaccination in previously infected individuals. MedRxiv. Subramanian, S.V. and Kumar, A., (2021). Increases in COVID-19 are unrelated to levels of vaccination across 68 countries and 2947 counties in the United States. European Journal of Epidemiology, 36(12), pp. 1237–1240. Sahar, N., Lee, O., Hoffman, S.J. and Sritharan, L., (2020). Overview of key
legal, political, and social challenges facing global vaccination efforts. Imagi- nations: Journal of Cross-Cultural Image Studies/Imaginations: revue d’études interculturelles de l’image, 11(2), pp. 127–153. (Sahar et al., 2020). Smith, D. and Moore, L., (2004). The SIR model for spread of disease-the differential equation model. Convergence. Sah, P., Vilches, T.N., Moghadas, S.M., Fitzpatrick, M.C., Singer, B.H., Hotez, P.J.
and Galvani, A.P., 2021. Accelerated vaccine rollout is imperative to mitigate highly transmissible COVID-19 variants. EClinicalMedicine, 35, p. 100865. Topîrceanu, A., (2021). Immunization using a heterogeneous geo-spatial population model: A qualitative perspective on COVID-19 vaccination strategies. Procedia Computer Science, 192, pp. 2095–2104. Tisue, S. and Wilensky, U., (2004), May. Netlogo: A simple environment for modeling
complexity. In International conference on complex systems (Vol. 21, pp. 16–21). Thompson, J. and Wattam, S., (2021). Estimating the impact of interventions against COVID-19: from lockdown to vaccination. PLoS ONE, 16(12), p.e0261330. Vilches, T.N., Rubio, F.A., Perroni, R.F., de Almeida, G.B., Ferreira, C.P. and Forta-
leza, C.M.C.B., (2021). Vaccination efforts in Brazil: scenarios and perspectives under a mathematical modeling approach. medRxiv. Wang, C. and Han, J., (2022). Will the COVID-19 pandemic end with the Delta and Omicron variants?. Environmental Chemistry Letters, pp. 1–11. Wang, X. and Powell, C.A., (2021). How to translate the knowledge of COVID-19
into prevention of Omicron variants. Clinical and Translational Discovery, 1(1), p. e22. Wouters, O.J., Shadlen, K.C., Salcher-Konrad, M., Pollard, A.J., Larson, H.J., Teerawattananon, Y. and Jit, M., (2021). Challenges in ensuring global access to COVID-19 vaccines: production, affordability, allocation, and deployment. The Lancet, 397(10278), pp. 1023–1034.
LISTED IN THE AHFE DIGITAL BOOKSTORE CATALOGUE
Explore the complete digital volume
Global Issues: Disease Control and Pandemic Prevention
Read this individual research paper free through the original publisher, or explore the full digital proceedings book.
ISBN 978-1-958651-00-1
Explore this ISBN in the AHFE Bookstore ↗Listed in the July 2026 bookstore catalogue; search by ISBN to confirm current availability · Digital book purchase optional