Kexin Lu, Shengchao Li, Chengqi Xue, Lei Zhou (2021). Influence of Brightness and Saturation of the Background Color of the Computer Icons on the Matching Color Aesthetics. In: Human Systems Engineering and Design (IHSED2021): Future Trends and Applications. AHFE Open Access, vol. 21. https://doi.org/10.54941/ahfe1001136
This article mainly explores the influence of the brightness and saturation of the background color of the computer icons on the matching color aesthetic. The color of an icon has a crucial effect on its aesthetics. In this study, a total of 72 icons were experimentally evaluated. The experimental results are compared with the conclusions of the matching color aesthetic calculation model. Finally, from this pilot study, we can receive a conclusion that the saturation of the background color has a certain effect on the matching color aesthetic of the icon. However, due to the discrepancy between the results of the brightness experiment and the conclusions of the model, the effect of the brightness on the matching color aesthetic of the icon still needs further research and exploration. Besides, the experimental results show that changes in the shape of the logo in the icon will also have an impact on the evaluation of the aesthetic.
Human Systems Engineering and Design (IHSED 2021) https://openaccess.cms-conferences.org/#/publications/book/978-1-7923-8987-0
INTRODUCTION
Beauty is a visually pleasant feeling. The aesthetic level of a product has a direct impact on the attitude of consumers. Besides, it is also one of the decisive factors for the success of the product in the market [1]. Therefore, in interface design, it is very important to understand the user's aesthetic preferences for the interface. The statistical studies have shown that the aesthetics of the interface has a greater impact on the user's experience than the operational usability. Among them, the choice of color is an important factor that affects the user's choice of interface [2]. Color has three attributes: brightness, saturation, and hue. These three attributes will have an impact on the presentation of colors [3]. Brightness is the eye's perception of the brightness of the light source and the surface of the object, which is mainly a visual experience determined by the intensity of the light. Saturation usually refers to the vividness of colors, which represents the proportion of the colored components contained in the color. The higher the proportion of color components, the higher the saturation of the color, and the lower the proportion of color components, the lower the saturation of the color. Hue is the primary feature of color and the most accurate standard for distinguishing various colors. Icons are composed of colors and graphics or text. The color, graphics, and text of the logo will have a certain impact on the icon[4]. In this article, I mainly research the influence of the brightness and saturation of the background color on the aesthetic of the icon color.
RESEARCH PURPOSE AND METHOD The purpose of this research is to research the influence of the brightness and saturation of the background color on the aesthetic of the icon color. In previous aesthetic evaluations of color, many researchers ignored that aesthetic preferences are highly subjective, and different people have different aesthetic evaluations. According to the three-level brain processing theory determined by Norman (2004), The brain instinctively processes the aesthetic appearance of colors, where the human response to colors will be affected by biological evolution in the brain. Besides, when people are asked to make subjective judgments about colors, the brain's processes are also affected by human beliefs. Therefore, people's aesthetic evaluation of colors may be affected by values and beliefs, and values and beliefs are affected by culture, education, and experience. Therefore, in order to avoid the subjectivity of the aesthetic preferences of the subjects having an impact on the experimental results, the rating consistency of each color will be evaluated before the experiment. Rating agreement is the degree to which the subjects' aesthetic preferences agree in a given situation. Grade consistency is the degree of agreement between subjects’ aesthetic preferences in a given situation. For example, when a color has similar aesthetic ratings, then this color may have a higher level of consistency. On the contrary, when the aesthetic preference score changes significantly, this color has a lower grade score consistency[5]. In the experiment, we will select colors with high-level evaluation consistency for the experiment. When
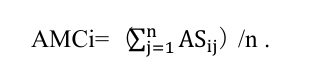
Human Systems Engineering and Design (IHSED 2021) https://openaccess.cms-conferences.org/#/publications/book/978-1-7923-8987-0 assessing the consistency of the rating evaluation, subjects will evaluate the six basic hues in the spectrum, including red, orange, yellow, green, blue, and purple, using a seven-point Likert scale. The standard deviation will be a performance indicator to evaluate the consistency level of each color. A small standard deviation indicates that the evaluations tend to be very close to the mean, while a large standard deviation indicates that the data varies widely. The method of rating consistency is:
Equation reproduced from the original PDF.
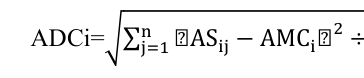
(1) Where j=1,2,3, ..., m; j=1,2,3, ...; ASij is the score of the i-th color by the j-th object, and AMCi is the average of the grade evaluation scores of the i-th color . The standard deviation (ADC) is expressed as ADCi, which is the standard deviation of the evaluation score of the i-th color grade. ADCi can be derived as:
Equation reproduced from the original PDF.
2 ÷ n . (2) Where i=1, 2, 3, ..., m; j=1, 2, 3, ..., n. With the increasing of the standard deviation, the difference of the subjects' aesthetic preference for color also increased, that is, the consistency of grade evaluation was low[5].
Through the experiment of 20 subjects aged between 20 and 26, it is finally concluded that red has the highest level of rating consistency, followed by orange, and purple is the lowest. Therefore, in the following experiment on the influence of brightness and saturation of background color on the aesthetic of icons, three colors with high consistency in grade evaluation, red, blue, and orange, will be used as the basic background hue for the experiment. Also, the purpose of this article is to study the effect of the brightness and saturation of the background color on the aesthetic of the color of the icon. To simulate the icon, and to prevent the subjective factors, such as the preference of the color of the logo area, from affecting the accuracy of the experimental results, it is necessary to control variables for the logo area of the icon. Therefore, the color of the logo area is set to white and the shape is set to a simple image, and to verify whether the shape of the logo will affect the evaluation of the subjects, three different shapes(Shape 1, Shape 2, Shape 3) will be set in the experiment, and the controlled experiment will be carried out. The shapes are shown in the figure( Fig. 1) below:
Human Systems Engineering and Design (IHSED 2021) https://openaccess.cms-conferences.org/#/publications/book/978-1-7923-8987-0
Shape 1 Shape 2 Shape 3
Fig. 1. three different shapes are used in the experiment
Experimental Conditions Subjects: All subjects are graduate students between 20-30 years old. The number of subjects affected by changes in brightness and saturation in the experiment was both 11. All the subjects did not receive the training of color operation before. The experiments were carried out in the same experimental condition without payment. Samples: The experimental samples are divided into two groups, each group has 36 850*850px icon samples, which have only brightness changes and saturation change respectively, and the Munsell color system is used. The attributes of the experimental samples are shown in Table 1. The three basic colors are 5R4/14, 5YR6/12, and 5B3/8. Experimental quality control: In order to improve the objectivity and reliability of the experimental results, the following measures will be taken in the experiment:
i. The subject is willing to actively cooperate with the experiment. ii. In order to obtain reliable experimental data, the subjects are required to make judgments without thinking, and make choices and evaluations based on their first sense.
iii. The order of the samples should not be in a fixed order, and the order of the samples should not have any hint or set for the subjects. Experimental Method During the experiment, four samples are presented to the subjects at a time. Among the three color attributes of the four samples, two of them are controlled, and one of the attributes is changed. Participants are asked to use their first feelings to evaluate the four samples to determine which sample is more beautiful. The highest score is 4 points, and the lowest score is 1 point. The four samples are ranked and evaluated, and the evaluation is recorded.
ANALYSIS OF EXPERIMENTAL RESULTS In the brightness experiment, we used three different colors: 5B3/8, 5R4/14, 5YR6/12. Under the condition that the basic hue and saturation remain unchanged, we make the subjects evaluate the three samples separately and record the evaluation results.The colors used in the experiment are shown in Table 2.
Table 2. Distribution of Color Number Sequence Sample Number V1 V2 V3 V4 Color 1 5B5/6 5B6/6 5B7/6 5B8/6 Color 2 5R4/14 5R5/14 5R6/14 5R7/14 Color 3 5YR5/10 5YR6/10 5YR7/10 5YR8/10
Table available in the original PDF paper.
Table 3. Experiment Data Averaging Sample Number V1 V2 V3 V4 Data 1 1.909 2.364 3 2.727
Table available in the original PDF paper.
Human Systems Engineering and Design (IHSED 2021) https://openaccess.cms-conferences.org/#/publications/book/978-1-7923-8987-0
Data 2 1.909 2.182 3 2.909 Data 3 1.727 2.273 3 2
0 1 2 3 4
V1 V2 V3 V4 Data1 Data2 Data3
Chart 1. Mean Distribution Line Chart
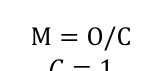
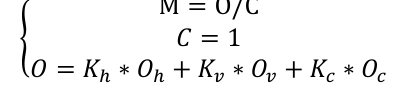
Through the averaging processing and analysis of these experimental data, the processing results are shown in Table 3. The analysis results show that in the experiment with three different hues as the basic hues, the brightness is sorted from small to large, and each result shows that the color of V3 has the highest evaluation score. It is not that the higher the lightness, the higher the score( that is, the more beautiful people thought it was)or the lower the brightness, the higher the score. However, in the color matching aesthetic calculation model[6]:
Equation reproduced from the original PDF.Equation reproduced from the original PDF.
.
{
{
(3)
Equation reproduced from the original PDF.
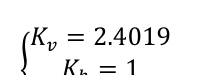
𝐾ℎ= 1 𝐾𝑐= 0.2865 As shown in the formula, when the saturation and hue are the same and the color of the logo is fixed, the greater the difference in brightness is, the greater the M is, and the higher the aesthetic is. However, the result we obtained in the experiment is that the colors of the sample number V3 has the highest evaluation scores, and from the table 2, we can know that the brightness of these colors is not the highest or the lowest, and the brightness of achromatic white is 10. Therefore, the brightness difference between these colors and the logo color is not the highest, which is not the same as the result obtained by the formula. Part of the reason for this may be that the small sample size. Therefore, further investigation and experimental research is needed.
Similarly, in the saturation experiment, we change the saturation of the three basic hues. Under the condition that the brightness and basic hues remain unchanged, the subjects were asked to evaluate the three samples separately and record the evaluation results.
Through the average processing analysis of the experimental data obtained in the
Human Systems Engineering and Design (IHSED 2021) https://openaccess.cms-conferences.org/#/publications/book/978-1-7923-8987-0 saturation experiment, the processing results are shown in Table 3. Besides, It can be clearly seen from the line chart that the scores of the three colors are showing an upward trend in general. Therefore, in the case of a certain color attribute of the logo, the higher the saturation of the background color is, the higher the evaluation of the aesthetic of the icon is. In the matching color aesthetic calculation model, it can be seen from the formula that the greater the saturation difference between the icon color and background color is, and the higher the aesthetic calculated by the color matching beauty calculation model, which is consistent with the experimental results. Therefore, through experiments and the calculation of the model, it can be concluded that the saturation of the background color has an impact on the matching color aesthetic of the icon. And when the three attributes of the logo color remain unchanged , The greater the difference between the saturation of the background color and the logo color is, the higher the color aesthetic of the icon is. In addition, in the experiment, we also found that for different logo shapes, the participants’ evaluations of the aesthetic of the icons have changed, which shows that the shape of the logo will also have an impact on the aesthetic.
CONCLUSION
Through experimental research and analysis, we can conclude that: in icon design, the saturation of the background color will have a certain impact on the color aesthetic of the icon, and the influence of the brightness of the background color on the aesthetic needs further research and analysis because the experimental conclusion does not match the formula calculation result. In addition, the shape of the logo will also have a certain impact on the aesthetic of the icon.
ACKNOWLEDGMENTS
This paper is supported by Science and Technology on Avionics Integration Laboratory and Aeronautical Science Fund (No. 201913069001).
REFERENCE Zhe, M.. Icon design in graphic image interface (in Chinese). Wuhan University of
Technology, Wuhan (2009) Yanjie, L, Human-computer interaction interface quality evaluation based on color quantification (in Chinese). Hefei University of Technology, 2017 Ke W.. Color Design System for Computer-Aided Industrial Design (in Chinese).
Journal of Computer-Aided Design & Computer Graphics (2007) Lixia, H.. User interface icon design research (in Chinese). Xi'an: Shanxi Normal University, Xi'an (2014) Huang S..The rating consistency of aesthetic preferences for icon-background color
Human Systems Engineering and Design (IHSED 2021) https://openaccess.cms-conferences.org/#/publications/book/978-1-7923-8987-0
Yufeng, L., Xianrong, Z.. Color harmony aesthetic measure evaluation model for computer aided design (in Chinese). Computer Engineering and Applications. 24, 110-113 (2007)
Human Systems Engineering and Design (IHSED 2021) https://openaccess.cms-conferences.org/#/publications/book/978-1-7923-8987-0
LISTED IN THE AHFE DIGITAL BOOKSTORE CATALOGUE
Explore the complete digital volume
Human Systems Engineering and Design (IHSED2021): Future Trends and Applications
Read this individual research paper free through the original publisher, or explore the full digital proceedings book.
ISBN 978-1-7923-8987-0
Explore this ISBN in the AHFE Bookstore ↗Listed in the July 2026 bookstore catalogue; search by ISBN to confirm current availability · Digital book purchase optional