Dongxin Fuchen, Ningyue Peng, Haiyan Wang, Yafeng Niu, Chengqi Xue (2021). The View Switching Cost Analysis by the Visuo-auditory Dual-task Paradigm. In: Human Systems Engineering and Design (IHSED2021): Future Trends and Applications. AHFE Open Access, vol. 21. https://doi.org/10.54941/ahfe1001181
View switching, for example different information density, type and magnitude, will cause additional switching cost between different scene. In this paper, the user interface of different information density will be used to explore the additional switching cost between different view transition through the dual-task paradigm. We use visual-auditory task to observe the interactive effect between the two tasks. Subjects need to do the searching and counting task in visual scene and do auditory task response in the meantime. We find that 1) view switching (information density) will generate additional switching cost from the scene of low information density to high information density by analyzing the visual task performance; 2) the mutual effect is obvious when subjects do the visual and auditory task at the same time that visual searching and counting task will expend more cognitive resources than auditory response task as the dual-task goes on.
Human Systems Engineering and Design (IHSED 2021) https://openaccess.cms-conferences.org/#/publications/book/978-1-7923-8987-0
INTRODUCTION
Scene switching occurs at every moment and means that cognitive state will change accordingly. For example, switching between tasks of different complexity leads to cognitive fatigue (Di et al.2017). Different switching paradigms affect different cognitive flexibility (Petruo et al.2019). Different switching modes, such as global switch, local switch and compatible switch (Nashiro et al. 2018), cause different switching cost for task performance. For the zoomable user interface, zooming and panning operation generate different information density presentation between different hierarchy of view (Chung et al. 2011). Switches between information hierarchy cause switching cost for visual perception. In this paper, view switching cost will be analyzed by switching between user interfaces of different information density and quantity used as the abstract representation of zooming. Multi-modal paradigm is essential for detecting switching cost between tasks of different modality (Bresciani et al. 2008). In the weighting mechanism of central capacity limitation (Töllner et al. 2012), the mutual effect exists between the performance of tasks. In our study, research aims to analyze the switching cost in the view switching and the mutual effect of visual and auditory task based on a paradigm of dual-task. Switching cost in view switching. In the review article of Task-switching, task-set reconfiguration processes, new information will be processed after previous information, exist in the mechanism of task switching (Monsell. 2003). The switching cost can be decreased by substantial preparations, but not eliminated. For the task switching of incongruent condition (Strobach et al. 2020), the performance with different responses is worse than the same response of congruent condition. Switching cost also exists in speech switch because the talker switches result in cognitive cost of attentional reorientation (Lim et al. 2019). Besides, opportunity cost of time affects cognitive control, perceptual decision-making and task-switching because of the consideration of average reward rate per unit time (Otto et al. 2019). Indirect cost of context switch can be experimentally quantified through the method of synthetic workload. The impact of switching can be alleviated by using a multi- processor system for the context switch measurement (Li et al. 2007). In conclusion, switching cost is one of the essential factors for the task switching performance research. Information density about visual searching. Information density and the presentation methods affect the ability of visual search and the working memory load. Research shows that task performance of high visual search ability and low working memory load is better than low visual search ability and high working memory load (Chang et al. 2012). Local density of information layout design is a factor of visual search. Reaction time data and eye movement data indicate that it is beneficial to place important information in sparse groups than dense groups (Halverson et al.2004). Visual search strategy plays an important role in Human-Computer
Human Systems Engineering and Design (IHSED 2021) https://openaccess.cms-conferences.org/#/publications/book/978-1-7923-8987-0
Interaction. The expected information gain guides the information gathering strategies (Tseng et al.2008). Different visual search action will be taken and managed for different information scene. Dual-task paradigm for attention management. Based on theory of the dynamic of a central bottleneck and the Psychological-Refractory-Period (PRP), an audio-visual dual-task experiment illustrates that the Stimulus Onset Asynchronies (SOA) and Task Order Predictability (TOP) affects the dual-task performance and reinforces this theory (Töllner et al. 2012). In the analysis of the attention management in multiple- view visualizations, chromatic color has a better cueing effect than achromatic color on the switching cost in multi-view through the evidence from eye-tracking by using a dual-task paradigm (Peng et al.2021). Mutual effects exist in the multi-modal tasks simultaneously, for example visual, auditory and tactile modalities (Bresciani et al. 2008). Task of high reliability and low variability is dominant in multi-tasks simultaneously. Besides, to improve the overall performance, self-paced task strategy manages the working memory load and ongoing tasks (Young et al.2013). Moreover, promoting or inhabiting effects between ongoing tasks are obvious. Similar task attributes promote task performance each other and vice versa (Brungart et al.2019). Promoting effect also exists in the same presentation frequency of task materials (Einhäuser et al.2017). The cognitive resources are limited and dynamic. But the occupation of each task depends on the ongoing tasks and the overall task management and strategy. Experimental hypothesis. First, additional switching cost exists in the view switching from low to high information density; Second, the performance of auditory task changes as the performance of visual task changes; Third, the performance of auditory task in the low information density will be better than high information density user interface.
METHODOLOGY
This research aims to analyze the switching cost in view switching and the mutual effect of visual and auditory tasks by using a visual-auditory dual-task experiment. Participants. All participants (31 in total, 15 males and 16 females, 20-26, Mean= 23.5, SD=1.4) are students of Southeast University in China. Participants have a self- reported normal or corrected-to-normal vision and passed the Ishihara Color Blindness Test. The experiment was conducted at Human Factors and Ergonomics Laboratory of Southeast University. The experiment lasts for 40-60 minutes and participants were compensated 50 yuan of their participation. Apparatus. All experimental materials were presented on Mechrev 15.6-inch display and the software of E-prime 2.0. The laboratory was set in normal lighting conditions (40W fluorescent). Viewing distance ranged approximately from 400 mm to 600 mm. Experimental material design. Visual task material. There are two information density (high versus low) and four switching modes (from low to low, from low to high, from high to low and from high to high). The resolution of the visual material is
Human Systems Engineering and Design (IHSED 2021) https://openaccess.cms-conferences.org/#/publications/book/978-1-7923-8987-0
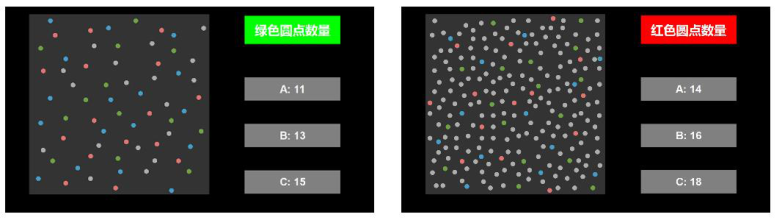
945px*945px and the screen is 1920px*1080px. In order to avoid the mutual effect of colors, the four colors of dots were chosen based on the Munsell color model. They are Red (R=226, G=117 and B=113), Green (R=112, G=163 and B=70), Blue (R=71, G=158 and B=201) and Gray (R=174, G=174 and B=174). The background color (R=51, G=51 and B=51). The total amounts of the dots of the high information density user interface are double of the low (See Figure 1). But the amounts of the three chromatic dots are the same (from 13-18). The positions of the dots are ranged randomly. Auditory task material. There are two auditory stimulus (high-pitch (1000Hz) and low-pitch (200Hz)). The duration of each auditory pitch is 100 milliseconds. The stimulus onset asynchrony is 1000 milliseconds. The total presentation time for auditory task material of every experiment is about 30 seconds. Experimental task and procedure. The experiment design is in-subject design. In the visual task, participants search and count the numbers of certain color dots follow the color and instruction of the top right corner of the presentation (See figure 1). When participants make a choice, the experimental interface switches to the next one. In the auditory task, participants do a keyboard response to the high-pitch and do not response to the low-pitch. Visual task and auditory task are presented together in the meantime. When the visual task switches to next one, both switch to next experimental presentation. We define 5 experimental presentation switches as one block. There are 8 blocks including 40 experimental presentation switches that 10 times switches of each of the 4 switching modes. 10 seconds to rest for the completion of 1st, 3rd, fifth and seventh block. 30 seconds to rest for the completion of 2nd, fourth and sixth block. Participants need to complete a practice experiment of 2 to 4 blocks. After the self-report of experimental proficiency, formal experiment begins.
Figure 1. Visual experiment presentation.
Dependent variables. The independent variables are visual stimuli (4 switching modes) and auditory stimuli (high-pitch versus low-pitch). Therefore, the dependent variables are visual variables (visual task response time and correctness) and auditory variables (auditory stimuli response time, missing rate and error rate).
Human Systems Engineering and Design (IHSED 2021) https://openaccess.cms-conferences.org/#/publications/book/978-1-7923-8987-0
RESULT
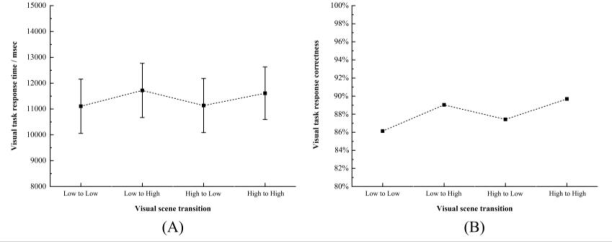
Visual task response time and correctness. In part A (See Figure 2), the visual response time of low information density (after the switches from Low to Low and High to Low) is shorter than the high information density (after the switches from Low to High and High to High). The ANOVA for visual response time shows that there is no significant difference (p>0.05) for the four switching modes and also no significant difference (p>0.05) between any two kinds of the switching modes. In part B, it is obvious that the correctness of high information density (after the switches from Low to High and High to High) is higher than low information density (after the switches from Low to Low and High to Low).
Figure 2. Visual task response time and correctness.
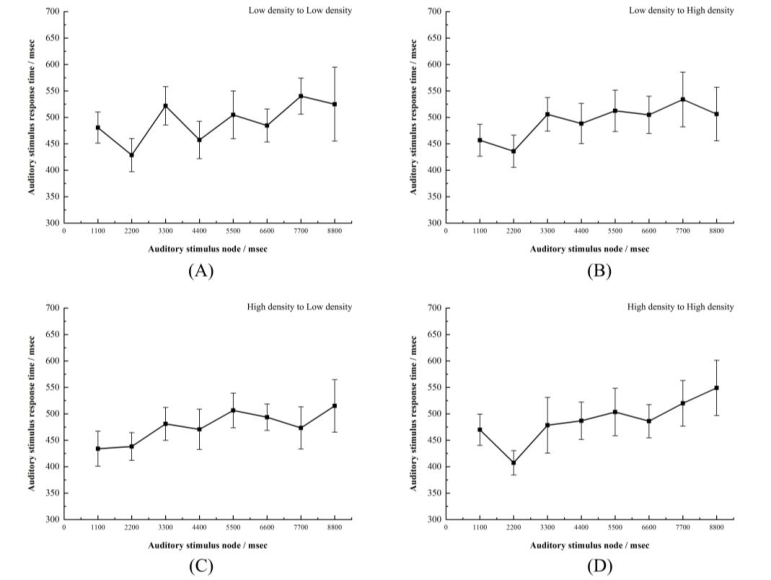
Auditory task response time, error rate and missing rate. According to the analysis of the first eight response data of the auditory task performance. There is no significant difference (p>0.05) for the response time in the 4 switch modes and also (p>0.05) between any two kinds of them through the analysis of single factor repeated measurement (See figure 3). In the regression analysis of the response time, there are significant differences in ANOVA for each switch mode. The regression equations are as follows: low to low (y=451.560+0.009x, R2=0.30, p=0.008<0.05), low to high (y=452.516+0.008x, R2==0.21, p=0.026<0.05), high to low (y=440.942+0.008x, R2=0.31, p=0.008<0.05) and high to high (y=435.732+0.012x, R2=0.47, p=0.001<0.05). The regressions show that the response time increases gradually as the experiment goes on in all 4 switch modes.
Human Systems Engineering and Design (IHSED 2021) https://openaccess.cms-conferences.org/#/publications/book/978-1-7923-8987-0
Figure 3. Auditory stimulus time in all switching modes.
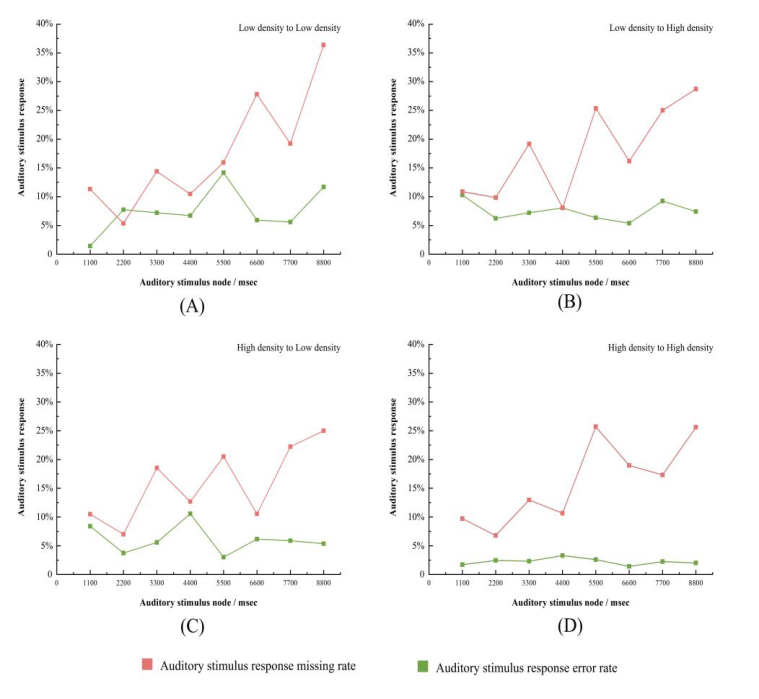
In the regression analysis of the missing rate, significant difference exists in the 4 switch modes including low to low (y=0.017+0.000032x, R2=0.706, p=0.009<0.05), low to high (y=0.067+0.000023x, R2=0.595, p=0.025<0.05), high to low (y=0.072+0.000018x, R2=0.530, p=0.041) and high to high (y=0.057+0.000021x, R2=0.627, p=0.019<0.05) (See figure 4). It means that the missing rate increases gradually as the experiment goes on in all 4 switch modes. However, there is no significant difference (p>0.05) for the error rate in 4 switch modes.
Human Systems Engineering and Design (IHSED 2021) https://openaccess.cms-conferences.org/#/publications/book/978-1-7923-8987-0
Figure 4. Auditory stimulus response missing and error rate.
DISSCUSSION Hypothesis variation. The 1st and 2nd hypothesis are supported by the results analysis but there is no proper evidence for the third hypothesis. Switching cost for view switching. From the figure 3, it is found that the response time will increase with the switching from low density to high density and decrease with the switching from high to low. Additional switching cost (increase or decrease) will be paid to ensure the new adaption when information switching. Visual task performance under the switching of different information density. Figure 3 shows the visual task correctness in part B. After the transition, the
Human Systems Engineering and Design (IHSED 2021) https://openaccess.cms-conferences.org/#/publications/book/978-1-7923-8987-0 performance in high information density is better than low. It means that the low information density is not always the best way for information presentation. Different visual search strategies will be chosen to improve the efficiency of information gain in different visual search environment (Tseng et al.2008). The gazes for high information density are less than low and each gaze time for high information density is much than low (Tseng et al.2008). It is deduced that every dot will be searched as a visual unit in low information density but area as a visual unit in high information density. More visual units generate more visual working memory load. Therefore, to some extent the visual performance in high information density is better than low. Visual-auditory dual-task correlation mechanism. From the figure 4 and 5, as the dual-task experiment goes on, response time and missing rate for auditory task increase gradually. It indicates that the cognitive resource taken by auditory task decreases gradually but taken by visual task increases gradually. In the visual searching and counting task, visual searching leads to visual working memory load and dots counting leads to cognitive load (Peng et al.2021). In the visual-auditory task management, high priority for visual searching and counting task deteriorate the performance of auditory task. Limitation. In the visual-auditory dual-task design, there is no significant difference for the performance of auditory task in 4 switch modes. It is inferred that most of the cognitive resource occupied by visual task leads to that small part occupied by auditory task. The task trade-off design is one important factor needed to be considered in further study. Besides, the interface design for visual task is an abstract way to present different information density. But it is necessary to think about the influencing factors of information presentation in the real world for future research.
CONCLUSION
This research aims to analyze the cost of view switching and the mutual effect of dual tasks. It is deduced from the visual-auditory dual-task experiment that the switching cost exists in the view switching and the mutual interaction exists in the dual tasks. In conclusion, there are influence factors of view task performance in behavioral measures. The physiological measures will be the meaningful way for future research.
ACKNOWLEDGEMENT
The paper is supported by Natural Science Foundation of China (No. 71871056 & 71801037) ,by Aerospace Science Foundation of China (No. 20200058069002), and by grant from the Fundamental Research Funds for the Central Universities & Postgraduate Research and Practice Innovation Program of Jiangsu Province (No. KYCX17_0056).
Human Systems Engineering and Design (IHSED 2021) https://openaccess.cms-conferences.org/#/publications/book/978-1-7923-8987-0
REFERENCE Di Stasi, L.L. et al. (2017) Quantifying the cognitive cost of laparo-endoscopic single-
site surgeries: Gaze-based indices. Appl. Ergon. 65, 168–174. Petruo, V.A. et al. (2019) Numbers in action during cognitive flexibility – A neurophysiological approach on numerical operations underlying task switching. Cortex. 120, 101–115. Nashiro, K. et al. (2018) Age-related differences in BOLD modulation to cognitive
control costs in a multitasking paradigm: Global switch, local switch, and compatibility-switch costs. Neuroimage. 172, January, 146–161. Chung, M.K. et al.(2011) The effects of zoomable user interfaces and user age in searching for a target with a mouse on a two-dimensional information space. Int. J. Ind. Ergon. 41, 2, Bresciani, J.P. et al. (2008) Tri-modal integration of visual, tactile and auditory
signals for the perception of sequences of events. Brain Res. Bull. 75, 6, 753– 760. Töllner, T. et al. (2012) The effect of task order predictability in audio-visual dual task performance: Just a central capacity limitation? Front. Integr. Neurosci. 6, SEPTEMBER, 121–133. Monsell, S. (2003) Task switching. Trends Cogn. Sci. 7, 3, 134–140. Strobach, T. et al. (2020) No evidence for the reduction of task competition and
attentional adjustment during task-switching practice. Acta Psychol. (Amst). 204, July 2019, 103036. Lim, S.-J. et al. (2019) Attentional reorientation explains processing costs associated with talker variability. 19th Int. Congr. Phonetic Sci. 1–5. 1Otto, A.R., Daw, N.D. (2019) The opportunity cost of time modulates cognitive effort. Neuropsychologia. 123, May 2018, 92–105. Li, C. et al. (2007) Quantifying the cost of context switch. Proc. 2007 Work. Exp.
Comput. Sci. June, 13–14. Chang, T.W. et al. (2012) The effects of presentation method and information density on visual search ability and working memory load. Comput. Educ. 58, 2, 721– 731. Halverson, T., Hornof, A.J. (2004) Local Density Guides Visual Search: Sparse
Groups are First and Faster. Proc. Hum. Factors Ergon. Soc. Annu. Meet. 48, 16, 1860–1864. Tseng, Y.C., Howes, A. (2008) The adaptation of visual search strategy to expected information gain. Conf. Hum. Factors Comput. Syst. - Proc. April 2014, 1075– 1084. Peng, N. et al. (2021) Cueing effects of colour on attention management in multiple-
view visualisations: evidence from eye-tracking by using a dual-task paradigm. Behav. Inf. Technol. 0, 0, 1–19. Young, R.A. et al. (2013) The Tactile Detection Response Task: Preliminary Validation for Measuring the Attentional Effects of Cognitive Load. 71–77. Brungart, D.S. et al. (2019) The Effect of Walking on Auditory Localization, Visual
Discrimination, and Aurally Aided Visual Search. Hum. Factors. 61, 6, 976– 991. Einhäuser, W. et al. (2017) Newly acquired audio-visual associations bias perception in binocular rivalry. Vision Res. 133, 121–129.
Human Systems Engineering and Design (IHSED 2021) https://openaccess.cms-conferences.org/#/publications/book/978-1-7923-8987-0
LISTED IN THE AHFE DIGITAL BOOKSTORE CATALOGUE
Explore the complete digital volume
Human Systems Engineering and Design (IHSED2021): Future Trends and Applications
Read this individual research paper free through the original publisher, or explore the full digital proceedings book.
ISBN 978-1-7923-8987-0
Explore this ISBN in the AHFE Bookstore ↗Listed in the July 2026 bookstore catalogue; search by ISBN to confirm current availability · Digital book purchase optional