Ruoyu Hu, Xinyue Wang, Haiyan Wang, Chengqi Xue (2022). Cognitive Model for Probability Density Distribution Uncertainty Visualization. In: Intelligent Human Systems Integration (IHSI 2022): Integrating People and Intelligent Systems. AHFE Open Access, vol. 22. https://doi.org/10.54941/ahfe100933
People often obtain information and make judgments with the help of systems and machines, but due to the uncertainty in the instrument, environment, and data processing, the judgments made by the system are not always correct. Blindly believing the results of the system's decision-making is very dangerous, so effective information exchange between the system and users is the prerequisite to ensure correct decision-making, and it is extremely important to convey the uncertain information of the system to users. Visualization is an important way to inform users of uncertain information. At present, many scholars have conducted research on how to express the uncertainty contained in data. Then whether users can effectively recognize and understand these visual graphics becomes an issues to be explored.What this article wants to explore is how people recognize and understand visualization for uncertainty. Only by understanding the way people interpret visualization can the visualization be optimized and the information exchange between the system and users can be better realized.In this paper, the user’s perception of probability under the triangular distribution is studied. A symmetric distribution model and two asymmetric models are used. In each distribution model, 13 test points are selected according to the true value of the probability density. The experiment is realized by Unity3D. In each trial, the positions of the distribution model and the test points appear randomly. The experiment describes the task of using remote sensing technology to recognize camouflage targets. The participants need to answer the probability that the target to be detected represented by the test point is the enemy's camouflage target.This paper verifies the effectiveness of using the brightness gradient to visualize the uncertainty, and this conclusion is consistent with the results of previous studies. At the same time, this paper proposes a fitting model of the user's internal probabilistic cognition and the visual expression of probability density. We found that when the participants used the triangular probability distribution information expressed by the brightness gradient to infer the probability that the test point is a camouflage target, this perceived probability has a strong linear correlation with the true value of the probability density corresponding to the point. Participants will give a probability prediction close to 1 at the test point with the lowest brightness, that is, the highest probability density, and a probability prediction close to 0 at the highest brightness point, that is, the lowest probability density point. Fitting based on the linear model can obtain the probabilistic cognitive model of the subjects for the visualized graph.This article provides a way to realize the communication of uncertainty information between the system and the user, and may contribute some help to the effectiveness and reliability of artificial intelligence.
Intelligent Human Systems Integration (IHSI 2022): Integrating People and Intelligent Systems https://openaccess.cms-conferences.org/#/publications/book/978-1-7923-8988-7
INTRODUCTION
Uncertainties exist in many fields, such as weather forecasts, stock trends, etc. People need to use this uncertain information to make decisions, and propose response plans (Ma and Ji ,et al.2021. Procopio and Marianne, et al.2021). The uncertainty of remote sensing has brought about the phenomenon of the same spectrum with a different object and with the same object with different spectrum ( Malenovský and Zbyněk, et al.2019. Zi-jian et al.2019.), that is, the use of remote sensing to judge the types of ground objects may be wrong. This phenomenon may cause fatal losses on some important occasions, such as camouflage recognition.
Scholars use visualizations to inform users of the existence of uncertainty to avoid excessive trust in the system, so whether users correctly interpret the visualizations has become an important question that needs to be explored ( Hullman, Jessica, et al.2018. Celestine A et al.2010.). Jiang et al. found that using brightness uncertainty visualization is one of the best solutions to express uncertainty(Jiang et al.1996.). Kinkeldey C also mentioned the advantages of using brightness to visualize uncertainty ( Kinkeldey et al. 2014). In the study of Kubicek and Sasinka, participants believed that lighter colors expressed higher uncertainty (Kubíček, Petr, and Čeněk Šašinka.2011). This article hopes to provide some ideas for optimizing visualization by studying users' cognitive understanding of visualization. The main research questions are:
1. Whether brightness can effectively express the level of probability density;
2. How do the participants transform from probability density to probability;
3. Whether the participant’s perception of probability is affected by the width of the visualization graph.
We make the following hypothesises: H1. Participants can effectively obtain probability density information according to
the brightness level; H2. The probability prediction of the participant to the test point is related to the true
value of the probability density of the test point; H3. When the visualization width is narrower, the participants have a higher
tendency to predict the probability that the test point is a camouflaged target.
Intelligent Human Systems Integration (IHSI 2022): Integrating People and Intelligent Systems https://openaccess.cms-conferences.org/#/publications/book/978-1-7923-8988-7
EXPERIMENT
Method
The distribution function of the triangular distribution is a piecewise function. We have chosen a triangle with a base of 2 and a height of 1, and the abscissa is symmetric about the y-axis. There are three distribution models and they are named symmetrical distribution, downward skewed distribution, and upward skewed distribution. 13 test points are selected for each distribution, and the location of the test points is selected according to the true value of the probability density.
Figure.1. Visualization of brightness uncertainty under three distribution models.
Procedure The experiment process is implemented using Unity3D, a total of 3×13=39 trials, the distribution method and the location of the test points appear randomly.
In order to prevent conceptual confusion, the reflectivity of ground objects is described in terms of the amount of reflection under the condition of a fixed wavelength and a fixed amount of incidence. In the experiment, the participant will see visualization on the left side of the screen and drag the slider on the right side to answer.
The visualization graph reflects the statistical results obtained by measuring the reflection of the camouflaged target in the past. A low brightness indicates more camouflaged targets fall near this value; a high brightness indicates only a few camouflaged targets have reflections that fall near this value. The red test points represent unknown targets to be evaluated. The question that the participant needs to answer is: Given the distribution of reflections as shown in the figure, if there is a target ahead and the measured reflection is the value shown by the red dot, what is the probability that the target is the enemy camouflaged target ?
Intelligent Human Systems Integration (IHSI 2022): Integrating People and Intelligent Systems https://openaccess.cms-conferences.org/#/publications/book/978-1-7923-8988-7
Figure. 2. Trial example of a formal experiment.
Participant The participants were graduate students from the Department of Industrial Design, School of Mechanical Engineering, Southeast University. There were 18 participants, 7 males and 11 females, aged between 22 and 29. Participants have no knowledge background related to remote sensing but can understand the meaning of probability density.
RESULTS
The relationship between the abscissa of the test point and the probability perceived by the subject is shown in Fig.3. It can be seen that the participant can accurately perceive the highest point of the probability density, and the probability judgment of the participant on the test point under the same probability density is independent of the visualization method (F=0.092, P=0.912).
Figure. 3. The relationship between the abscissa of the test point in the distribution model and the participant's judgment of probability. (a) is the result of the symmetrical distribution; (b) is the result of the upper skewed distribution; (c) is the result of the lower skewed
distribution.
The relationship between the true value of the probability density of the test point and the probability perceived by the subject is shown in Fig.4. After performing a linear
Intelligent Human Systems Integration (IHSI 2022): Integrating People and Intelligent Systems https://openaccess.cms-conferences.org/#/publications/book/978-1-7923-8988-7 fitting, it was found that the goodness of fit exceeds 0.98 under the three distribution models. Carrying out correlation analysis, it is found that there is a very strong correlation between the perceptual probability and the true value of the probability density (F=577.122, P<0.001).
Figure. 4. The true value of the probability density of the test point and the probability perceived by the participant. (a) is the result of the symmetrical distribution; (b) is the result of the upper skewed distribution; (c) is the result of lower skewed distribution.
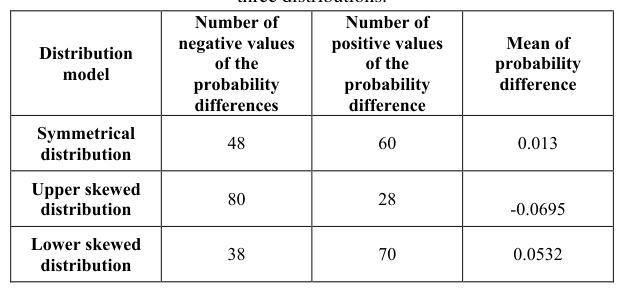
Table 1: Statistics of positive and negative probability differences under three distributions.
When selecting test points, there are two test points under the same probability density, one is located below the highest point of probability density, and the other is located above the highest point of probability density. Under the same probability density, subtract the probability that the participant perceives on the upper side from the probability that the participant perceives on the lower side to obtain the probability difference, and make statistics on the positive and negative of the probability difference.
Intelligent Human Systems Integration (IHSI 2022): Integrating People and Intelligent Systems https://openaccess.cms-conferences.org/#/publications/book/978-1-7923-8988-7
It can be seen that in the case of symmetric distribution, there is no difference in the probability judgment of the test point on the upper and lower sides (F=0.513, P=0.475); while in the asymmetric distribution model , there is a correlation between the relative position of the test point and the highest probability test point (upper skewed: F=11.629, P=0.001; lower skewed: F=8.760, P=0.003). Therefore, the probability that the participants perceive is affected by the interaction between the visualization method and the relative position of the test point (F=11.005, P<0.001).
DISCUSSION
From the above results, it can be seen that the participants can obtain the probability density information about the triangular distribution in the visualization, and transform the probability density information to the probability according to the probability density information. On the one hand, Kale et al. found that in the absence of additional means, users tend to rely on relative position(Kale et al. 2020). On the other hand, it is because the brightness has semantics that matches the uncertainty. This result is consistent with the research results of other scholars (Koo et al. 2018). MacEachren’s team believes that lightness has the advantage of visual semiotics when expressing uncertain information ( MacEachren et al. 2012.). In the research on the uncertainty of geographic attributes, Lu Y found that the advantage of color brightness in expressing uncertainty information is second only to boundary blur ( Scholz et al.2014). In human cognition, the influence of large or dark objects is greater than that of small, bright objects, and the influence of object groups is greater than that of isolated objects(Riveiro and Maria.2007).
The study also found that participants have a tendency to be overconfident about the highest value. At the same time, the participants have a tendency to use the probability density directly as the probability level. In addition, the study found that the probability judgment of participants for the same distribution will be affected by the width of the distribution. This conclusion is the same as the conclusion obtained by Tak S et al on temperature probability prediction of participants(Tak et al.2013 and 2015).
CONCLUSION
This article explores the participants’ cognition and understanding of the uncertain visualization using the triangular distribution of lightness and proposes a method of inferring the participants’ perception probability based on the true value of the probability density. We found that the participants would think that the probability of occurrence of the point with the highest probability density is close to 1, and the lowest is 0. According to the strong linear correlation between the predicted
Intelligent Human Systems Integration (IHSI 2022): Integrating People and Intelligent Systems https://openaccess.cms-conferences.org/#/publications/book/978-1-7923-8988-7 probability and the true value of the probability density, a probabilistic cognitive model of people that matches the visualization can be obtained. Knowing how the participants interpret the information expressed by the visualization can better realize the information exchange between the system and the user.
ACKNOWLEDGMENTS
The authors would like to thank Tan Taoyong for his help in mapping the experimental stimulus and writing the experimental program. This work was supported in part by a grant from Technology Funds of Fundamental Research Strengthening Plan (No. 2020-JCJQ-JJ-263) and National Natural Science Foundation of China (No. 71871056).
REFERENCES
Ma, Ji, et al. (2021)"Probabilistic Slider: A Tool for Visualizing Fuzzy Segmentation Uncertainties." IEEE Access 9: 28707-28715. Procopio, Marianne, et al. (2021) "Impact of Cognitive Biases on Progressive
Visualization." IEEE Transactions on Visualization and Computer Graphics. Malenovský, Zbyněk, et al. (2019)"Variability and uncertainty challenges in scaling imaging spectroscopy retrievals and validations from leaves up to vegetation canopies." Surveys in Geophysics 40.3: 631-656. Zi-jian, H. E., S. H. I. JIA-MING, and Z. H. A. O. DA-PENG. (2014) "Recognition
of camouflaged target by hyperspectral imaging system based on acousto-optic tunable filter." Laser & Infrared 44.7: 796-800. Hullman, Jessica, et al. (2018)"In pursuit of error: A survey of uncertainty visualization evaluation." IEEE transactions on visualization and computer graphics 25.1: 903-913. Celestine A. Ntuen, Eui H. Park & Kim Gwang-Myung (2010)"Designing an
Information Visualization Tool for Sensemaking. " International Journal of Human–Computer Interaction, 26:2-3 :189-205, DOI: 10.1080/10447310903498825 Jiang, B., A. Brown, and F. J. Ormeling. (1996) "Some perceptual aspects of colouring uncertainty." Advances in GIS Research II. London, UK: Taylor & Francis: 477-90. Kinkeldey, Christoph, Alan M. MacEachren, and Jochen Schiewe. (2014)"How to
assess visual communication of uncertainty? A systematic review of geospatial uncertainty visualisation user studies." The Cartographic Journal 51.4: 372-386. Kubíček, Petr, and Čeněk Šašinka. (2011) "Thematic uncertainty visualization usability–comparison of basic methods." Annals of GIS 17.4: 253-263. Kale, Alex, Matthew Kay, and Jessica Hullman. (2020) "Visual reasoning strategies
for effect size judgments and decisions." IEEE Transactions on Visualization and Computer Graphics.
Intelligent Human Systems Integration (IHSI 2022): Integrating People and Intelligent Systems https://openaccess.cms-conferences.org/#/publications/book/978-1-7923-8988-7
Koo, Hyeongmo, Yongwan Chun, and Daniel A. Griffith. (2018) "Geovisualizing attribute uncertainty of interval and ratio variables: A framework and an implementation for vector data." Journal of Visual Languages & Computing 44: 89-96. MacEachren, Alan M., et al. (2012) "Visual semiotics & uncertainty visualization:
An empirical study." IEEE Transactions on Visualization and Computer Graphics 18.12: 2496-2505. Scholz, Ruojing W., and Yongmei Lu. (2014)"Uncertainty in geographic data on bivariate maps: An examination of visualization preference and decision making." ISPRS International Journal of Geo-Information 3.4: 1180-1197. Riveiro, Maria. "Evaluation of uncertainty visualization techniques for information
fusion." 2007 10th International Conference on Information Fusion. IEEE, 2007. Tak, Susanne, Alexander Toet, and Jan van Erp. (2013) "The perception of visual uncertaintyrepresentation by non-experts." IEEE transactions on visualization and computer graphics 20.6: 935-943. Tak, Susanne, et al.(2015) “Public Understanding of Visual Representations of
Uncertainty in Temperature Forecasts.” Journal of Cognitive Engineering and Decision Making, vol. 9, no. 3, Sept. pp. 241–262, doi:10.1177/1555343415591275.
Intelligent Human Systems Integration (IHSI 2022): Integrating People and Intelligent Systems https://openaccess.cms-conferences.org/#/publications/book/978-1-7923-8988-7
LISTED IN THE AHFE DIGITAL BOOKSTORE CATALOGUE
Explore the complete digital volume
Intelligent Human Systems Integration (IHSI 2022): Integrating People and Intelligent Systems
Read this individual research paper free through the original publisher, or explore the full digital proceedings book.
ISBN 978-1-7923-8988-7
Explore this ISBN in the AHFE Bookstore ↗Listed in the July 2026 bookstore catalogue; search by ISBN to confirm current availability · Digital book purchase optional